
Key takeaways
ICT’s Pattern Recognition Fiber OTE NYO and Asian Session lesson, uploaded October 10, 2017, teaches a top-down EUR/USD hindsight framework using hourly equal lows and a sell-stop run, a bullish breaker reference narrated at 117.20, then a 15-minute break above a short-term high followed by a Fibonacci retracement measured from candle body to candle body…
Read the full summary
ICT’s Pattern Recognition Fiber OTE NYO and Asian Session lesson, uploaded October 10, 2017, teaches a top-down EUR/USD hindsight framework using hourly equal lows and a sell-stop run, a bullish breaker reference narrated at 117.20, then a 15-minute break above a short-term high followed by a Fibonacci retracement measured from candle body to candle body into the optimal trade entry region. The old high serves as the first target, followed by projected targets and a symmetrical price-swing objective. A bonus Asian-session example uses the same sequence, highlights a retracement near 62% at 4 minutes 2 seconds, and narrates a terminal level of 117.83. ICT states near 4 minutes 50 seconds that he took neither setup, while the automated transcript does not verify the chart symbol, date, fills, spread, slippage, execution or performance, so the examples are educational hindsight studies rather than a tested system or evidence of a reliable edge.
How we researched this article
BestProps used document-based research from primary firm sources, checked September 25, 2026. The complete source list, scope, limitations, and commercial-state record appear near the end of this article.
In Pattern Recognition – Fiber OTE NYO and Asian Session, uploaded October 10, 2017, ICT presents a short hindsight study involving what he calls a sell-stop run, a bullish breaker, a lower-timeframe market-structure break and an optimal trade entry (OTE). The spoken example concerns the “Eurodollar” (EUR/USD in his terminology), although the provided transcript alone cannot confirm the chart symbol, session date or every visual annotation.
The lesson is less a trade recap than an exercise in recognizing a sequence across timeframes. ICT explicitly says that he did not take either setup shown in the video. Accordingly, the examples should be read as his interpretation of historical price action, not as documented trade fills or evidence that the method provides a reliable edge.
ICT Pattern Recognition Through Repetition
ICT opens by explaining that repeated chart review is intended to help students notice familiar structures in real time. At 0:24, he describes the video as a quick educational example. He argues that students should repeatedly study old examples and compare lower-timeframe formations with higher-timeframe levels.
This is a training suggestion rather than a demonstrated performance result. A practical educational interpretation is to maintain a chart journal: record the proposed higher-timeframe level, define the pattern before reviewing what happened next, and note examples that fail as well as those that appear clean in hindsight. That approach can help limit hindsight bias, which the video does not formally test.
ICT Market Structure and OTE Setup
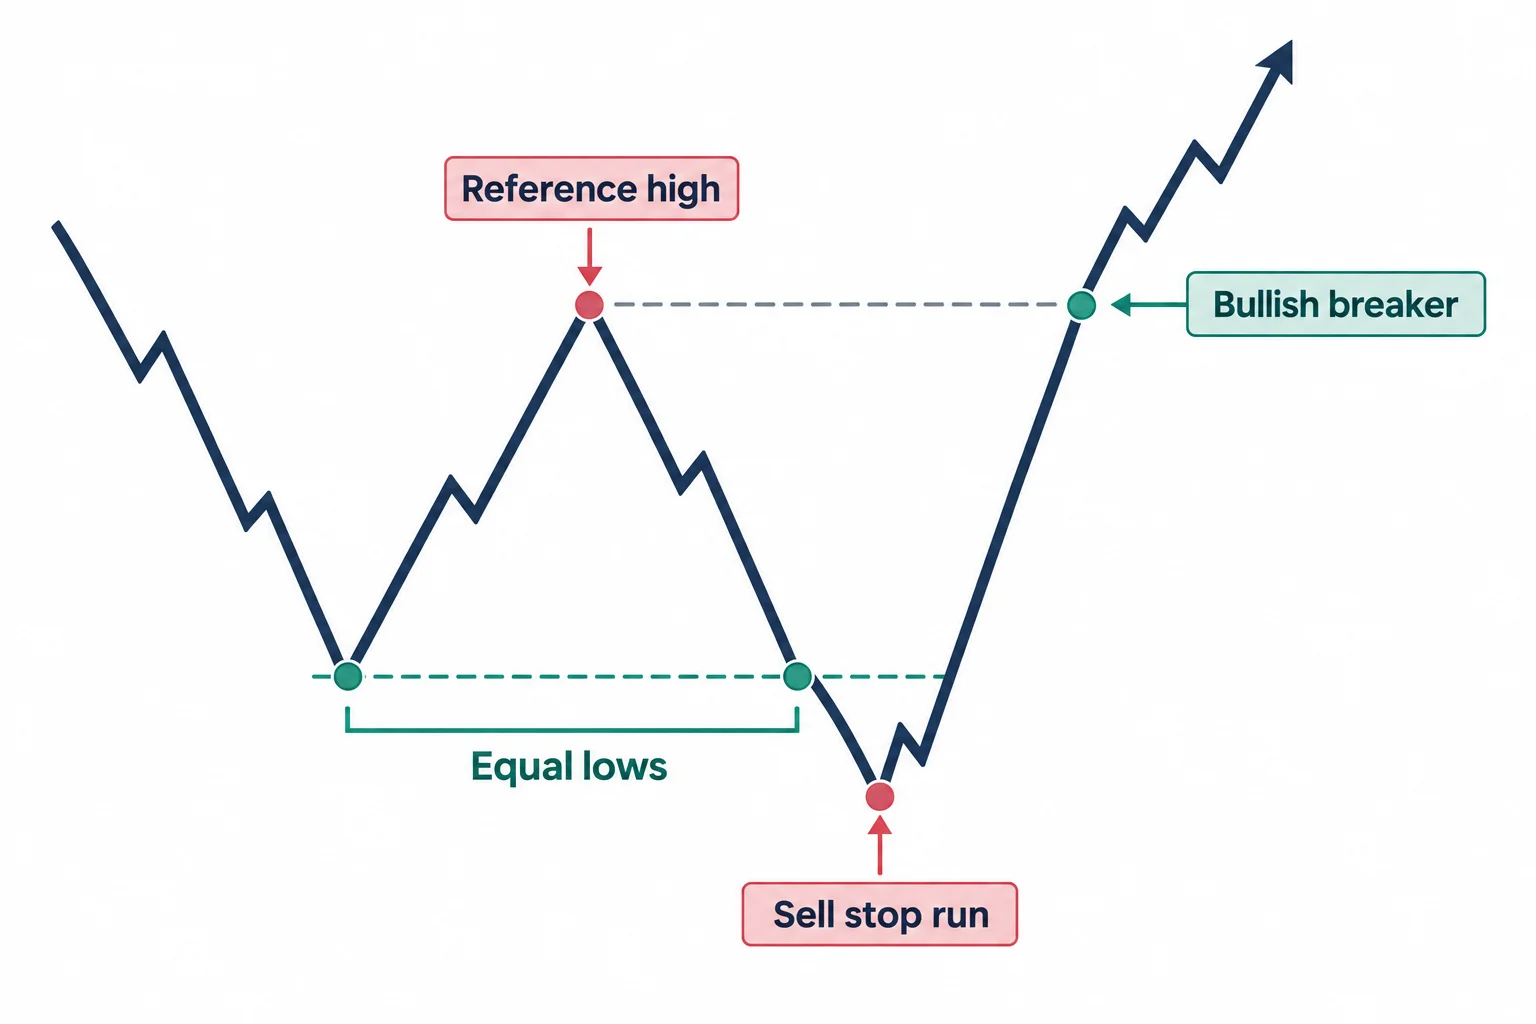
Beginning around 1:43, ICT turns to an hourly chart. He identifies equal lows followed by price moving sharply away and labels the event a “sell stop run.” He then looks for what he calls a bullish breaker: the high situated between the earlier low and the later move through the lows.
ICT states that this reference high is 117.20 and describes it as the higher-timeframe price level. Because the source is an automated transcript without chart verification, that number should be treated as a transcription of his narration rather than an independently confirmed chart value.
ICT Pattern Recognition on the 15-Minute Chart
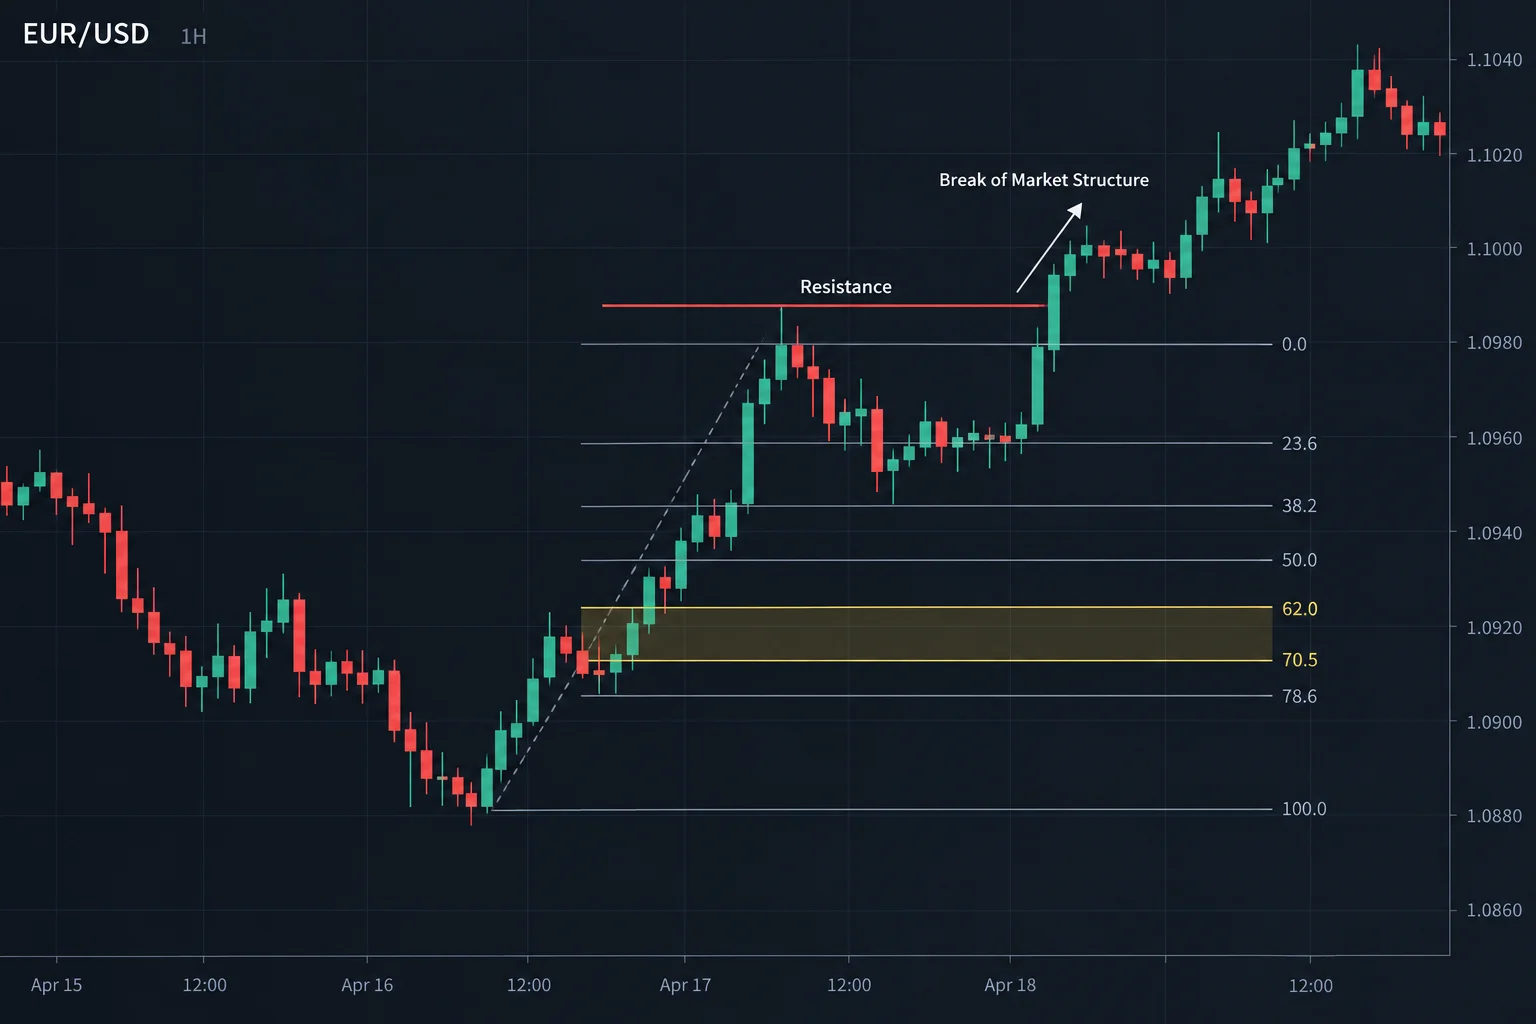
At 2:25, ICT moves to a 15-minute timeframe and adds time of day to the analysis. His sequence is:
- Begin with the previously identified higher-timeframe level.
- Wait for price to break a short-term high.
- Interpret that break as a bullish change or break in market structure.
- Measure the resulting upward impulse with a Fibonacci tool.
- Use candle bodies, rather than the full wick extremes, as the anchors.
- Watch for a retracement into the area ICT calls optimal trade entry.
At 2:59, he stresses that the measurement uses the candle bodies. He notes that a wick passes through the illustrated area slightly, while the bodies show what he considers a meaningful reaction. He then describes the old high as the first target and refers to additional projected targets.
ICT Asian Session Pattern Example
ICT introduces a second, bonus illustration at 3:23 and identifies it as occurring during the Asian session. The logic remains substantially the same: price is evaluated near a higher-timeframe level, a short-term high is broken, and the upward swing is measured from the lowest relevant candle body to the highest relevant body.
In this example, ICT highlights a retracement near the 62% level at 4:02. He then says price reached the first target, second target and a symmetrical price-swing objective. The narrated terminal level is 117.83. The transcript does not expose the chart itself, entry timing, spread, slippage or a subsequent performance record, so these visual and execution details cannot be independently established from the text.
ICT Fiber OTE NYO Pattern Summary
Near 4:50, ICT confirms that he did not take either trade and restates the teaching sequence. In condensed form, his framework is:
- Identify a higher-timeframe reference level.
- On a lower timeframe, wait for a short-term high to be exceeded.
- Measure the bullish impulse from body to body.
- Observe whether price retraces into the designated OTE region.
- Use the old high as an initial objective, followed by projection targets and a symmetrical swing.
ICT Pattern Recognition Takeaways
The video’s central lesson is pattern recognition through a consistent top-down process. The higher timeframe supplies context, while the lower timeframe supplies the proposed trigger and retracement measurement. The Asian-session segment is an additional example of the same template rather than a separately defined session strategy.
For careful study, each component should be defined before reviewing later candles: what qualifies as equal lows, how a stop run is distinguished from an ordinary breakout, which candle bodies become anchors, and what invalidates the idea. Those definitions are not fully formalized in this short clip. The video therefore works best as an introduction to ICT’s interpretation, not as a complete or independently validated trading system. This commentary is educational and is not investment advice.
Watch the ICT Pattern Recognition Lesson
This article draws on the timestamped transcription of Pattern Recognition – Fiber OTE NYO and Asian Session. The source was produced by automatic speech recognition of the recording’s audio, so it captures the speaker’s words but is not human-verified captions and does not independently verify chart detail, fills or results.
Watch the original lesson on YouTube
When the recording’s embedded player was opened on 22 September 2026, it reported a player configuration error (Error 153) and offered only a “Watch on YouTube” prompt instead of playback, so no embed or blank player is left here. The video itself is available directly on YouTube and loaded normally when its watch page was opened.
Watch Pattern Recognition – Fiber OTE NYO and Asian Session on YouTube ↗
ICT Pattern Recognition Sources and Further Reading
- The original Inner Circle Trader lesson: use the timestamp links in this article to compare the explanation with its source.
- YouTube’s embedding documentation: platform guidance relevant to the external watch link above.
- 17 CFR 4.41: disclosures concerning hypothetical performance: a regulatory reference, not a statement that a particular recording or this article meets every legal requirement.
This is independent educational commentary. It is not official ICT material, a tested trading system, or a claim that the reported results can be reproduced.



