
How we researched this article
BestProps used document-based research from primary firm sources, checked September 25, 2026. The complete source list, scope, limitations, and commercial-state record appear near the end of this article.
In OTE Pattern Recognition Series – Vol. 07, ICT uses a GBP/USD example to connect daily directional context with a lower-timeframe retracement during the New York session. This is the seventh lesson in a planned 20-video series and is presented as a chart-study exercise rather than a complete trading system or a recommendation to take a position.
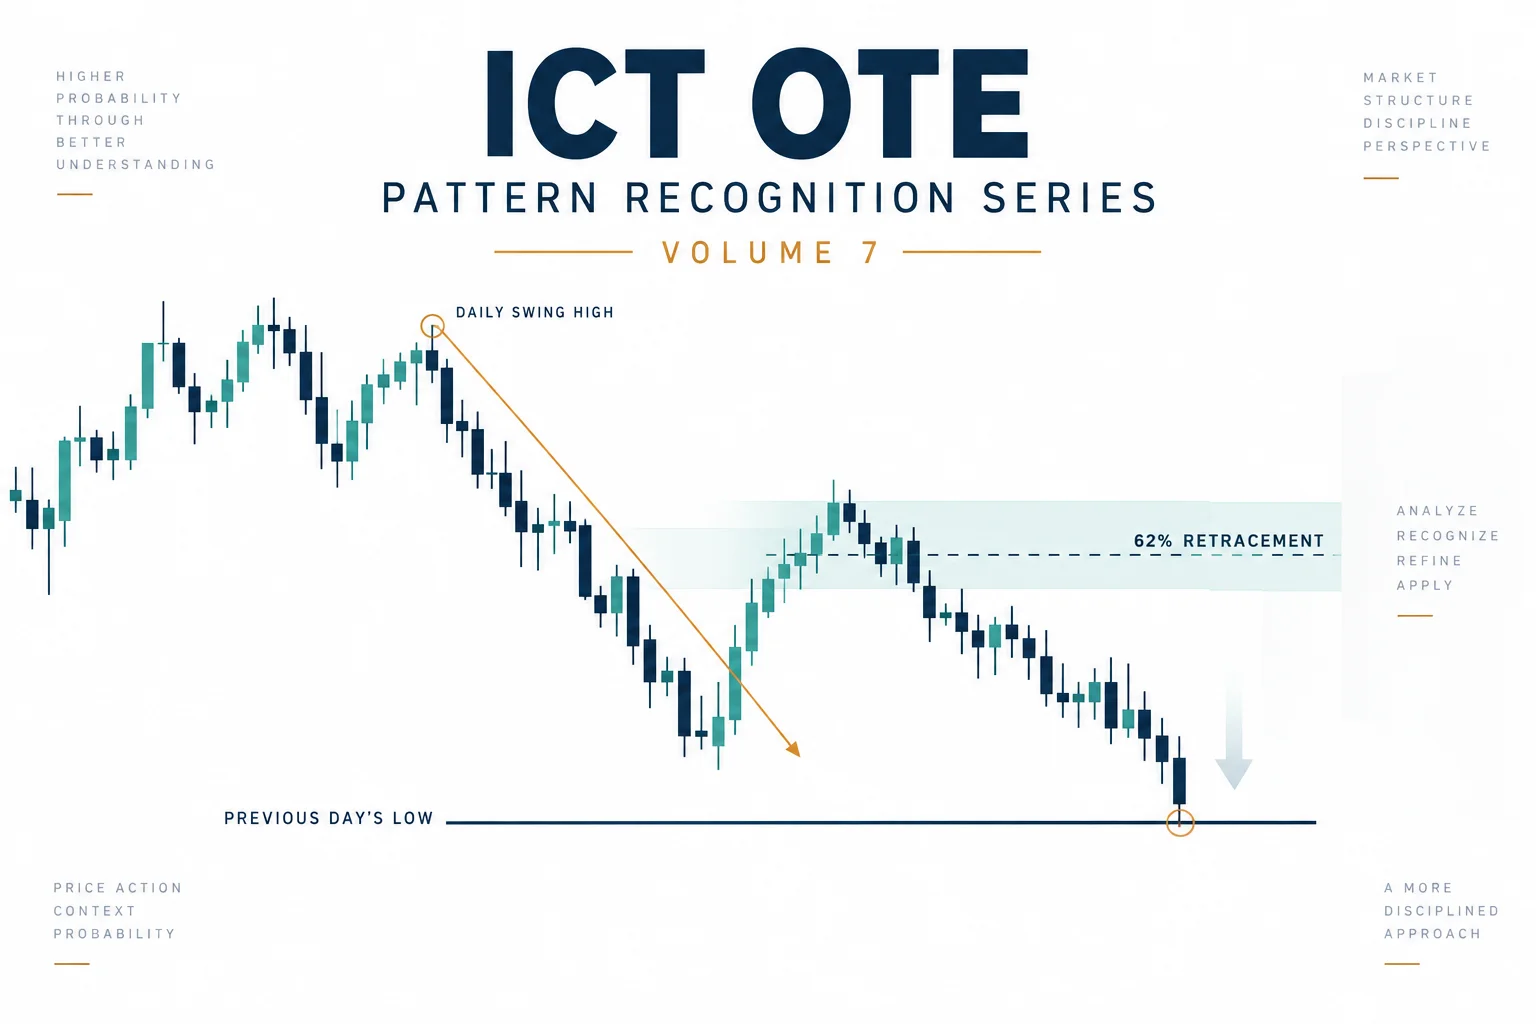
Volume 7 of ICT’s Optimal Trade Entry (OTE) Pattern Recognition Series uses a GBP/USD example to connect daily directional context with a lower-timeframe retracement during the New York session. The lesson is presented as a chart-study exercise rather than a complete trading system or a recommendation to take a position.
ICT Volume 7 GBP/USD Daily Range Walkthrough
ICT opens by identifying the example as the seventh installment in a planned 20-video series and introduces the British pound against the U.S. dollar. On the daily chart, he focuses on Thursday’s range while evaluating Friday’s price action. The central question is whether the current session is more likely to move through the previous day’s high or the previous day’s low.
At 0:57, ICT asks viewers to assess what the market has been doing throughout the week. In his reading of the displayed chart, successive sessions had repeatedly reached below their respective previous-day lows. He treats that recurring behavior as evidence favoring the prior low as the relevant draw for this example.
The captions render the quoted Thursday low inconsistently, so the exact price should be checked against the chart in the original recording. The educational point does not depend on reproducing that number: ICT marks the previous day’s low and uses it as the higher-timeframe reference level.
Why ICT OTE Challenges Support and Resistance
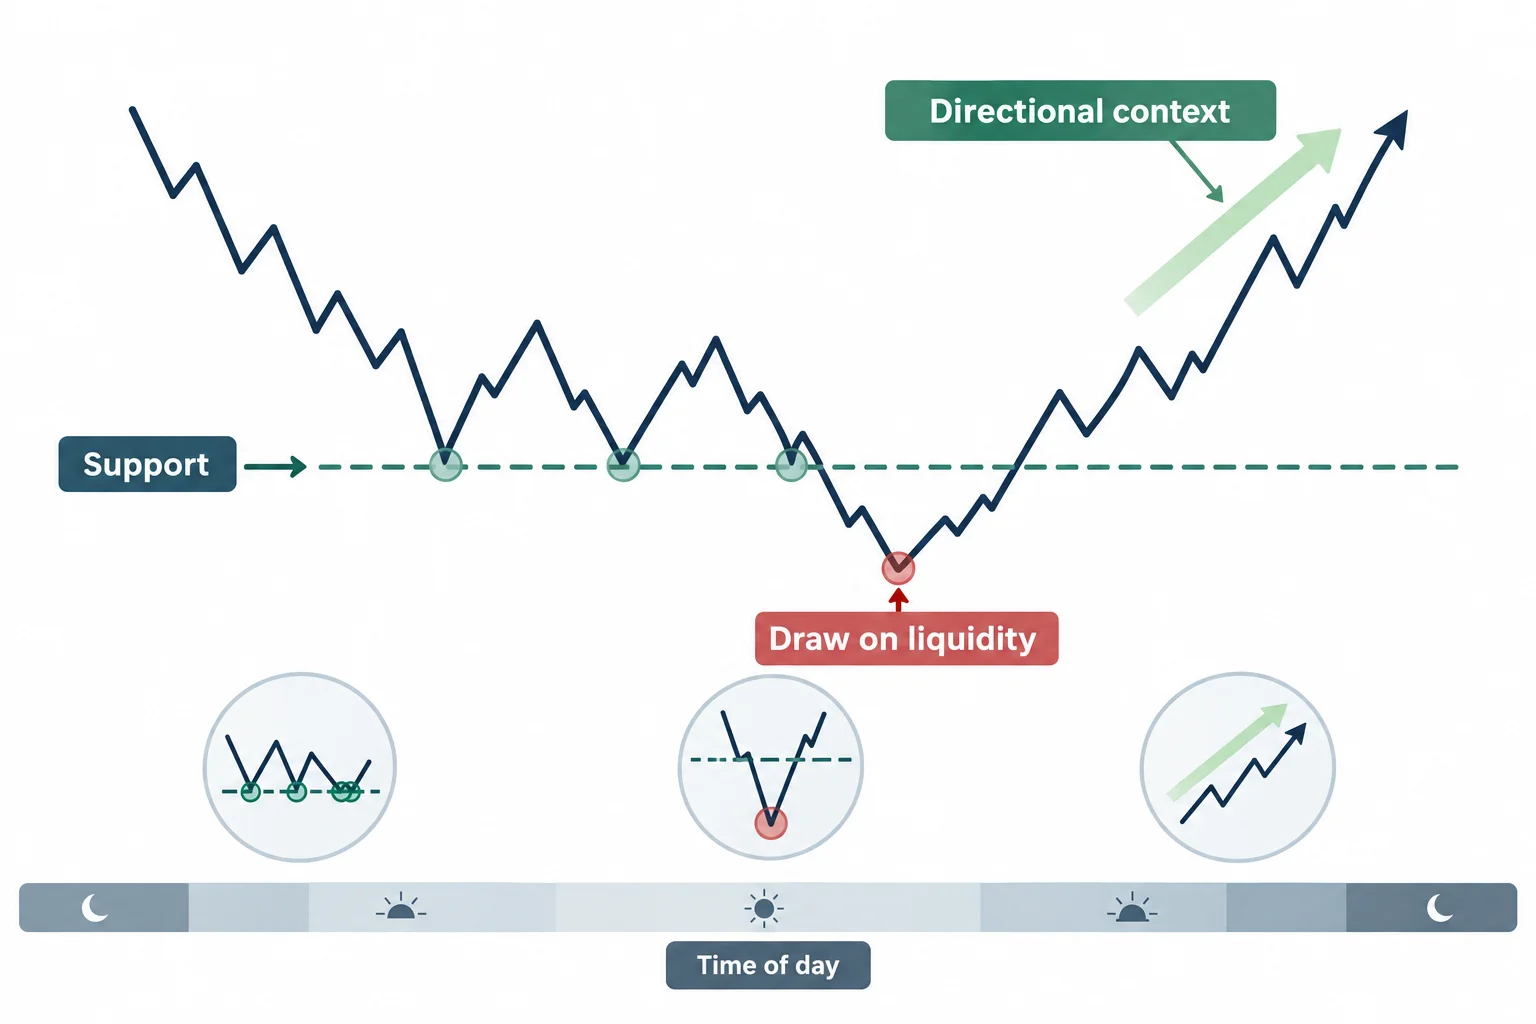
From approximately 1:20, ICT contrasts his analysis with a conventional retail support-and-resistance interpretation. He points to earlier lows that might have been labeled support because price had previously risen from them. In the example, however, price subsequently moves through those areas rather than reacting as a basic support model might anticipate.
His broader argument is that an old turning point should not automatically be treated as a dependable barrier. Within the framework taught in this series, directional context, the expected draw on liquidity and the time of day are considered before a lower-timeframe entry pattern is studied. This is ICT’s market interpretation, not proof that traditional support and resistance never works or that the OTE framework has a verified edge.
ICT OTE Five-Minute GBP/USD Pattern
ICT changes to a five-minute GBP/USD chart at 3:06. Before adding annotations, he invites viewers to pause and inspect the chart independently. That exercise is useful because pattern recognition is easier to evaluate when the answer has not already been marked.
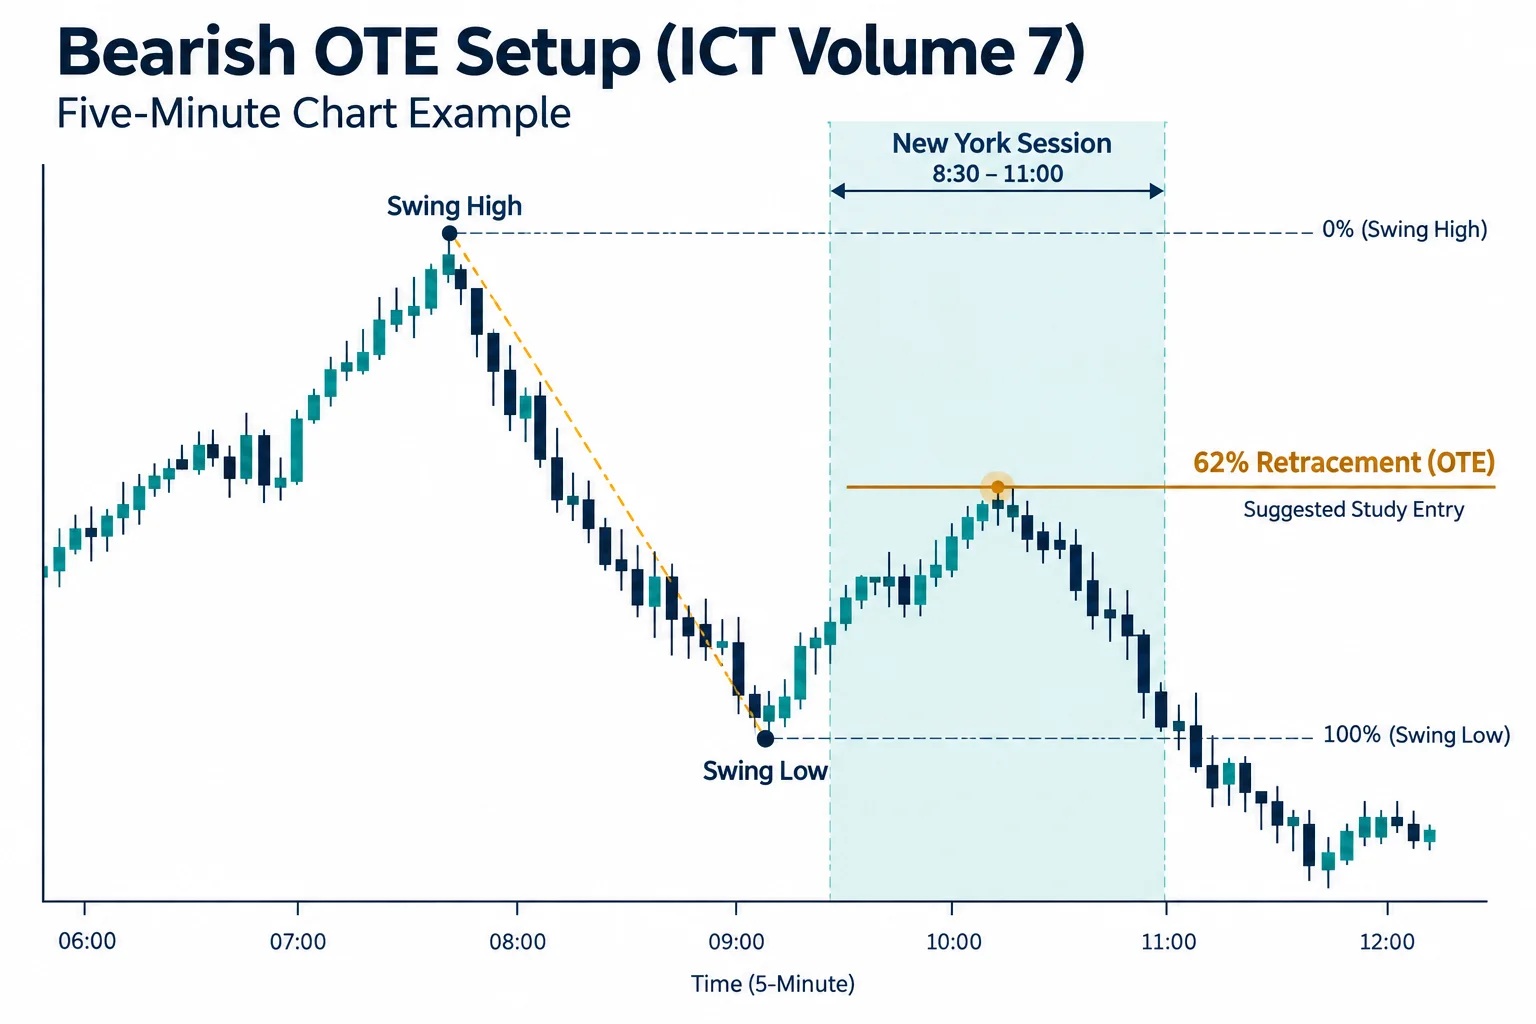
After annotating the chart, he identifies the following sequence:
- The previous day’s low supplies the larger directional objective.
- A lower-timeframe swing develops around the New York session.
- Price retraces upward within that bearish swing.
- The retracement reaches the 62% level ICT uses as a suggested OTE study entry.
- Price then breaks lower on the chart shown in the recording.
The discussion of the retracement begins near 3:54. ICT also says that more than one OTE could be mapped from smaller swings inside the broader decline. His emphasis is not merely on finding a Fibonacci percentage anywhere on a chart; the retracement is interpreted within a directional premise and a specified session window.
ICT OTE Time-of-Day Context
ICT associates the formation with the New York session and refers to a window beginning around 8:30 and extending to 11:00. The generated captions are unclear in this passage, including one phrase rendered as “static aiesec,” so viewers should consult the on-screen labels rather than infer a precise timezone or session definition from the transcript alone.
The supported takeaway is that time of day is one of the filters in this example. A 62% retracement by itself is not presented as the whole pattern.
ICT OTE Scaling Levels in Volume 7
At 4:27, ICT describes a first scaling level around the range low, which he characterizes as approximately 40 pips from the studied entry. He then discusses another projection derived from the Fibonacci range at roughly 75 pips.
These figures describe ICT’s annotations and interpretation of this historical chart example. The transcript does not establish an actual order, fill, account result, spread, slippage or final outcome after the recording. It also does not provide enough information to independently test how frequently this setup occurs or how it performs across a larger sample.
How to Study ICT OTE Volume 7
For educational review, the lesson can be reduced to a repeatable chart-reading checklist:
- Mark the preceding day’s high and low.
- Review recent sessions to form a directional hypothesis about which boundary may be approached.
- Move to the lower timeframe used in the lesson.
- Restrict the observation to the relevant session window.
- Identify a directional swing and measure its retracement.
- Record what happens at the 62% area without assuming the pattern must work.
- Separate projected scaling levels from actual, verifiable trade results.
Additional Resources
- Inner Circle Trader YouTube Channel — Official ICT channel hosting the full OTE Pattern Recognition Series
- OTE Pattern Recognition Series – Vol. 01 (Pilot) — Foundational video referenced in Volume 7
Volume 7 therefore illustrates ICT’s top-down OTE process: establish a daily reference, look for a lower-timeframe retracement aligned with that premise, and consider session timing. It should be understood as commentary on one displayed example, not investment advice or evidence of guaranteed profitability.



