
Key takeaways
ICT OTE Pattern Recognition Series Volume 20, uploaded June 5, 2020, closes the 20-part educational series with a EUR/USD five-minute chart showing price trade above the previous day’s high between eight thirty a.m.
Read the full summary
ICT OTE Pattern Recognition Series Volume 20, uploaded June 5, 2020, closes the 20-part educational series with a EUR/USD five-minute chart showing price trade above the previous day’s high between eight thirty a.m. and eleven a.m. New York time before retracing. At 58 seconds, ICT presents a hypothetical 1.1250 entry with eight pips of drawdown, a 30-pip stop loss, and narrated measurements of 47 pips at the old high, 86 pips at one-half standard deviation, and 124 pips at one standard deviation, though no actual fill, account result, calculation method, or verified outcome is provided. The core OTE lesson is that crossing a previous day’s high or low does not guarantee continuation and may precede a retracement, so traders should use objective prior-day levels, separate pattern recognition from execution, review multiple sessions, and build a watchlist rather than expect one instrument to produce a clean setup daily. ICT says commodities, foreign exchange, bonds, and crypto have distinct nuances and notes that he does not trade crypto. A transcript reference to a 17.5 level is unverified and may be a speech-recognition error, while the overall example remains ICT’s interpretation rather than evidence of a profitable trading edge.
How we researched this article
BestProps used document-based research from primary firm sources, checked September 25, 2026. The complete source list, scope, limitations, and commercial-state record appear near the end of this article.
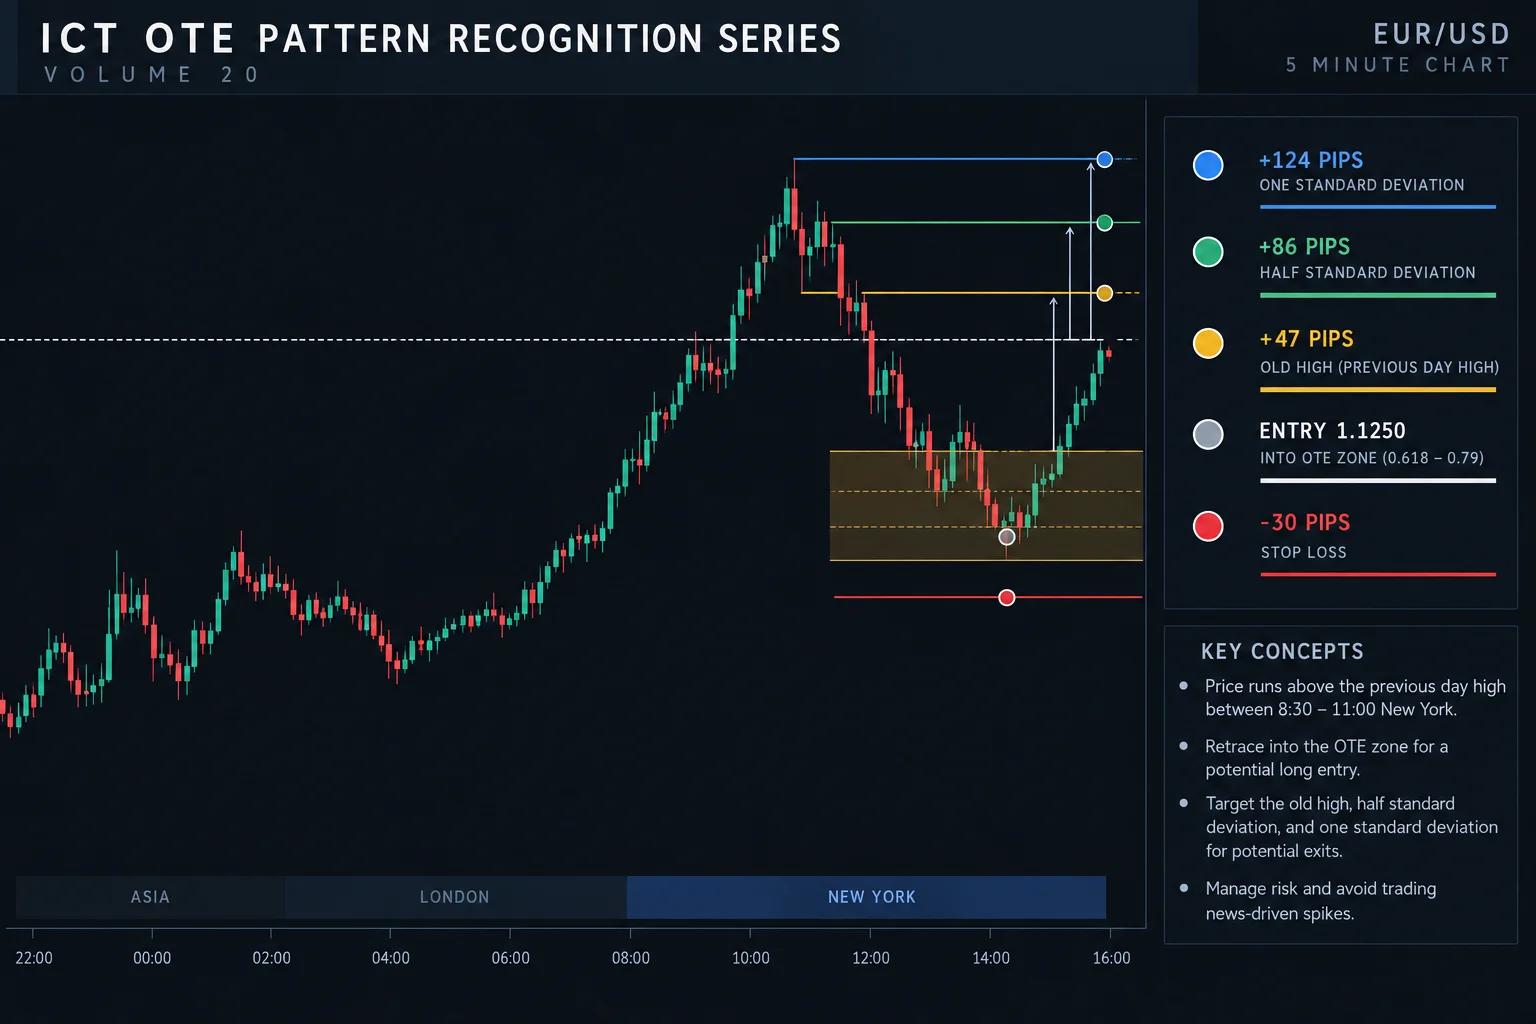
OTE Pattern Recognition Series – Vol. 20, uploaded June 5, 2020, concludes ICT’s 20-part series with a short EUR/USD example on a five-minute chart. The lesson focuses on recognizing a retracement after price trades above the previous day’s high. The discussion is educational and reflects ICT’s interpretation of the displayed market action, not an independently verified trading edge.
Watch the primary video on YouTube.
ICT OTE Volume 20 Setup
At 0:11, ICT introduces this as the twentieth and final installment in the series. The example uses EUR/USD on a five-minute chart. Viewers are initially invited to inspect the chart and identify the pattern themselves, reinforcing the series’ pattern-recognition format.
ICT then marks the previous day’s high and discusses activity between 8:30 a.m. and 11:00 a.m. New York time. Beginning at 0:39, he describes price running above that prior high and subsequently retracing. In ICT’s framework, the move above the old high is not automatically evidence that price must continue upward. It may instead precede a move back into a retracement area.
The automated transcript renders one referenced retracement point as the “17.5 level.” Because the chart cannot be verified from the transcript alone and the term may be a speech-recognition error, that level should not be treated as a confirmed technical value.
OTE Example Entry and Measurements
At 0:58, ICT gives a hypothetical entry at 1.1250 for the YouTube model. He says that this entry would have experienced eight pips of drawdown and refers to a 30-pip stop loss. He then states measurements of 47 pips at the old high, 86 pips at one-half standard deviation, and 124 pips at one standard deviation.
These figures are the speaker’s narration of the chart example. The transcript does not establish an actual order, fill, account result, or independently confirmed outcome. It also does not provide enough visual information to reconstruct how the standard-deviation levels were calculated.
Previous Day High in the ICT OTE Example
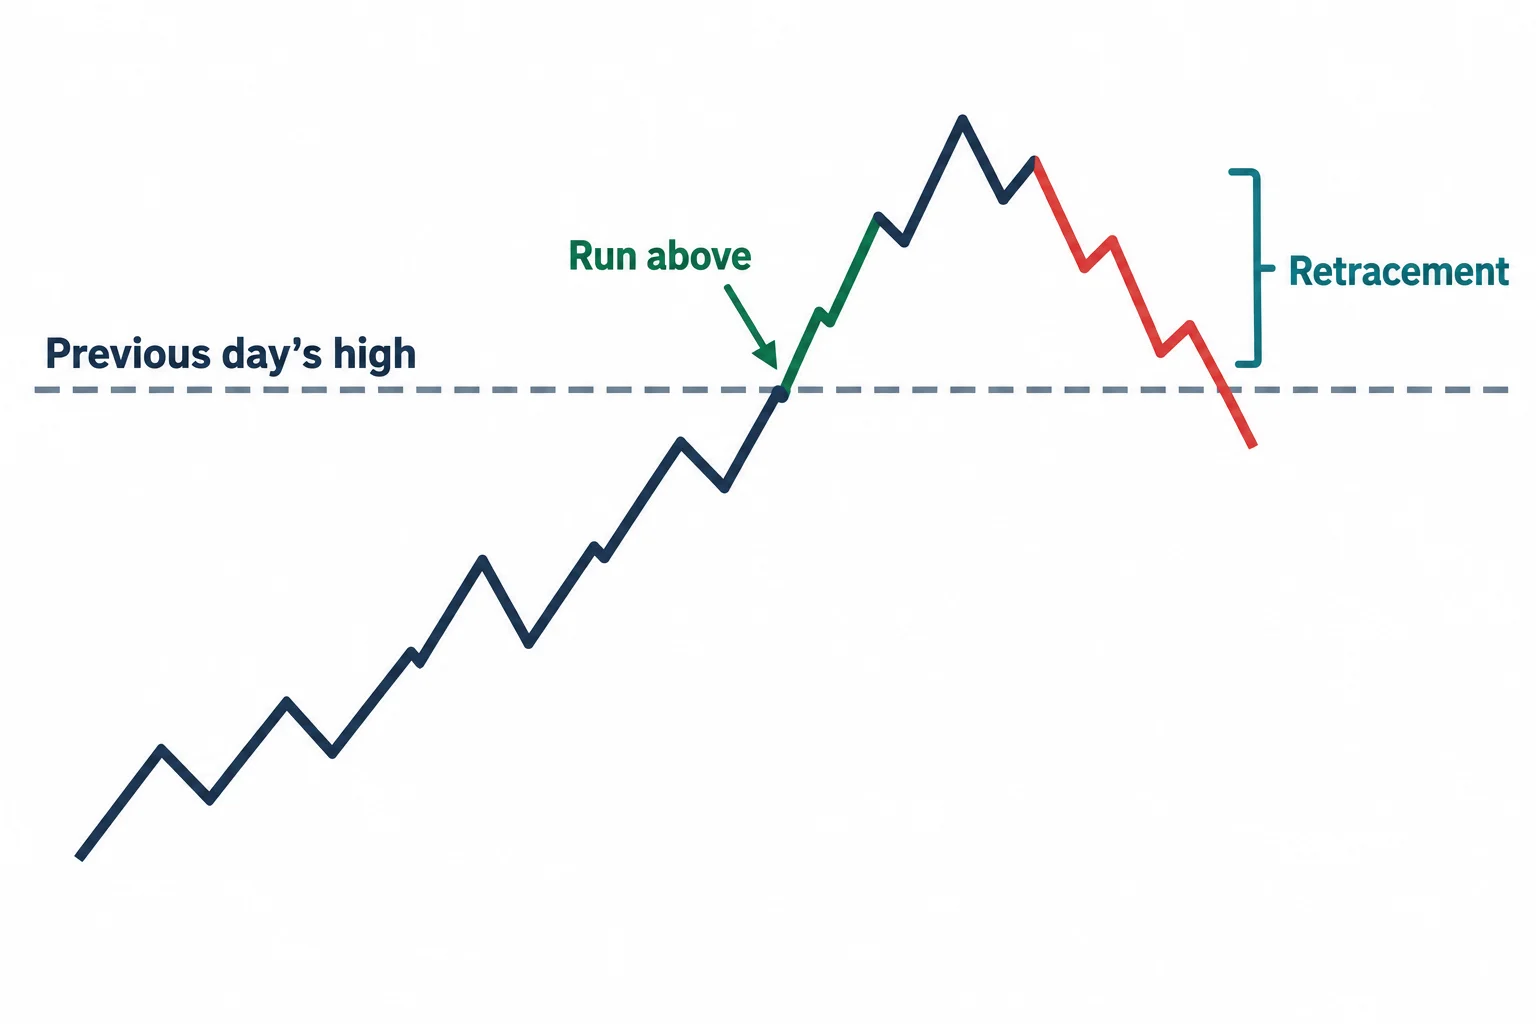
From 1:51, ICT returns to a recurring idea from the series: an OTE-style setup can develop after price trades above the previous day’s high or below the previous day’s low. Under his interpretation, crossing one of those reference points does not necessarily mark the end of the move.
He argues that traders can mistake this behavior for a reversal or topping formation. His preferred reading of this particular example is that the run above the prior high helped set up a retracement lower. This is a description of ICT’s market model rather than proof that every prior-day high or low will produce the same response.
ICT also briefly compares asset classes at 2:32. Drawing on his own experience, he says commodities, foreign exchange, bonds, and crypto can each have market-specific nuances. He explicitly notes that he is not a crypto trader.
ICT OTE Pattern Recognition Lesson
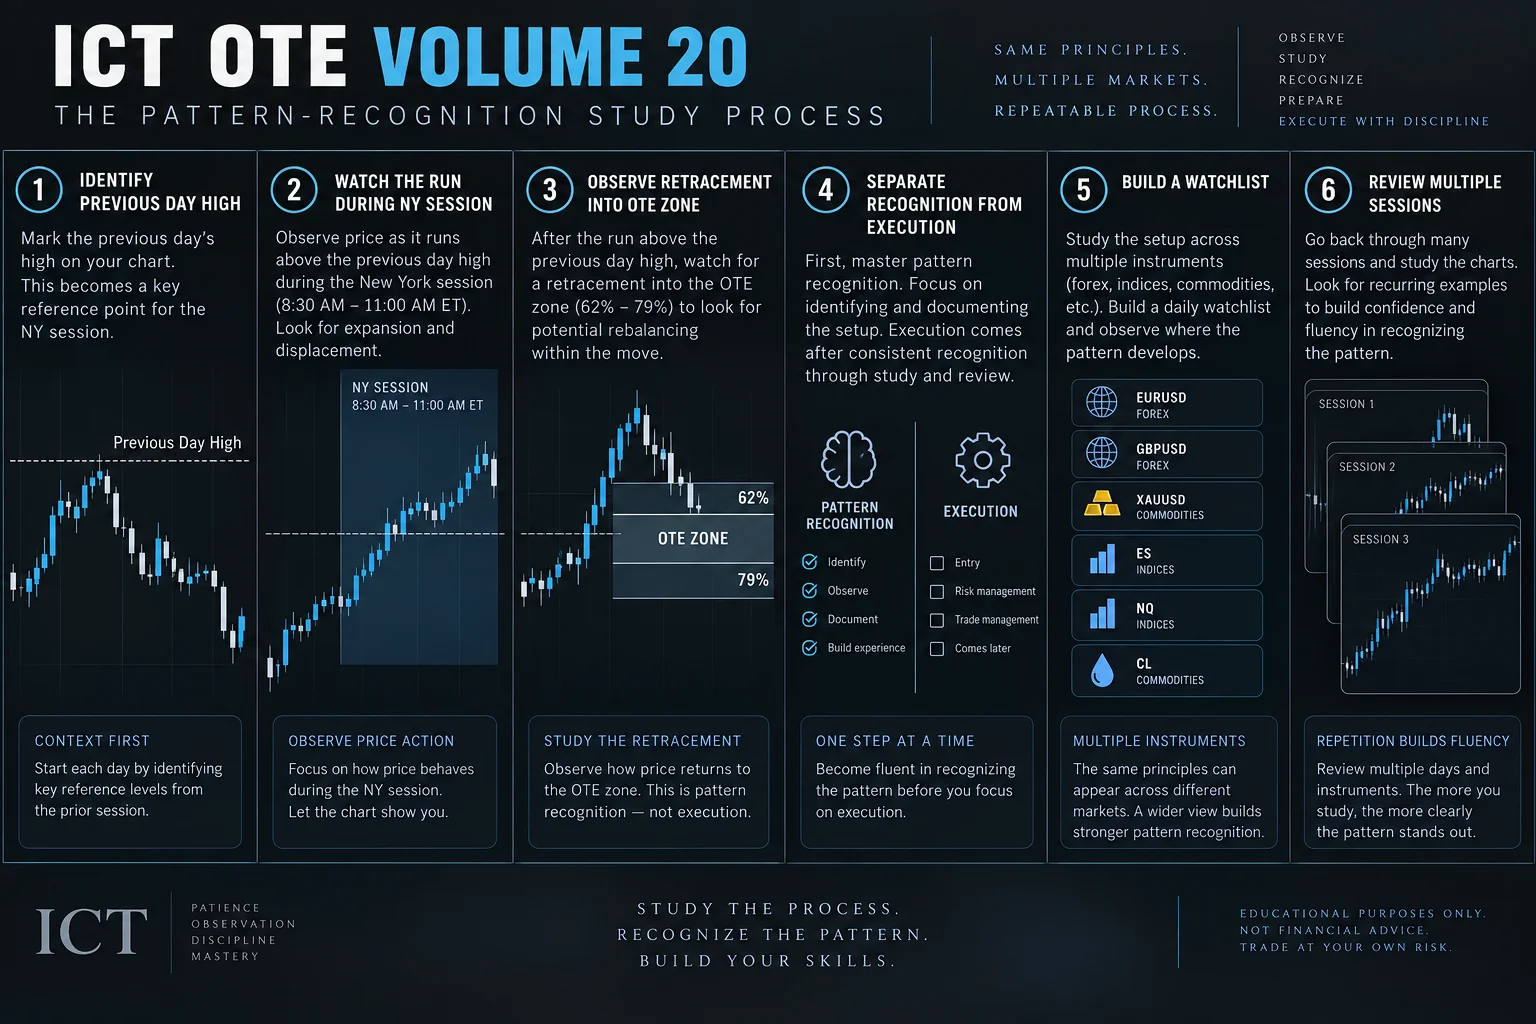
The final section places the 20 videos in the context of roughly one trading month. At 3:15, ICT encourages viewers to review the short examples multiple times. The purpose is to practice logging and recognizing what he calls an optimal trade entry rather than assuming one market will deliver the same clean pattern every day.
That qualification is important. ICT says the pattern may be found somewhere each day within his framework, but not necessarily in the single instrument a trader happens to follow. A chosen market may not make an obvious run above the prior day’s high or below its prior day’s low on a given session. He therefore mentions building a watchlist rather than expecting a setup from one pair every day.
Applying the ICT OTE Pattern Example
- Start with an objective reference: The previous day’s high or low provides a visible point around which to organize observations.
- Do not infer direction from a level crossing alone: In ICT’s example, trading above the prior high was followed by a retracement rather than uninterrupted continuation.
- Separate recognition from execution: A historical chart pattern does not by itself define order type, slippage, risk, or whether a trade could have been filled as imagined.
- Avoid daily-pattern assumptions: The speaker expressly warns that the same market will not necessarily provide a clean version of the setup every day.
- Review across a sample: The series presents repeated examples to encourage observation over multiple sessions, not reliance on one especially clear chart.
This episode is best understood as a compact closing exercise in ICT’s OTE pattern-recognition framework. It does not supply a complete strategy specification or evidence of profitability. Any practical study would require clearly defined rules, chart verification, costs, and risk controls. Nothing here is investment advice or a promise of performance.
Watch the original ICT lesson on YouTube
The video cannot be played inside another website: when its embedded player was opened and clicked on 21 September 2026, the player itself reported “Playback on other websites has been disabled by the video owner.” and settled on a “Watch on YouTube” prompt, with no duration and no playback progress reported. That message is the reason no embed is reserved here; the recording is available directly on YouTube.
Primary source and further reading
- The original Inner Circle Trader lesson, Volume 20: use the timestamp links in this article to compare the explanation with its source.
- YouTube’s embedding documentation: platform guidance relevant to the external watch link above.
- 17 CFR 4.41: disclosures concerning hypothetical performance: a regulatory reference, not a statement that a particular recording or this article meets every legal requirement.
This is independent educational commentary. It is not official ICT material, a tested trading system, or a claim that the reported results can be reproduced.



