
Key takeaways
ICT Volume 10 is a short YouTube lesson in a planned 20-video Optimal Trade Entry pattern-recognition series using AUD/USD on a five-minute chart, where price moves above Tuesday’s previous daily high during the New York session and retraces into an OTE zone marked by the 79% and 70.5% sweet-spot levels.
Read the full summary
ICT Volume 10 is a short YouTube lesson in a planned 20-video Optimal Trade Entry pattern-recognition series using AUD/USD on a five-minute chart, where price moves above Tuesday’s previous daily high during the New York session and retraces into an OTE zone marked by the 79% and 70.5% sweet-spot levels. ICT describes a hypothetical entry near the 62% retracement, a 10-pip stop and roughly 30 pips of potential to a 0.6610 target, while also treating 0.6600 as a practical round-number objective near a one-standard-deviation projection. At 1 minute 42 seconds he outlines customized projections including negative 1.5 and levels labeled half, one, one-and-a-half and two standard deviations, but at 3 minutes 11 seconds stresses that these extensions are rough tools for organizing entries, stops and targets rather than levels price must reach. The core setup prioritizes liquidity above the previous daily high, session timing and the nearby big figure over Fibonacci as a standalone signal, and the transcript cannot independently verify the chart prices, hypothetical fill or outcome.
How we researched this article
BestProps used document-based research from primary firm sources, checked September 25, 2026. The complete source list, scope, limitations, and commercial-state record appear near the end of this article.
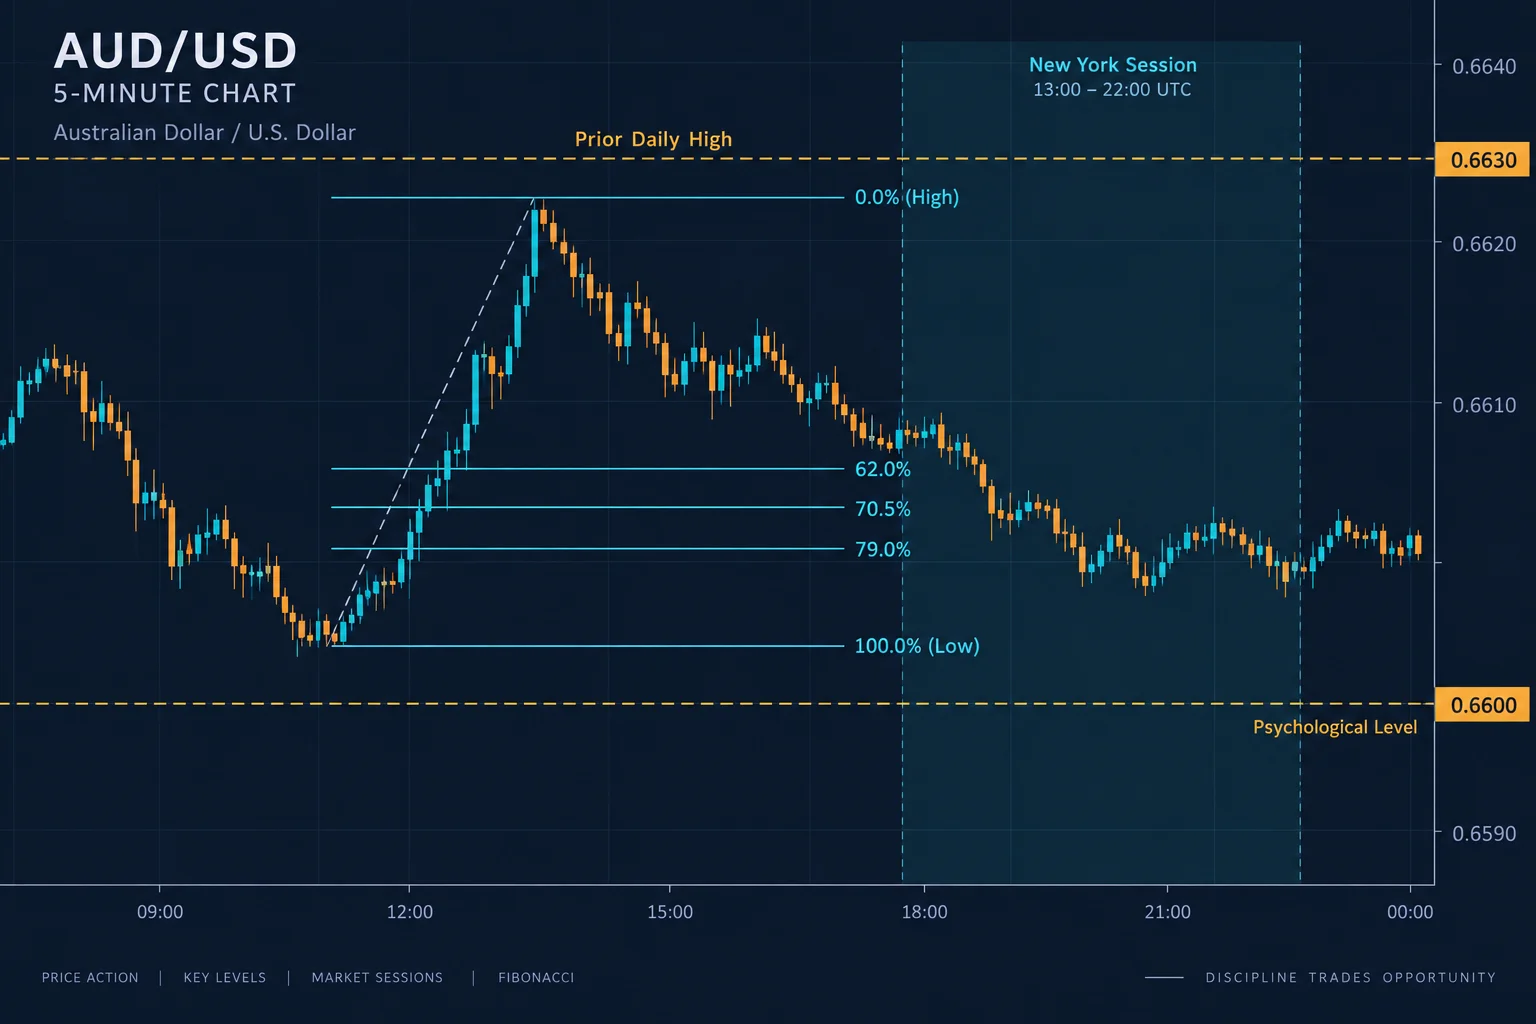
In OTE Pattern Recognition Series – Vol. 10, ICT presents a short Optimal Trade Entry example using AUD/USD on a five-minute chart. The lesson focuses on combining a retracement framework with the previous daily high, the New York session and a nearby round-number price level.
This explanation is based on an automatically generated transcript of the original audio and cannot independently verify the chart’s visible prices, annotations, hypothetical fill, or later outcome.
ICT OTE Market Context
ICT introduces the lesson as the tenth installment in a planned 20-video pattern-recognition series. At 0:10, he identifies the instrument as the Australian dollar against the US dollar and says the chart is set to the five-minute timeframe.
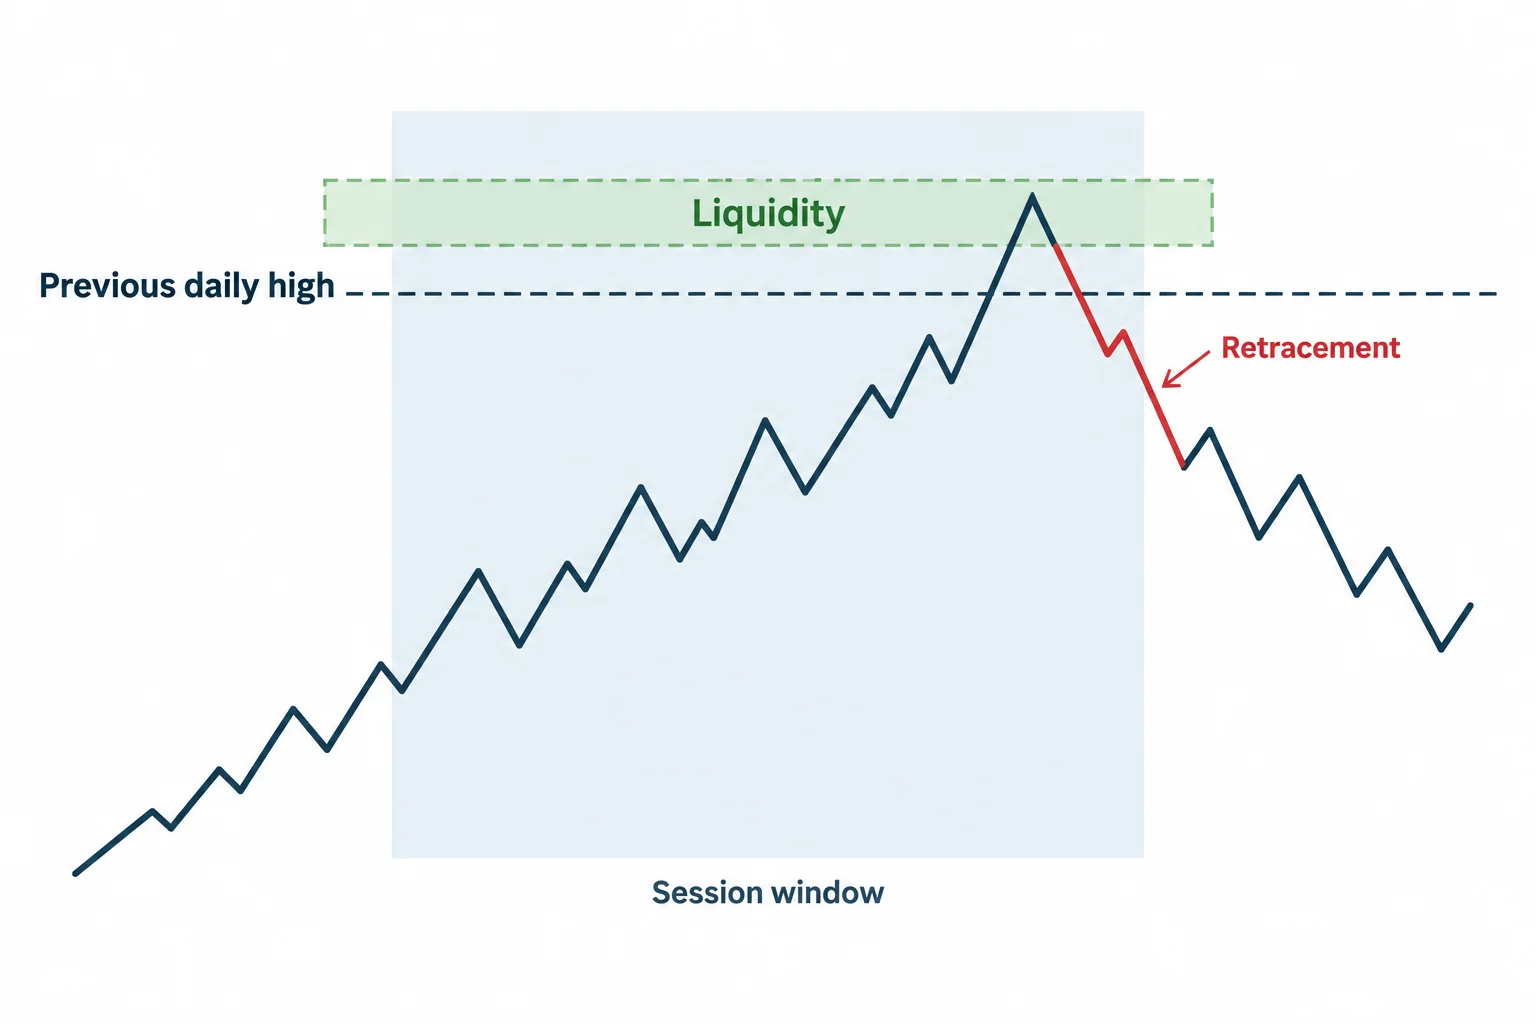
The setup begins with Tuesday’s previous daily high marked on the chart and a New York session window highlighted. According to ICT’s narration at 0:38, price reaches slightly above that earlier high and then retraces during the selected time window. In ICT’s interpretation, the move above the old high represents a run into liquidity rather than a level that must act as a permanent barrier.
That distinction matters to the lesson: ICT is not presenting the Fibonacci tool as a self-contained signal. His stated framework begins with a market objective (liquidity around the prior daily high) and uses the retracement levels to organize a possible entry, stop and target.
How ICT Uses the OTE Framework
After the move through the previous daily high, ICT places a Fibonacci tool from a low to a high. At 1:07, he describes the subsequent pullback as reaching the OTE retracement area. He specifically mentions the 79% retracement and the 70.5% level, calling the latter a “sweet spot.”
He then describes price expanding upward, returning to find support around the prior daily high, and moving above the 0.6600 round-number area. These are ICT’s chart observations and market interpretation; the transcript alone does not permit independent confirmation of the candles or exact sequence.
ICT Fibonacci Extensions for Price Projections
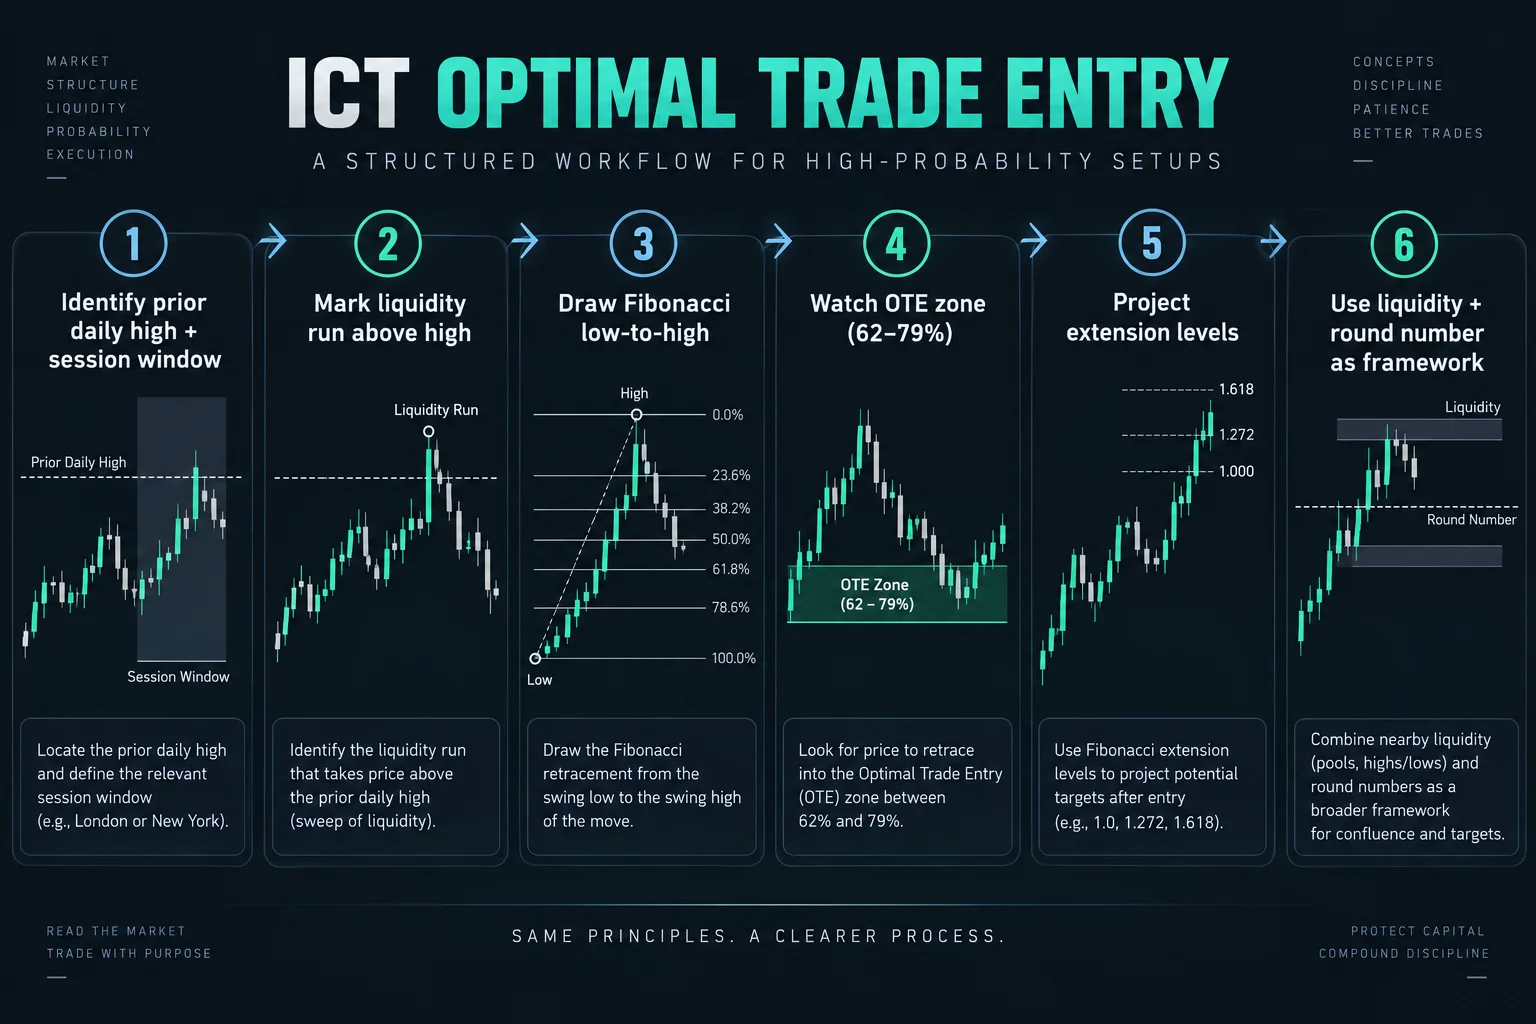
At 1:42, ICT revisits the customized Fibonacci levels used in the series. He says a negative 1.5 level can be added alongside extension levels he characterizes as half, one, one-and-a-half, and two standard deviations.
The terminology is specific to the framework being taught. These Fibonacci extensions should not automatically be interpreted as statistically measured standard deviations unless a separate calculation establishes that relationship. In this lesson, they function as labeled projection levels on ICT’s charting tool.
ICT OTE Entry Stop and Target
Around 2:13, ICT cites an entry near the 62% retracement and identifies a particular candle as the hypothetical fill location. The automated transcript renders the entry number as “65,776,” which is likely missing decimal formatting, so the exact value should be checked directly against the chart.
ICT then discusses a 10-pip stop and says that approximately 30 pips were available when using 0.6610 as the target. This is a retrospective illustration narrated over a chart, not transcript evidence of an executed trade, actual fill, or realized result.
He also considers the 0.6600 “big figure.” Although that round number did not precisely align with one of his Fibonacci levels, ICT reasons that a move through Tuesday’s high could continue beyond the round-number area. As an alternative, he points to the one-standard-deviation projection and rounds the objective down to 0.6600 rather than requiring the exact plotted extension.
ICT OTE Pattern Structure Over Prediction
The most important qualification arrives at 3:11. ICT says the Fibonacci tool provides a rough framework for structuring entries, stops, and potential targets. He explicitly states that the extension levels do not have to be reached.
Within his analysis, the more important reference is the liquidity he identifies above the old daily high, supplemented by the nearby round-number level. He also says that identifying the absolute high is outside the scope of this brief YouTube lesson.
ICT OTE Educational Takeaways
- Start with context: The example first identifies a previous daily high and a specific session window before applying a retracement tool.
- Separate retracement from projection: ICT uses the OTE area to discuss a possible entry region and extension levels to organize possible objectives.
- Treat levels as zones or references: The speaker cautions against demanding exact contact with every projected level.
- Distinguish analysis from execution: A marked chart can illustrate a setup, but it does not establish that a trade was filled or that the stated result was realized.
This material summarizes ICT’s interpretation of one historical chart example. It is educational commentary, not investment advice or a promise that the pattern will produce similar outcomes.
Watch ICT OTE Pattern Recognition Volume 10
If the embed does not play, watch on YouTube.
More ICT OTE Pattern Recognition Resources
- ICT Optimal Trade Entry Pattern Recognition Series (full playlist) – the complete 20-video series this lesson belongs to.
- AUD/USD live chart on TradingView – for reference to the instrument discussed.
- Fibonacci retracement basics (BabyPips) – general background on the retracement tool used in this lesson.
- Liquidity definition (Investopedia) – reference for the liquidity concept central to ICT’s framework.



