
Key takeaways
ICT Mastering High Probability Scalping Volume 3 of 3 presents an unverified discretionary forex framework using daily directional bias, London-session price action, and early New York retracements.
Read the full summary
ICT Mastering High Probability Scalping Volume 3 of 3 presents an unverified discretionary forex framework using daily directional bias, London-session price action, and early New York retracements. Bullish setups require a rejected London decline and rally, then roughly 20 pips of retracement between 7 and 9 a.m. New York time toward the 62% Fibonacci level. Bearish setups invert the rules, seeking a rally above the midnight New York open, rejection, a London decline of about 25 to 30 pips, and a roughly 20-pip upward retracement after 7 a.m. Aggressive traders may consider 10 to 15 pips, but the standard rule is 20 pips and no trade if it has not occurred by 9 a.m. Prior hourly highs or lows that caused strong reactions may create reversal risk, though ICT stresses that these levels can fail and losses are unavoidable. Risk guidance starts with demo practice and 1% of equity per setup, potentially rising to 2% based on tolerance. A hypothetical $1,000 account with a 20-pip stop risks $10, about $0.50 per pip or five micro lots before costs. Exit options include partial profits, moving stops to break even at later Fibonacci targets, scaling out, or closing at a symmetrical price swing, but ICT admits his exits are discretionary and lack fixed allocation rules. The lesson favors studying open, high, low, and close over numerous indicators, while its chart examples, execution claims, and account-growth projection are not independently verified evidence of a repeatable edge.
How we researched this article
BestProps used document-based research from primary firm sources, checked September 25, 2026. The complete source list, scope, limitations, and commercial-state record appear near the end of this article.
In ICT – Mastering High Probability Scalping Vol. 3 of 3, uploaded November 11, 2017, ICT presents a discretionary forex scalping framework built around daily directional bias, London-session price action, and retracements during the early New York session. He also discusses hourly reversal levels, position sizing, partial exits, and the limits of certainty in trading.
This is a summary of ICT’s interpretation of price action, not evidence that the method has a proven edge. The transcript cannot independently verify the charts, entries, fills, or results referenced in the presentation.
▶ Watch the source recording: ICT – Mastering High Probability Scalping Vol. 3 of 3 on YouTube
ICT Scalping With Power of Three and Session Context
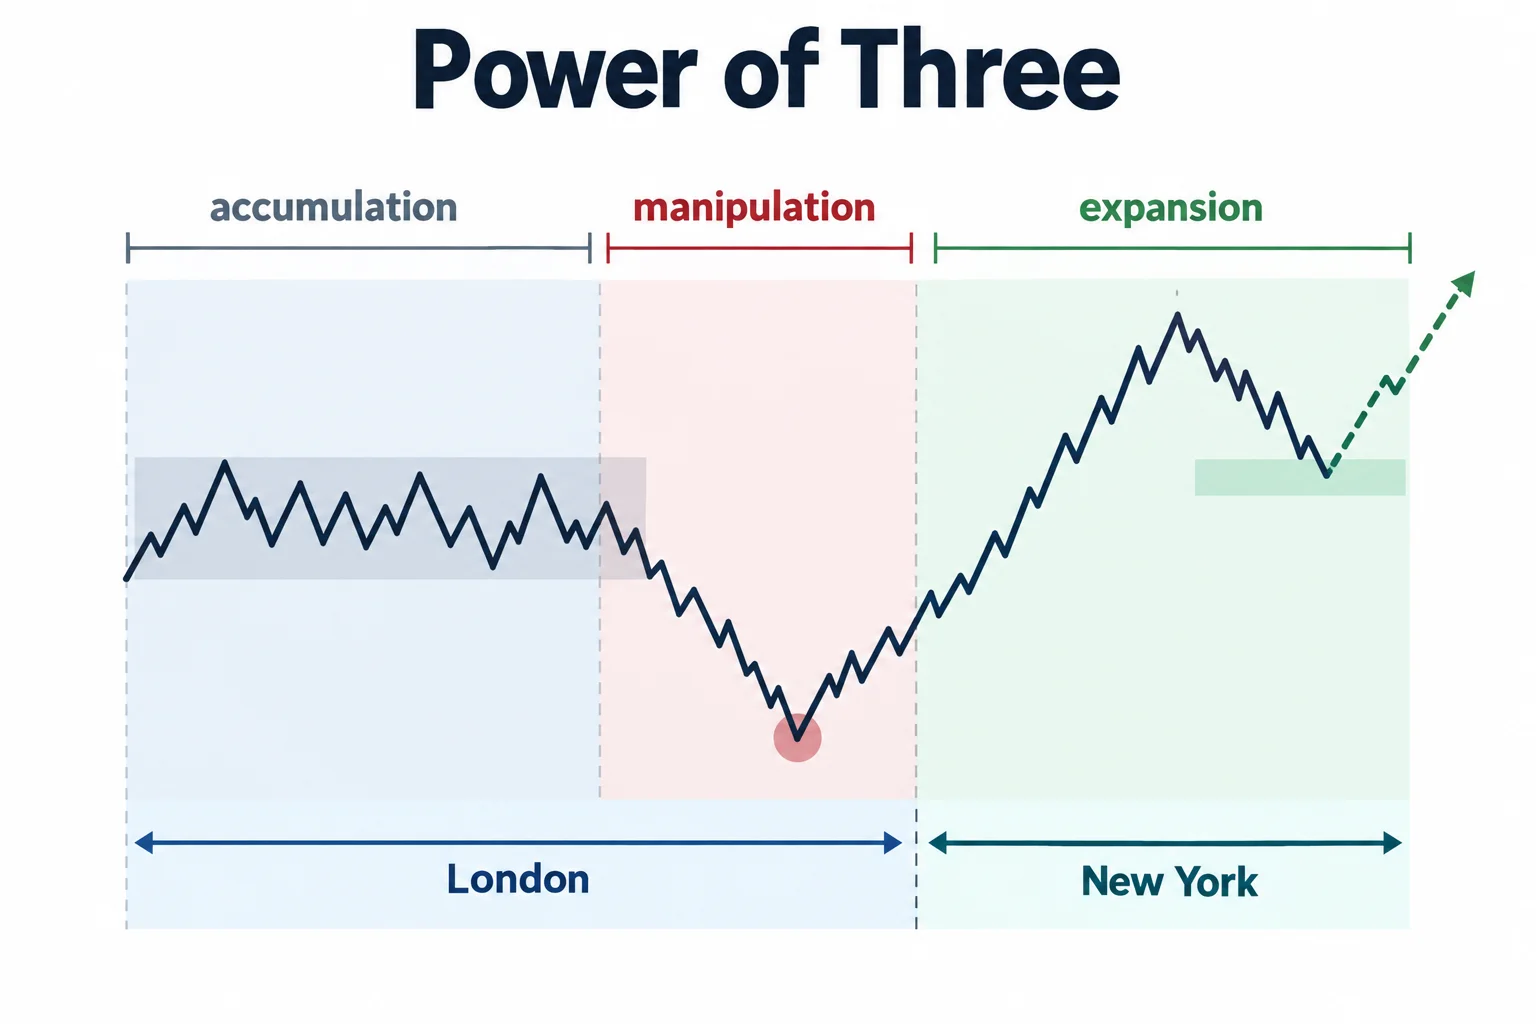
ICT begins by defining what he calls “Power of Three”: accumulation, manipulation, and expansion followed by distribution. In his model, positions first accumulate, price then moves against the anticipated direction, and a directional expansion follows. Watch the explanation at 0:39.
For a bullish day, ICT wants the London session to support an existing bullish daily bias. He describes this as an attempt to move lower that is rejected before price rallies. He then waits until after 7:00 a.m. New York time for a retracement from a London-session or intraday swing high.
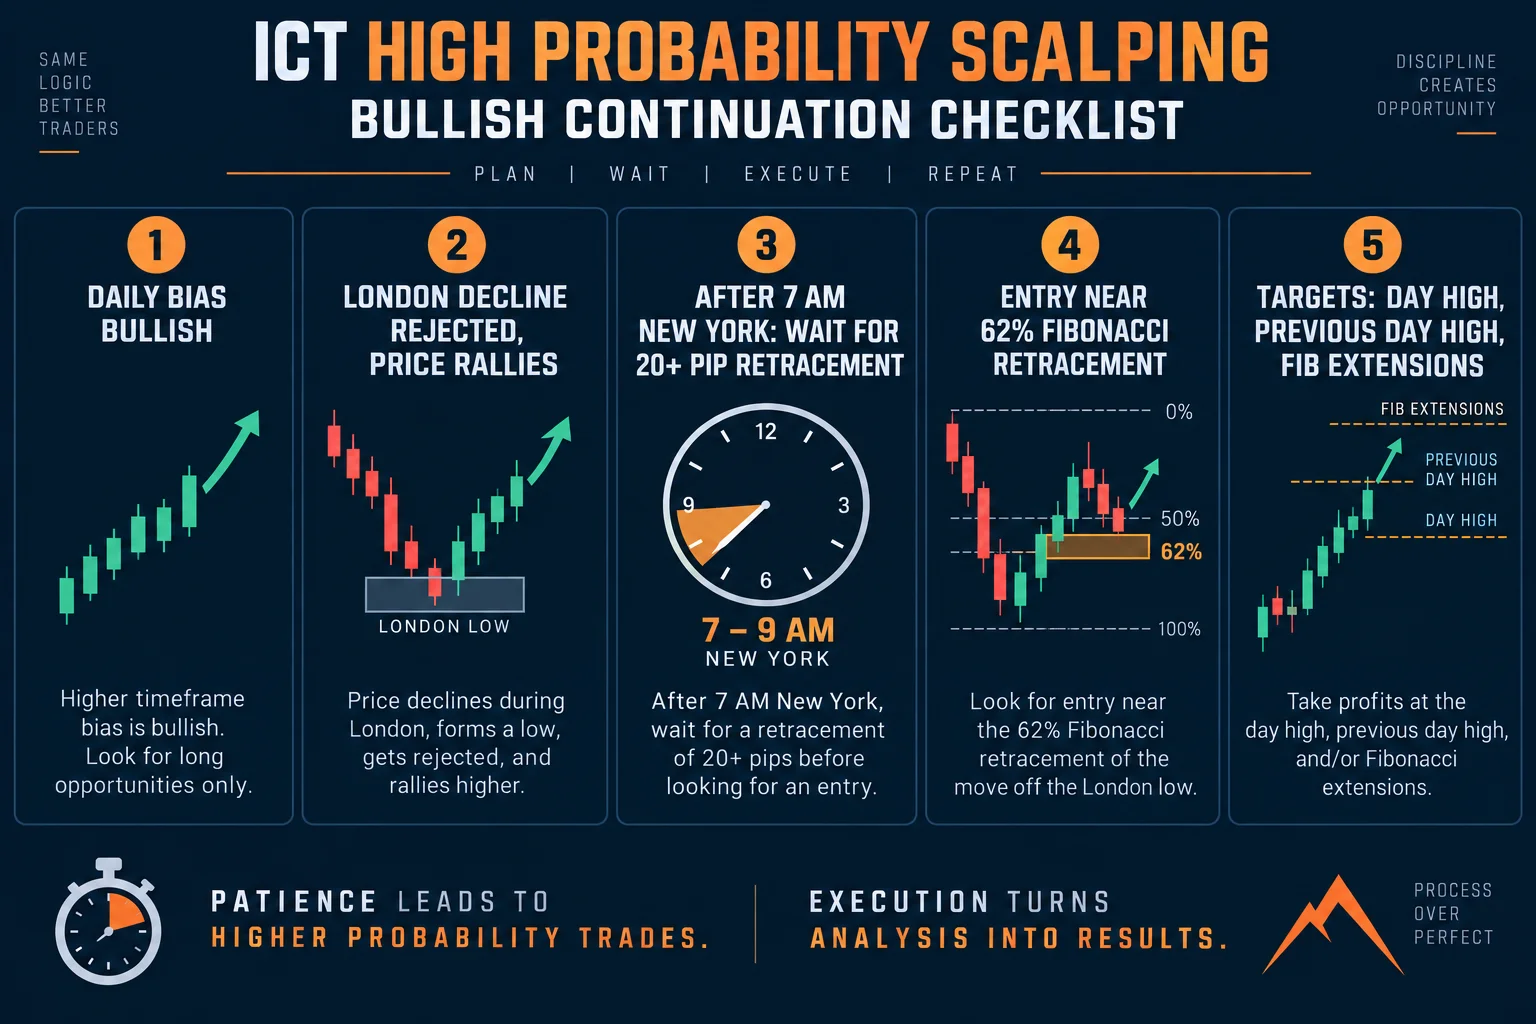
ICT Bullish Continuation Checklist
- Begin with what ICT identifies as a bullish daily bias.
- Look for London price action that attempts to decline, rejects the move, and rallies.
- Between 7:00 and 9:00 a.m. New York time, wait for a retracement lower.
- ICT prefers a retracement of roughly 20 pips or more; he says to pass if it has not appeared by 9:00 a.m.
- In his framework, the proposed entry is near the 62% Fibonacci retracement.
- Potential reference points include the current day’s high, the previous day’s high, and Fibonacci extension targets.
The bullish process begins at 1:12, while the accompanying chart example starts at 3:18. Because only the transcript is available here, the example’s plotted levels cannot be visually confirmed.
ICT Scalping With the Bearish Continuation Setup
ICT presents the short-side setup as the inverse. With a bearish daily bias, he wants price to rally above the midnight New York opening price during London, reject that advance, and then decline. He describes a London decline of around 25–30 pips as a minimum indication of bearish movement, while noting that more movement may be preferable.
After 7:00 a.m. New York time, the model waits for price to retrace upward from a London-session swing low. ICT again favors approximately 20 pips of retracement before considering a short near the 62% Fibonacci level. If that retracement does not occur by 9:00 a.m., his rule is to skip the setup. The bearish criteria begin at 4:53.
He mentions that experienced traders with unusually strong directional conviction might act on a smaller 10–15 pip retracement, but explicitly frames the 20-pip threshold as a way to avoid more false setups. This distinction matters: the narrower threshold is presented as aggressive discretion, not the standard version of the model.
When ICT Scalping Shifts From Continuation to Reversal
At 9:38, ICT turns to reversal risk. He advises examining the hourly chart for an obvious prior high or low that previously produced a strong reaction. If a proposed continuation trade would immediately encounter such a level, he suggests avoiding the trade or managing it very cautiously.
Importantly, ICT states that he cannot know whether an old high or low will hold. He acknowledges that support and resistance can fail, trades can be stopped out, and losses are unavoidable. This is one of the video’s clearest qualifications: the levels are treated as areas where a reaction may occur, not as certain turning points.
He discusses a GBP/USD example associated with November 10, 2017, in which an old hourly low informed a possible bullish reversal idea. The transcript reports his account of the trade, but it does not establish the chart’s exact sequence, execution quality, spread, or final result.
ICT Scalping Position Sizing and Risk Management
The money-management section starts at 13:41. ICT recommends practicing with strict controls in a demo account and discusses risking 1% of account equity per setup, with a possible progression toward 2% only if it fits the trader’s tolerance. He cautions against leverage intended to accelerate account growth.
His numerical illustration uses a hypothetical $1,000 account, a 1% risk allowance, and a 20-pip stop. That produces $10 of risk before trading costs, equivalent in his example to about $0.50 per pip or five micro lots. The arithmetic is educational; actual position sizing also depends on the instrument, account denomination, contract specifications, spread, commission, and execution.
ICT then outlines several possible management choices: taking a partial profit at an initial objective, moving the stop to break even at a later Fibonacci target, scaling out at subsequent targets, or closing at what he calls a symmetrical price swing. He does not offer one fixed exit formula.
ICT Scalping Risk From Discretionary Exits
From 18:01, ICT explains that his exits depend partly on experience and his reading of market behavior. He calls exits a weak point in his own process and says he has no rigid allocation governing every partial exit. This makes the framework less mechanical than its entry checklist may initially suggest.
The practical educational takeaway is to separate the model into testable components: directional bias, session behavior, time window, retracement size, entry reference, invalidation, and exit rules. ICT’s presentation supplies proposed criteria for the first several components, but leaves substantial discretion in bias selection and profit-taking. Anyone studying the lesson should record those decisions explicitly rather than treating hindsight chart examples as proof of repeatability.
The video closes by encouraging chart study focused on open, high, low, and close rather than adding numerous indicators. It also includes a compounding and account-growth claim near 21:35; that statement is an unsupported projection in the transcript and should not be interpreted as a realistic or assured performance expectation.
Further Resources
- ICT – Mastering High Probability Scalping Vol. 3 of 3 (source video) — the full 25-minute session this article summarizes, with timestamps linked throughout.
- ICT Forex – Market Maker Primer Course (YouTube playlist) — the broader ICT instructional series introducing the market-structure and liquidity vocabulary used in this lesson.
- Fibonacci retracements (BabyPips School of Pipsology) — a neutral explainer on drawing and using Fibonacci retracement levels, matching the 62% optimal-entry discussion in this review.
- Position sizing (BabyPips) — independent reference on calculating lot size from account risk and stop distance, complementing the article’s risk-management section.




