
Key takeaways
ICT Mastering High Probability Scalping Volume 2 teaches a selective top-down method that derives directional bias from daily swing structure, refines entries on a 15-minute chart during London or New York kill zones, and targets the previous day’s high in bullish conditions or low in bearish conditions.
Read the full summary
ICT Mastering High Probability Scalping Volume 2 teaches a selective top-down method that derives directional bias from daily swing structure, refines entries on a 15-minute chart during London or New York kill zones, and targets the previous day’s high in bullish conditions or low in bearish conditions. A bullish setup requires a broken daily swing high, a retracement, a higher three-candle swing low, and monitoring the next session for a move above the center candle’s high, preferably after opening below it. A bearish setup reverses the rules with a broken swing low, retracement, lower three-candle swing high, and a potential move below the center candle’s low. ICT discusses optimal trade entry retracements at 62%, 70.5%, and 79%, while noting the daily higher-low structure need not align precisely with the 62% to 79% range. In the GBP/USD example beginning at 12 minutes 8 seconds, the July 24, 2017 high near 1.3057 becomes the July 25 bullish objective, with the analysis moving to a 15-minute chart at 14 minutes 14 seconds. ICT says setups do not occur daily, prefers Tuesday or Wednesday trading, recommends reviewing multiple dollar-based currency pairs and practicing in a demo account, and advises waiting when the daily sequence is absent. The lesson is an educational checklist rather than a complete or validated system because it provides no independently tested probabilities, brokerage records, universal position-sizing or invalidation rules, or transaction-cost, spread, and slippage assumptions.
How we researched this article
BestProps used document-based research from primary firm sources, checked September 25, 2026. The complete source list, scope, limitations, and commercial-state record appear near the end of this article.
In ICT – Mastering High Probability Scalping Vol. 2 of 3, ICT presents a process for forming a daily directional bias and then using the previous day’s high or low as an intraday objective. The lesson moves from daily-chart swing structure to a historical GBP/USD example on a 15-minute chart.
Watch the source video: ICT – Mastering High Probability Scalping Vol. 2 of 3 (uploaded July 24, 2017)
Playback on other websites has been disabled by the video owner. Click the link to watch on YouTube.
The central idea is selectivity: first identify a directional condition on the daily chart, then wait for a qualifying retracement, and only afterward study a lower-time-frame setup. These are ICT’s market interpretations, not proof that the method predicts price or produces reliable profits.
Building an ICT Bullish Daily Bias
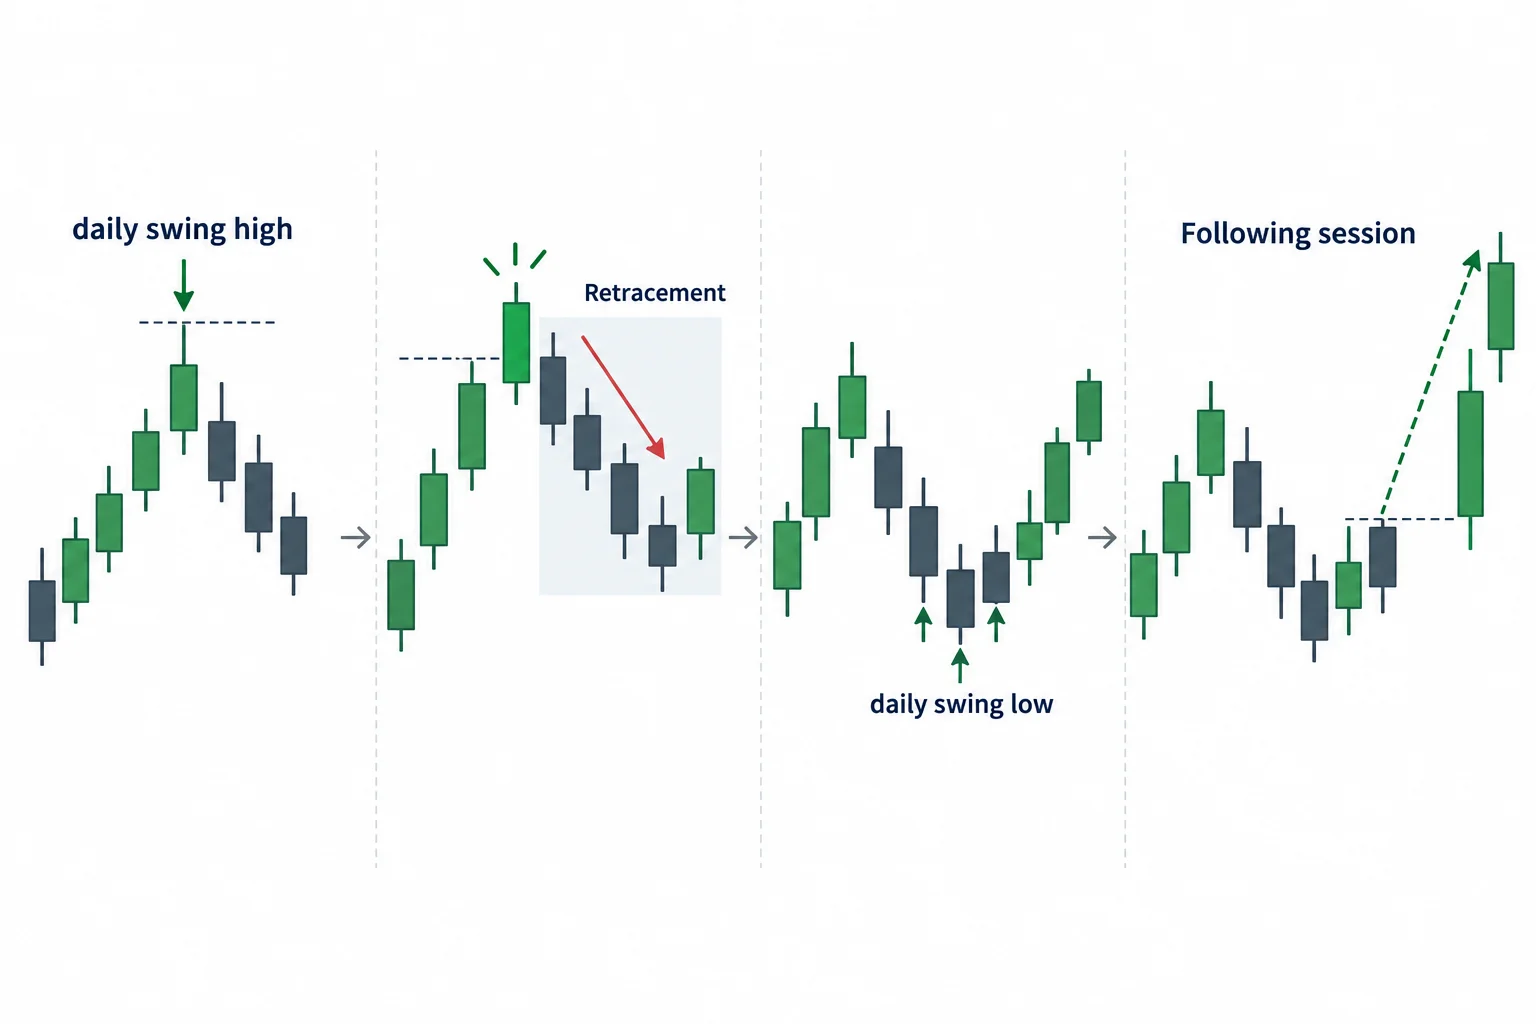
ICT begins the bullish framework at 35. He defines a daily swing high as a candle whose high is above the highs of the candles immediately to its left and right. When price later trades above that swing high, he treats the break as an alert to look for a future buying opportunity, not as an instruction to buy immediately.
After the break, he waits for a daily swing low. In his terminology, this is a candle with higher lows immediately on either side. The new swing low should remain above a recent prior swing low. This produces the sequence:
- A daily swing high is broken.
- Price retraces rather than continuing straight upward.
- A higher daily swing low forms without violating the recent low.
- The following session is monitored for a move through the swing-low candle’s high.
At 3:26, ICT says he prefers the next daily candle to open below the high of the center candle that defines the swing low. He then anticipates a run through that high. If the bullish condition persists, previous-day highs become potential objectives until a new daily swing high forms or price reaches an important support or resistance area within his framework.
ICT compares this higher-low structure with what he calls an “optimal trade entry,” but says it does not have to align precisely with the 62%–79% retracement range. The automated transcript renders one phrase around this discussion unclearly, so the exact retracement terminology should be checked against the recording.
Building an ICT Bearish Daily Bias
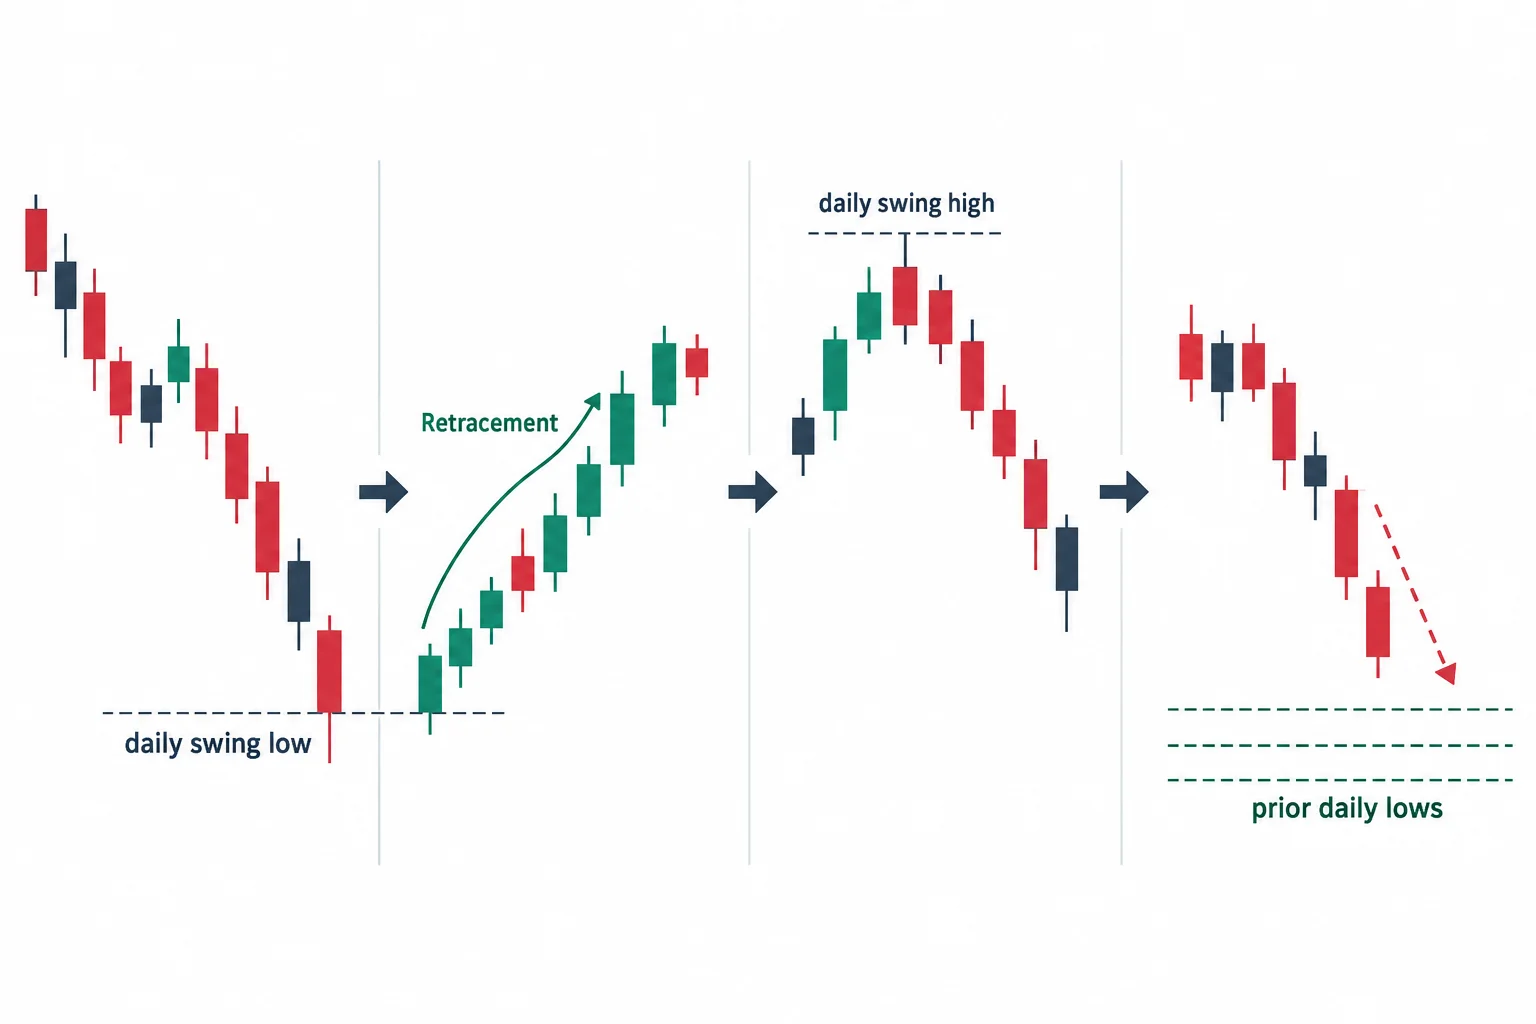
The bearish model begins at 5:01 and reverses the logic. ICT first waits for price to trade below a daily swing low. He interprets that break as a reason to watch for a selling scenario rather than entering immediately.
Price must then retrace and form a daily swing high that does not exceed the relevant recent swing high. Once the three-candle swing high is complete, ICT watches the next trading day for an attempt to trade below the center candle’s low. Previous-day lows then remain prospective targets until another daily swing low forms or price reaches an older or otherwise significant low.
In compact form, his bearish sequence is:
- Break a daily swing low.
- Wait for a retracement.
- Require a lower swing high.
- Monitor the next session for a move below the swing-high candle’s low.
- Use prior daily lows as objectives while the stated bias remains intact.
Using ICT Daily Bias for Selective Scalping
At 7:40, ICT explicitly says the model will not produce a setup every trading day. He encourages students to inspect multiple dollar-based currency pairs and practice examples in a demo account rather than force a pattern where the daily criteria are absent.
He also discusses personal weekly pip objectives, percentage risk, compounding, and a preference for Tuesday or Wednesday trading. These are his own targets and expectations, not verified results. The transcript provides no brokerage records, order confirmations, spread or slippage data, and no basis for treating the numerical projections as typical or assured.
The more transferable educational point is narrower: a trader studying this framework would separate market selection from entry timing. A daily structure supplies the proposed direction, while a session window and retracement supply the more specific area for observation. If the daily sequence is missing, ICT’s stated approach is to wait.
ICT Daily Bias in the GBP/USD Example
ICT turns to a chart example at 12:08. He identifies a prior daily swing high that was broken and then looks for a qualifying swing low. In his narration, an initial candidate does not have its high exceeded on the next day. A later candidate does, which he uses to establish a bullish scalp scenario targeting the previous day’s high.
He identifies the July 24, 2017 high as approximately 1.3057 and studies July 25 for the setup. At 14:14, he moves to a 15-minute chart, marks that prior high as the proposed liquidity objective, and focuses on London and New York session behavior.
Using a session price range, ICT describes a retracement into his 62%, 70.5%, and 79% “optimal trade entry” levels. He says the chart then shows a move toward the previous day’s high and discusses the available price range in pips. Because the source is an audio-derived transcript, the chart geometry, plotted levels, hypothetical fill, and exact range cannot be independently verified from the text alone.
ICT Daily Liquidity Runs Explained
Within this video, “liquidity run” refers to ICT’s expectation that price may trade through a conspicuous prior high or low. For the bullish case, the previous day’s high is the objective; for the bearish case, it is the previous day’s low. The lesson therefore combines three layers:
- Direction: a daily swing break followed by a qualifying retracement.
- Timing and price: a lower-time-frame retracement during a session window ICT calls a “kill zone.”
- Objective: the previous day’s high or low, depending on the bias.
As general educational interpretation, this is a top-down checklist rather than a complete trading system. The video does not establish position sizing rules for every circumstance, invalidation placement, transaction-cost assumptions, or independently tested probabilities. Those omissions matter when evaluating the practical meaning of any historical chart example.
Watch the full primary source: ICT – Mastering High Probability Scalping Vol. 2 of 3.



