
Key takeaways
ICT Mastering High Probability Scalping Volume 1 of 3 presents an educational Forex price-action framework targeting 10 to 30 pip swings by combining daily directional bias, a three-day liquidity window, hourly retracements, and selected sessions.
Read the full summary
ICT Mastering High Probability Scalping Volume 1 of 3 presents an educational Forex price-action framework targeting 10 to 30 pip swings by combining daily directional bias, a three-day liquidity window, hourly retracements, and selected sessions. The daily chart establishes direction while the hourly chart maps prior highs as buy-side liquidity and prior lows as sell-side liquidity using today and the preceding two trading days. Bullish bias requires price to trade above a prior three-candle swing high, form a swing low with a lower middle low and higher lows on both sides, then trade above the third candle’s high. Bearish bias requires a break below a prior swing low, formation of a swing high with a higher middle high and lower highs on both sides, then a move below the third candle’s low. Preferred New York time windows are approximately 2 a.m. to 4 a.m. for London and 7 a.m. to 10 a.m. for New York. Hourly setups use a 62 percent to 79 percent Fibonacci retracement zone with 70.5 percent preferred, then target a recent daily high in bullish conditions or daily low in bearish conditions. ICT recommends avoiding forced daily trades, studying one market first, and practicing in a demo account. The framework does not establish profitability, transaction costs, stop execution, fills, or verified results and is not investment advice.
How we researched this article
BestProps used document-based research from primary firm sources, checked September 25, 2026. The complete source list, scope, limitations, and commercial-state record appear near the end of this article.
In ICT – Mastering High Probability Scalping Vol. 1 of 3, ICT presents a price-action framework for short-term Forex setups. He defines a scalp for this lesson as a targeted 10–30 pip price swing, although the broader teaching is less about a fixed pip objective and more about combining daily directional bias, prior highs or lows, retracements, and selected trading sessions.
The central idea is straightforward: first use daily price structure to form a directional view, then use an hourly chart to identify prior daily highs or lows that may act as liquidity objectives. These are ICT’s interpretations of market behavior, not independently established rules or guaranteed trading outcomes.
ICT High Probability Scalping Explained
At 1:11, ICT explains his working definition of high-probability scalping. He emphasizes trading within daily and weekly ranges rather than attempting to capture an exact top or bottom.
The specific lesson begins around 3:29. ICT says the three-part series will address directional bias, preferred times of day, and setups aimed at what he calls runs on liquidity. Volume 1 concentrates primarily on the first of those elements and introduces the timing and retracement concepts later in the presentation.
ICT Scalping Three-Day Liquidity Window
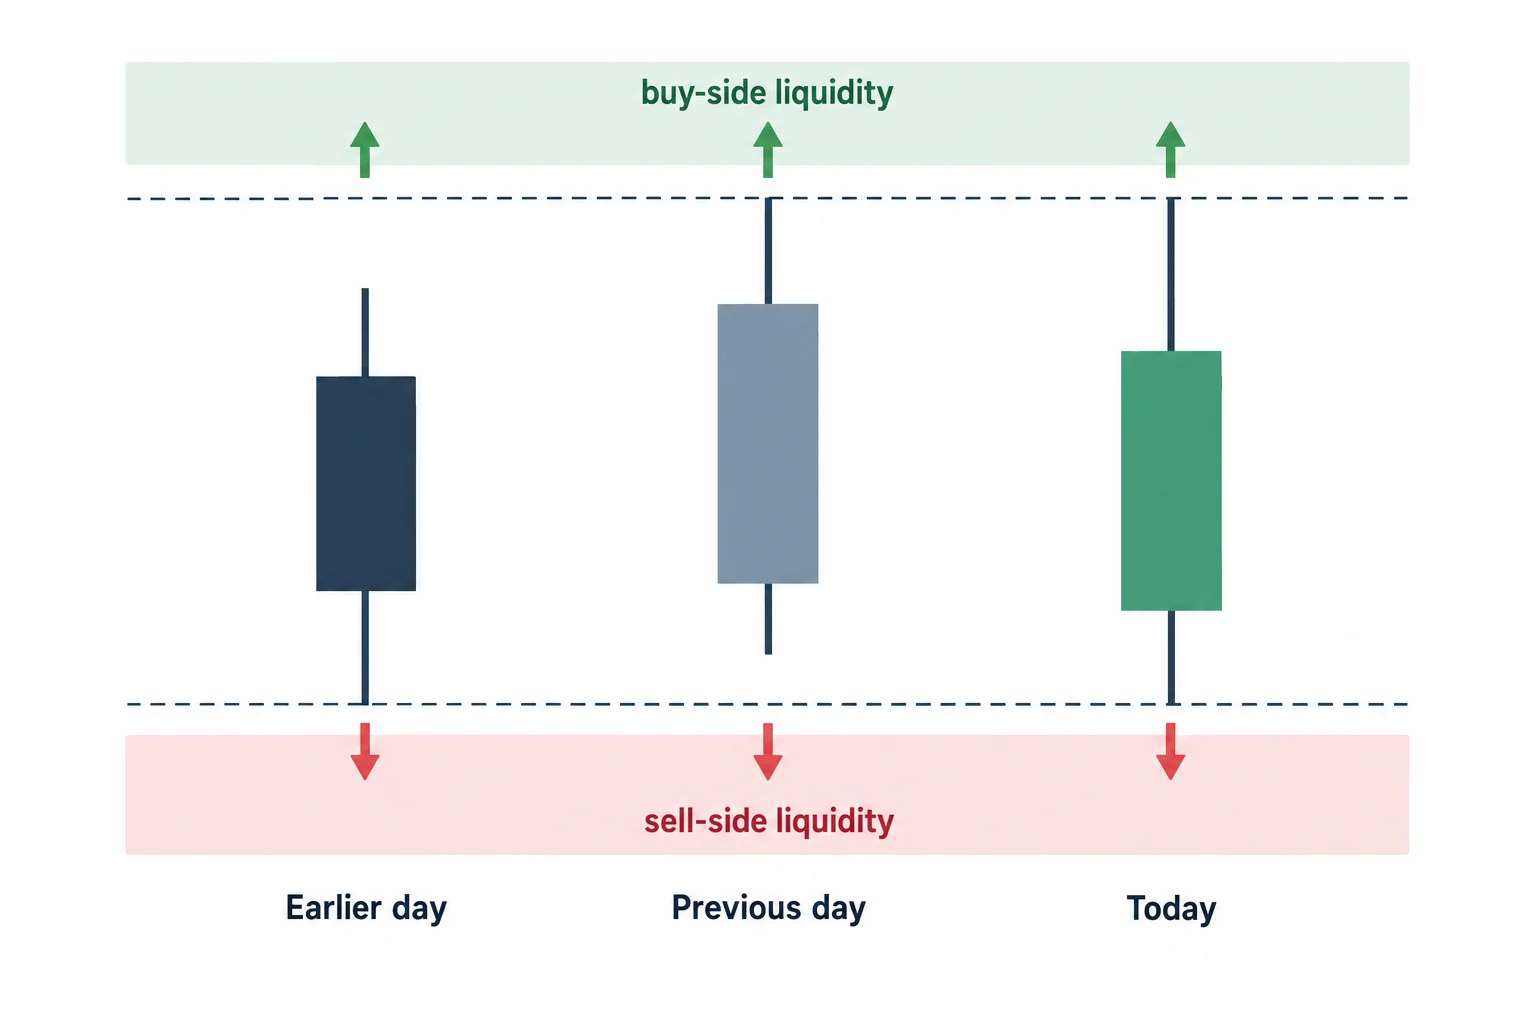
ICT’s basic liquidity map uses today plus the preceding two trading days. At 5:29, he describes monitoring the highest high and lowest low within that short window. In a bullish scenario, the working objective is a prior daily high; in a bearish scenario, it is a prior daily low.
- Bullish context: Look above current price for the previous day’s high or another recent high.
- Bearish context: Look below current price for the previous day’s low or another recent low.
- Chart roles: Use the daily chart for directional context and the hourly chart to organize nearby highs and lows.
ICT calls old highs “buy-side liquidity” because protective buy-stop orders may sit above highs, particularly for traders holding short positions. Conversely, old lows can be viewed as sell-side liquidity. His stronger claims about banks and algorithmic price delivery are presented in the video as his market model; the transcript alone cannot verify them.
How ICT Builds Daily Bias
The daily structure lesson starts at approximately 17:31. ICT defines both swing lows and swing highs with three daily candles:
- A swing low has a lower low in the middle, with higher lows on both sides.
- A swing high has a higher high in the middle, with lower highs on both sides.
Bullish Daily Bias Sequence
ICT does not treat every swing low as a bullish signal. In his sequence, price must first trade above a prior swing high. He then waits for a three-candle swing low to form. Once price subsequently trades above the third candle’s high, he considers bullish momentum active and begins watching for runs above recent daily highs. He recaps this process at 22:10.
Bearish Daily Bias Sequence
The bearish process, explained from 26:28, reverses the logic. Price first breaks below a daily swing low. ICT then waits for a three-candle swing high and watches for price to trade below the third candle’s low. Recent daily lows become the proposed objectives.
According to ICT, the directional state remains in place until opposing daily structure is broken. He suggests that daily momentum can persist for several days, but this is his interpretation rather than a promise that any specific market will continue in the same direction.
ICT Scalping Timing in London and New York
After establishing daily bias, ICT moves to an hourly USD/CAD example at 31:06. He identifies two preferred windows, expressed in New York time:
- London window: approximately 2:00 a.m. to 4:00 a.m.
- New York window: approximately 7:00 a.m. to 10:00 a.m.
ICT says viewers should convert these windows from New York time into their local time. Any practical conversion should account for the relevant date and daylight-saving changes.
He describes setups occurring inside these windows as more favorable within his framework. A similar pattern outside them is treated as less favorable, not automatically invalid. Because the source supplied here is an audio transcript without visual chart verification, the exact placement of the shaded sessions and candles cannot be independently checked.
ICT Scalping Retracements and Liquidity Targets
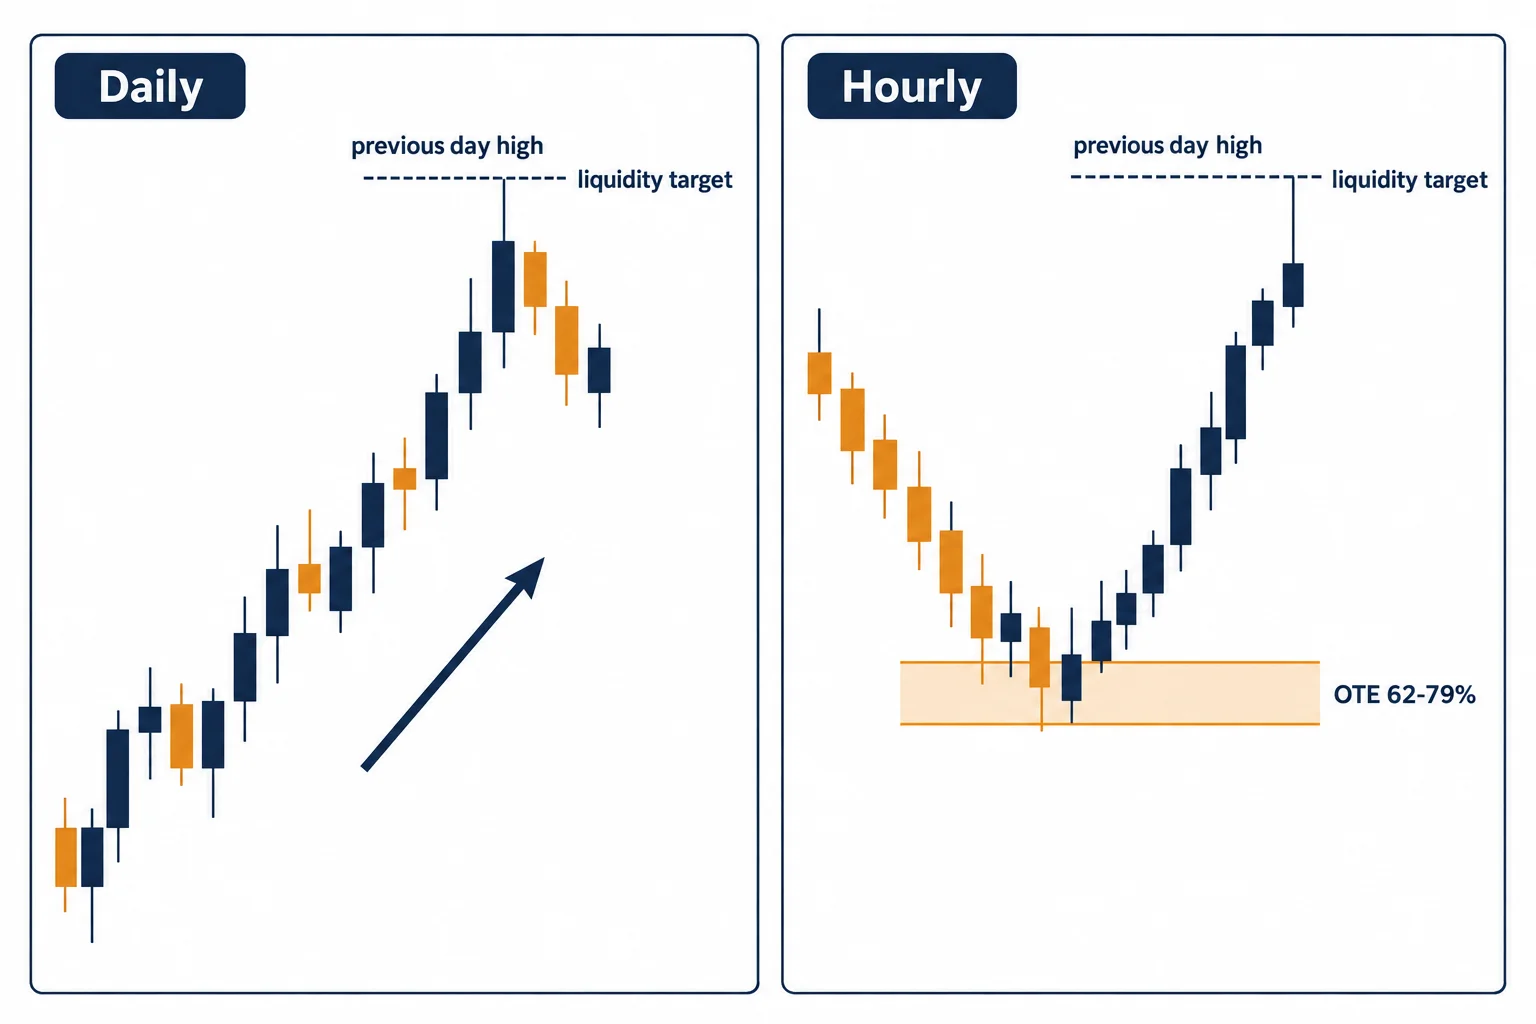
Beginning around 34:00, ICT adds a Fibonacci retracement to the hourly setup. He draws it using candle bodies associated with a recent session move and discusses a retracement area between 62% and 79%, including a preferred 70.5% level. The automated transcript occasionally renders “retracement” unclearly, but the repeated percentages and surrounding explanation support this reading.
In a bullish example, the conceptual checklist is:
- Establish bullish daily structure.
- Mark the previous day’s high and, where relevant, the high from two days earlier.
- Wait for an hourly retracement into ICT’s preferred Fibonacci area.
- Give greater weight to a setup appearing during one of the stated session windows.
- Use the old high as the proposed liquidity objective rather than assuming an unlimited move.
The bearish version reverses those steps and focuses on old lows.
ICT High Probability Scalping Limits
One of the more practical themes is selectivity. At 10:58, ICT warns against forcing a trade every day. He recommends concentrating on one market while learning and practicing the setup in a demo account before expanding to a small group of instruments.
For general chart study, the lesson can be reduced to three questions: What did daily structure break? Which recent daily high or low is the next reference point? Did a retracement occur during the specified time window? That is a useful summary of the presentation, but it is not evidence that the method is profitable. The transcript does not establish entries, fills, transaction costs, stop execution, or subsequent results. This material is educational and is not investment advice.




