
Key takeaways
ICT W.E.N.T.
Read the full summary
ICT W.E.N.T. Series Part 2 of 5 on The Inner Circle Trader YouTube channel teaches position sizing, stop distance, reward-to-risk planning, and a demo execution drill built around prior daily and weekly highs and lows. ICT models a hypothetical $5,000 account compounding at 6% monthly, compares 6%, 10%, 20%, and 30% monthly targets, and discusses an eventual $3,500 monthly withdrawal goal, but these are optimistic illustrations, not verified results. With account risk fixed at 2%, he compares 30, 20, and 15-pip stops, explaining that tighter stops permit greater dollar exposure per pip while warning beginners to establish consistency with wider stops first. A 20-pip stop maps to targets of 20, 40, 60, and 80 pips at one-to-one through four-to-one reward to risk, while a 15-pip stop needs 60 pips for four-to-one. In the GBP/USD example, a prior daily high near 1.7063 is rounded to 1.7060, with a hypothetical limit entry near 1.7065 after five pips for spread and slippage and a 15-pip stop near 1.7050. The demo drill marks recent daily and weekly swing lows for buys and highs for sells, uses a 20-pip stop and 20-pip objective, waits for revisits, allows only selective participation, and requires stepping aside after one filled trade. ICT frames winners, losses, ambiguous broker-dependent stop-outs, and approximately flat weeks as practice in following rules rather than proof of profitability. The video was uploaded in 2017, the chart discussion is identified as July 15, 2014, and any independent test should log every qualifying setup while including spreads, slippage, gaps, and sizing constraints.
How we researched this article
BestProps used document-based research from primary firm sources, checked September 25, 2026. The complete source list, scope, limitations, and commercial-state record appear near the end of this article.
In ICT W.E.N.T. Series – Part 2 of 5, ICT connects position sizing, stop distance and reward-to-risk ratios with a chart-marking exercise based on prior daily and weekly highs and lows. The lesson moves from hypothetical compounding tables to a GBP/USD walkthrough and then to a demo-account drill intended to develop rule-following.
The video was uploaded in 2017, although ICT identifies the chart discussion as taking place on July 15, 2014. Its return figures are hypothetical illustrations, not documented account results or evidence that the same performance can be achieved consistently.
ICT Part 2 Risk Compounding Over Time
ICT begins by revisiting a hypothetical $5,000 account earning 6% each month. He uses this model to argue that steady compounding can matter more than pursuing a large number of pips immediately. At 2:26, he adds a case study in which a trader eventually wants to generate $3,500 per month. His broader point is that a small starting balance may require considerable time before it could support withdrawals of that size.
ICT repeatedly encourages patience rather than treating trading as a race. He then compares hypothetical monthly targets of 6%, 10%, 20% and 30%. These projections assume repeated monthly gains, reinvestment and, in places, no taxes or withdrawals. Those assumptions make the displayed growth paths especially optimistic and unsuitable as forecasts.
ICT Part 2 Risk and Stop Distance
The central mathematical lesson starts around 7:12. ICT holds the stated account risk at 2% while comparing stop distances of 30, 20 and 15 pips. In his model, a tighter stop permits a larger dollar value per pip while keeping the maximum planned loss unchanged. Consequently, fewer favorable pips would be needed to reach the same gross dollar target.
That arithmetic does not mean a tighter stop makes a strategy more profitable. A smaller stop can also be reached more easily, and the transcript supplies no tested win rate, transaction-cost study or complete performance record. ICT himself presents tighter stops as something a learner should work toward rather than adopt immediately. At 9:59, he says beginners should first demonstrate consistency with the wider-stop model.
A useful general interpretation is to separate three quantities:
- Account risk: the amount lost if the planned stop is executed as assumed.
- Stop distance: the price distance between entry and invalidation.
- Position size: the exposure selected so that the stop distance corresponds to the chosen account risk.
Real execution can differ because of spreads, slippage, gaps and sizing constraints. The video mentions allowing for spread in its GBP/USD example, but it does not provide a general transaction-cost analysis.
ICT Part 2 Reward to Risk Scenarios
Beginning at 18:08, ICT explains reward-to-risk with a 20-pip stop. A 1:1 setup targets 20 pips, 2:1 targets 40, 3:1 targets 60 and 4:1 targets 80. He later repeats the exercise with a 15-pip stop, where a 4:1 target would be 60 pips.
ICT’s teaching emphasis is that a trader need not seek activity every day. He contrasts scalping and day trading with swing or position trading, suggesting that the appropriate holding period depends partly on schedule and access to charts. This is a planning framework, not proof that setups with favorable ratios will occur on demand or reach their targets.
ICT Part 2 GBP/USD Risk and Reward Example
At 24:32, ICT turns to GBP/USD. He identifies a prior daily high near 1.7063 and rounds it to an area around 1.7060. Under his interpretation of support and resistance, a broken resistance level could become support when revisited.
He describes a hypothetical limit entry near 1.7065 after adding five pips for spread and slippage, paired with a 15-pip stop near 1.7050. He then measures successive 15-pip units to illustrate outcomes from 1:1 through larger reward-to-risk multiples. These are retrospective chart annotations described in the transcript. The transcript alone cannot verify the visible candles, whether an order was actually placed or filled, or what a particular broker’s historical prices would have shown.
ICT Part 2 Daily and Weekly Execution Drill
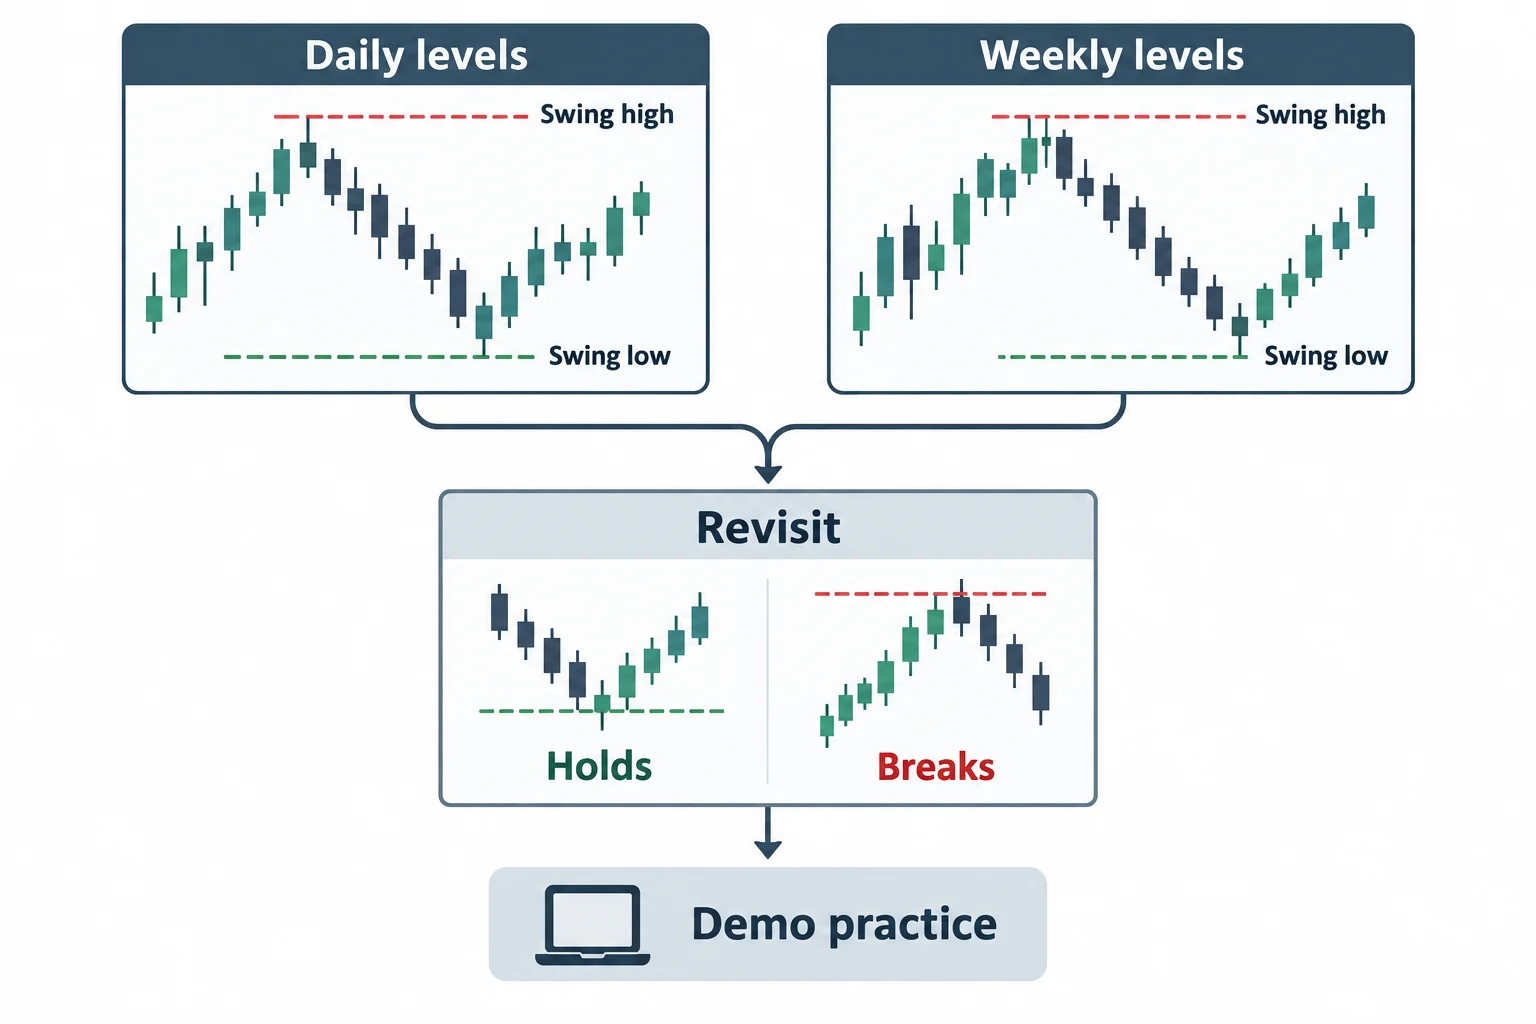
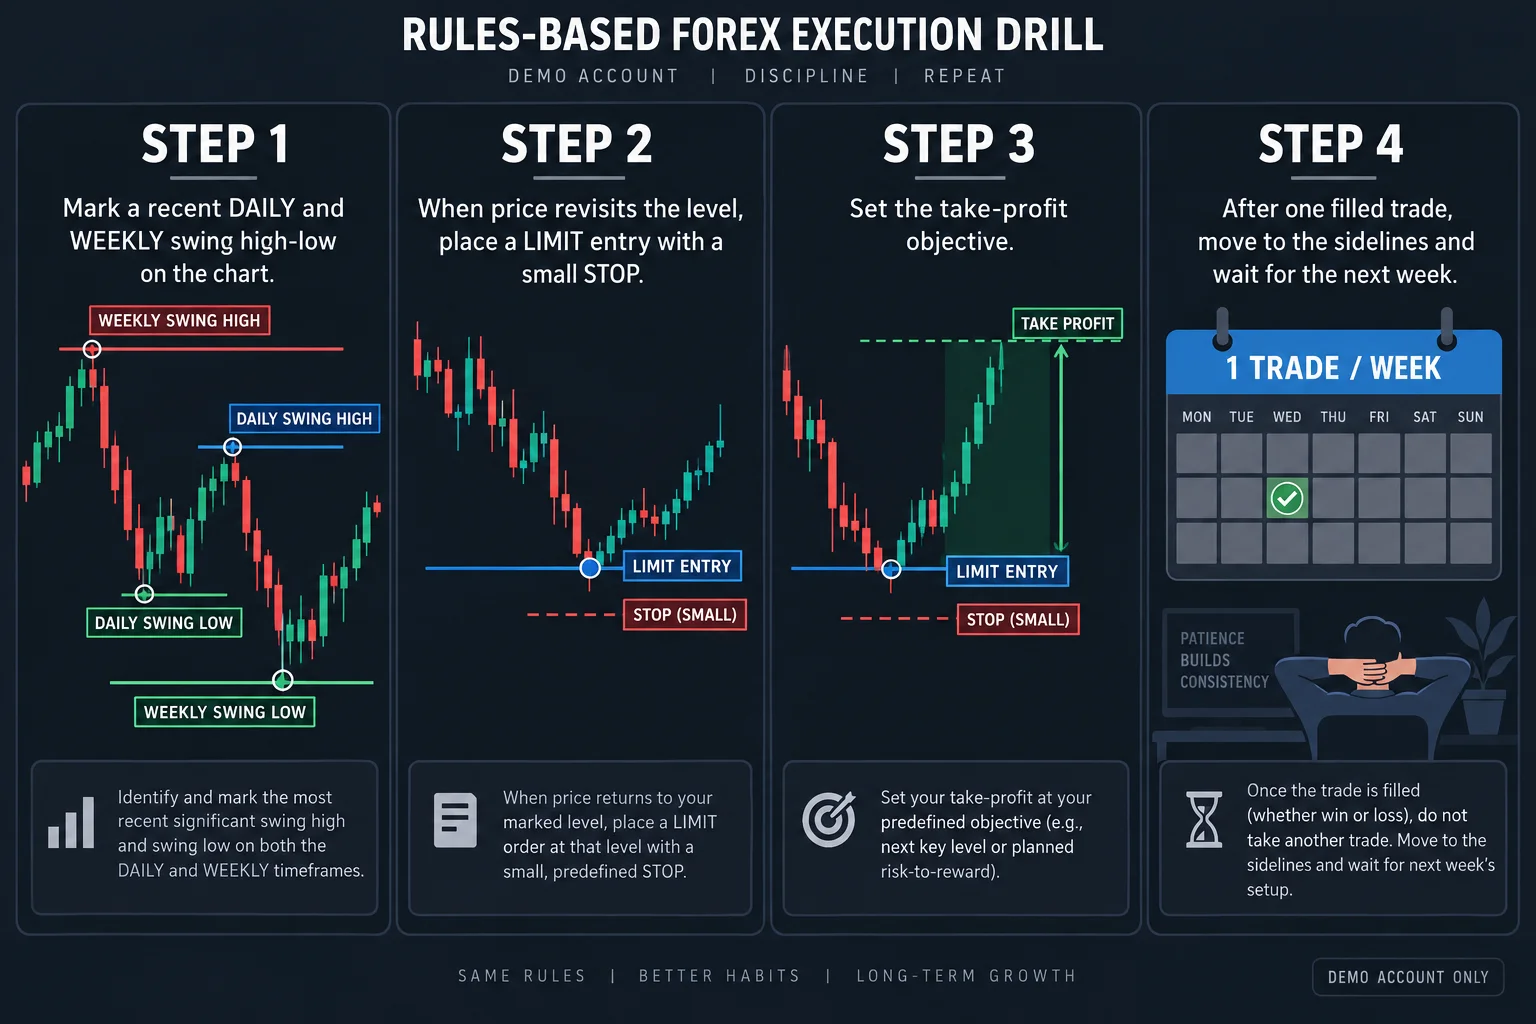
The practical exercise begins around 34:06. ICT instructs learners to mark recent daily and weekly swing highs and lows, then observe reactions when price revisits those levels. His basic drill uses:
- Buying at marked daily or weekly lows;
- Selling at marked daily or weekly highs;
- A hypothetical 20-pip stop and 20-pip objective;
- A demo account rather than live execution;
- Selective participation instead of forcing a trade every day.
ICT walks through examples that he characterizes as winners, losses and borderline cases where broker data could have produced a stop-out. At 38:28, he clarifies that the exercise is not primarily about finding profits. Its purpose is to expose the learner to following a defined plan, including occasions when the level fails.
Later examples include weeks in which an apparent loss is followed by an offsetting gain, leaving the exercise approximately flat. That discussion reinforces the session’s most grounded lesson: consistency means applying predefined rules through both favorable and unfavorable outcomes, not assuming every marked level will hold.
ICT Part 2 Risk and Execution Takeaways
Part 2 combines aggressive hypothetical return targets with a more restrained practice routine. The durable educational idea is not the projected compounding rate; it is the relationship among stop distance, position size, account risk and target distance. ICT’s proposed drill gives learners a repeatable way to annotate charts and review decisions, while explicitly acknowledging losing and ambiguous examples.
Any independent review should record every qualifying setup, include spreads and slippage, and avoid treating selected historical reactions as a complete test. The video presents ICT’s market interpretation and training method, not verified profitability or individualized investment advice.
Watch the ICT Part 2 Risk and Execution Lesson
The full lesson is available on YouTube at ICT W.E.N.T. Series – Part 2 of 5. The uploader has disabled embed on this video, so it cannot be played inline here. The watch card below opens the player in a new tab.
Explore More ICT Risk and Execution Lessons
- The Inner Circle Trader Official ICT resource library and mentorship overview.
- The Inner Circle Trader – YouTube channel The primary source of ICT's mentorship lectures.
- ICT Index Wiki A community-maintained index of ICT study paths and playlists (unofficial).



