
Key takeaways
ICT Forex Scout Sniper Basic Field Guide Volume 3 is a 2 hour 28 minute 57 second educational video uploaded December 25, 2017 that teaches traders to mark daily and four-hour reaction levels before seeking setups on 15-minute or five-minute charts.
Read the full summary
ICT Forex Scout Sniper Basic Field Guide Volume 3 is a 2 hour 28 minute 57 second educational video uploaded December 25, 2017 that teaches traders to mark daily and four-hour reaction levels before seeking setups on 15-minute or five-minute charts. ICT prioritizes annual, quarterly, monthly, weekly, intraweek and daily highs and lows plus three-candle swing open, high, low and close prices, rejects diagonal trend lines and treats levels as observation areas rather than guaranteed reversals. At 17 minutes 54 seconds he states that intraday patterns should form at or near higher-timeframe levels. From 57 minutes 54 seconds he uses the U.S. 10-year Treasury yield as a directional macro filter, arguing that rising yields often accompany weaker equities and risk assets and a stronger dollar, not as a precise timing signal. From about 2 hours 5 minutes 27 seconds he covers London and New York kill zones, liquidity sweeps, contraction-to-expansion structure and the power of three phases of accumulation, manipulation and distribution. Suggested practice includes recording key prices separately, comparing session reactions with prior levels, monitoring 10-year yields without relying on one factor and testing market-structure changes on historical data or a demo account. The article notes that dealer behavior is ICT's interpretation, the transcript provides no order-book proof, verified trading edge, confirmed fills or assurance of profitable recurrence.
How we researched this article
BestProps used document-based research from primary firm sources, checked September 25, 2026. The complete source list, scope, limitations, and commercial-state record appear near the end of this article.
ICT Forex Scout Sniper Basic Field Guide – Vol. 3 is a long-form lesson connecting higher-timeframe support and resistance, interest-rate analysis, multi-timeframe charting, session timing and ICT’s interpretation of market-maker behavior. The primary source is ICT’s original video, uploaded December 25, 2017.
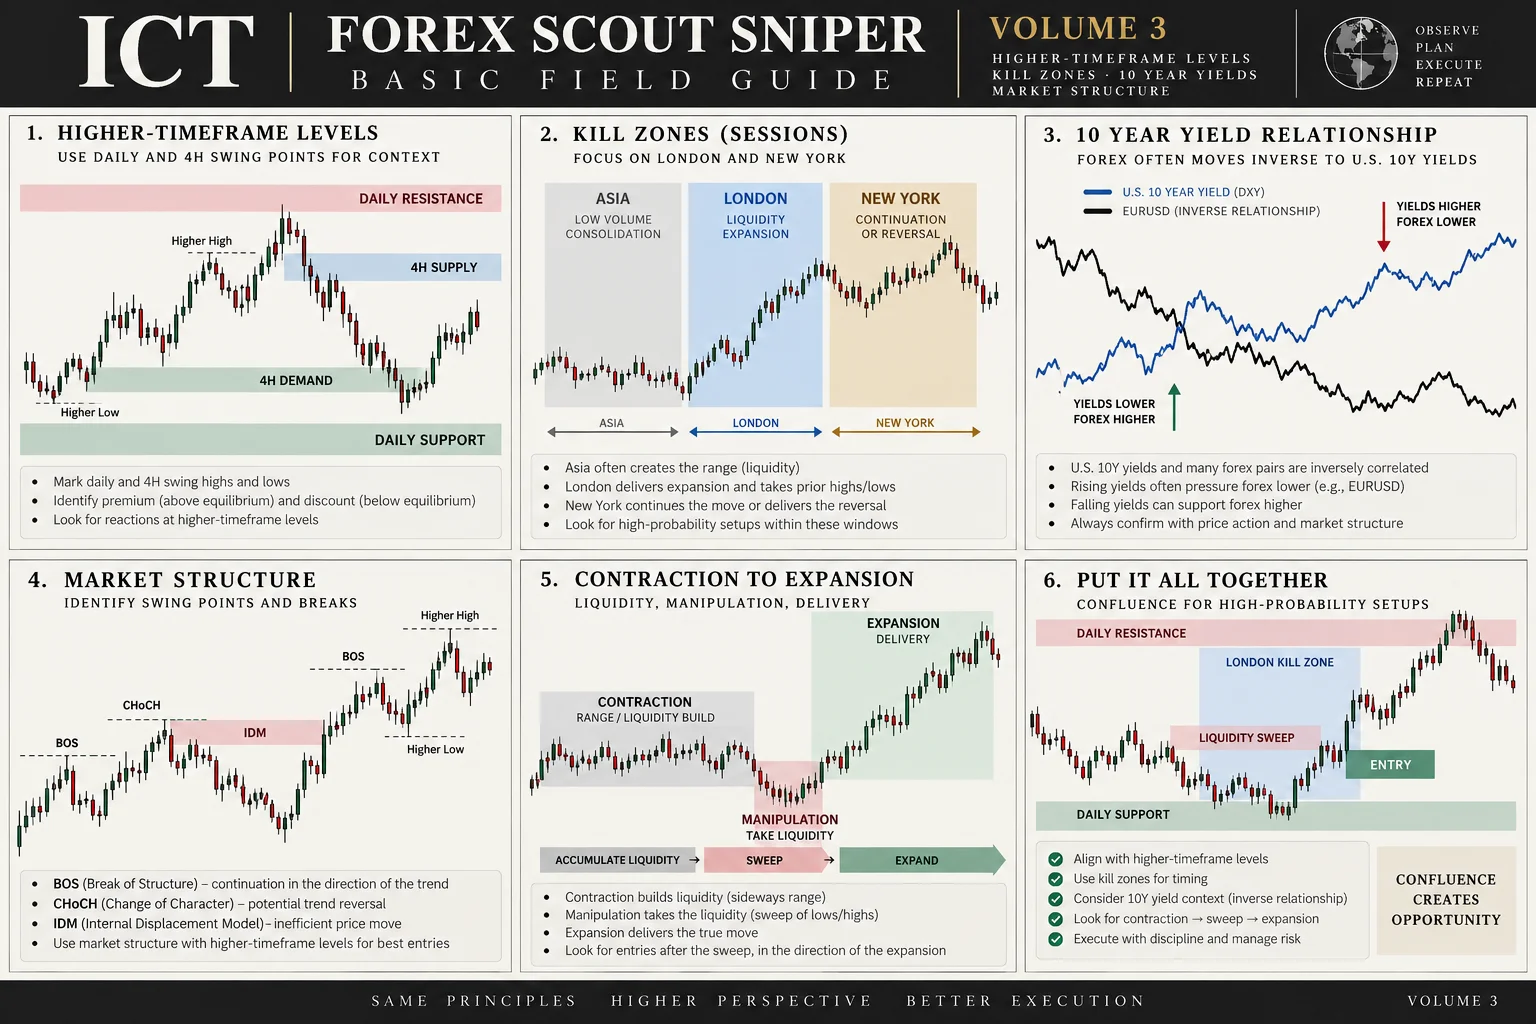
ICT Forex Higher Timeframe Reaction Levels
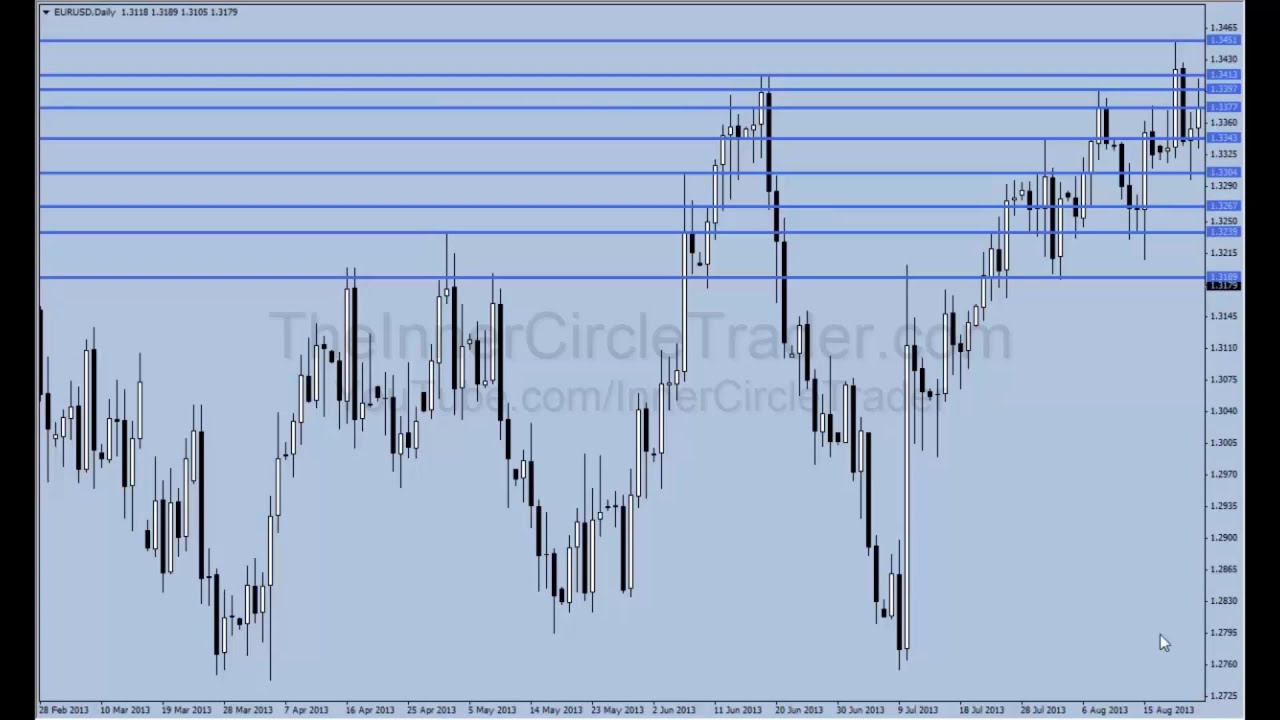
At 2:18, ICT begins with a EUR/USD daily chart. His central instruction is to identify reaction levels on daily and four-hour charts before searching for an intraday setup. He marks horizontal levels around visible swing highs and lows and explicitly rejects diagonal trend lines as part of his own method.
He expands the exercise at 8:01 by listing annual, quarterly, monthly, weekly, intraweek and daily highs and lows as potentially significant reference points. The captions appear to render “intraweek” imperfectly, but the surrounding explanation clearly concerns the developing high and low within a week.
For three-candle swing formations, ICT recommends recording the open, high, low and close of the relevant candles. The practical purpose is to retain the levels without covering the chart with horizontal lines. He treats these prices as areas to observe, not as guarantees that price must reverse.
Frame ICT Patterns With Higher Timeframe Context
The most direct rule arrives at 17:54: in ICT’s framework, an intraday pattern should not be considered in isolation. It should form at, or near, a reaction level identified from the daily or four-hour chart.
He argues that this top-down process discourages chasing a move simply because a recognizable formation appears on a five-minute chart. His historical walkthrough then moves from daily to four-hour, 15-minute and five-minute views. Although ICT says an earlier bearish EUR/USD expectation was followed by a decline, the transcript alone cannot establish entries, fills or the result available to a viewer.
ICT Forex Interest Rates and Higher Timeframe Bias
At 57:54, the lesson turns to the U.S. 10-year Treasury note. ICT explains the inverse relationship between yields and price action: when yields rise, equities and risk assets tend to decline, and the dollar often strengthens. He uses this as a macro filter for directional bias rather than a precise timing tool. The transcript does not provide specific yield levels or confirm that this filter produced a verified trading edge in the examples shown.
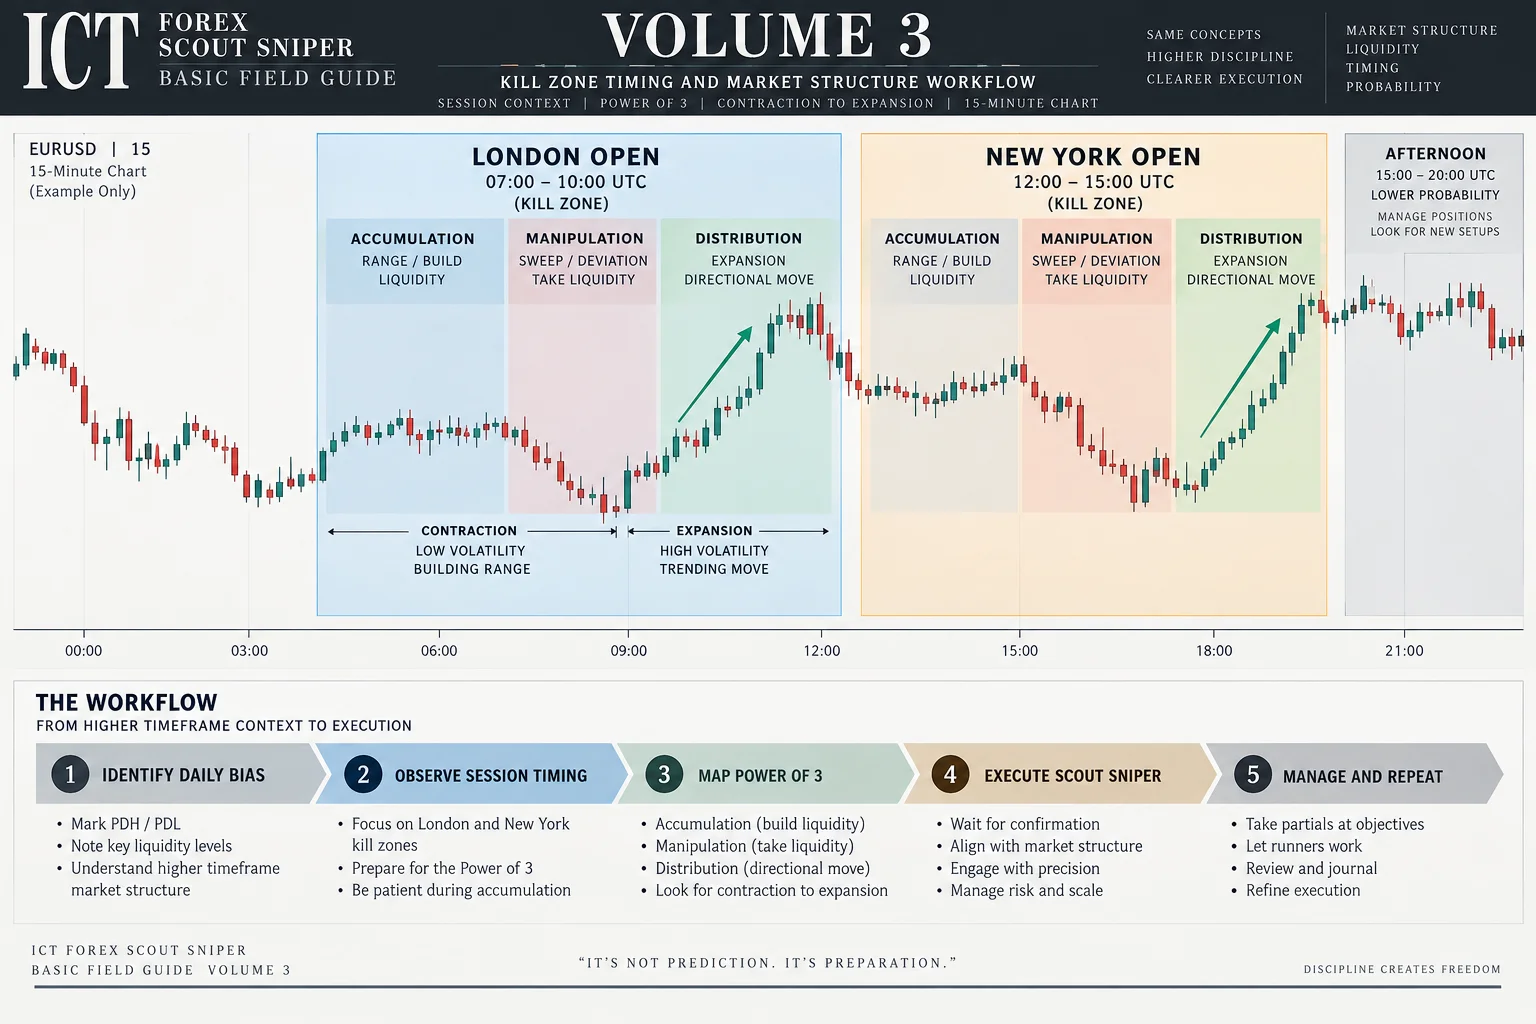
ICT Forex Market Structure and Kill Zone Timing
From approximately 2:05:27 onward, ICT discusses market-structure concepts including what he describes as accumulation, manipulation and distribution phases, a sequence he calls the "power of three." He references London and New York session timing windows as periods where liquidity may be targeted. The captions at these timestamps describe price dropping quickly and a sell-side example, but they do not independently confirm a repeatable kill-zone pattern or validate the dealer-behavior model as a tested system.
ICT also describes market-maker profiles and the idea that dealers reprice markets by sweeping liquidity above or below recent swings. The transcript contains broad claims about dealers accumulating or distributing positions; without order-book evidence, these should be treated as ICT’s interpretation of price behavior.
Watch the ICT Forex Volume 3 Lesson
ICT Forex Volume 3 Practice Tasks
- Mark daily and four-hour swing levels before opening an intraday chart.
- Record important prices separately to keep the chart readable.
- Bracket the stated London and New York windows and observe whether reactions coincide with prior levels.
- Compare 10-year yields as macro context while avoiding a one-factor conclusion.
- Study contraction-to-expansion sequences and market-structure changes using historical data or a demo account.
This material is educational commentary on one historical ICT presentation. It is not investment advice, and the video does not establish that the described patterns will recur or produce profitable results.
ICT Forex Volume 3 Resources
- ICT Forex Scout Sniper Basic Field Guide Vol. 3 (original video) Primary source for all timestamped references in this article.
- Inner Circle Trader YouTube channel Official channel for ICT's public educational content.



