
How we researched this article
BestProps used document-based research from primary firm sources, checked September 25, 2026. The complete source list, scope, limitations, and commercial-state record appear near the end of this article.
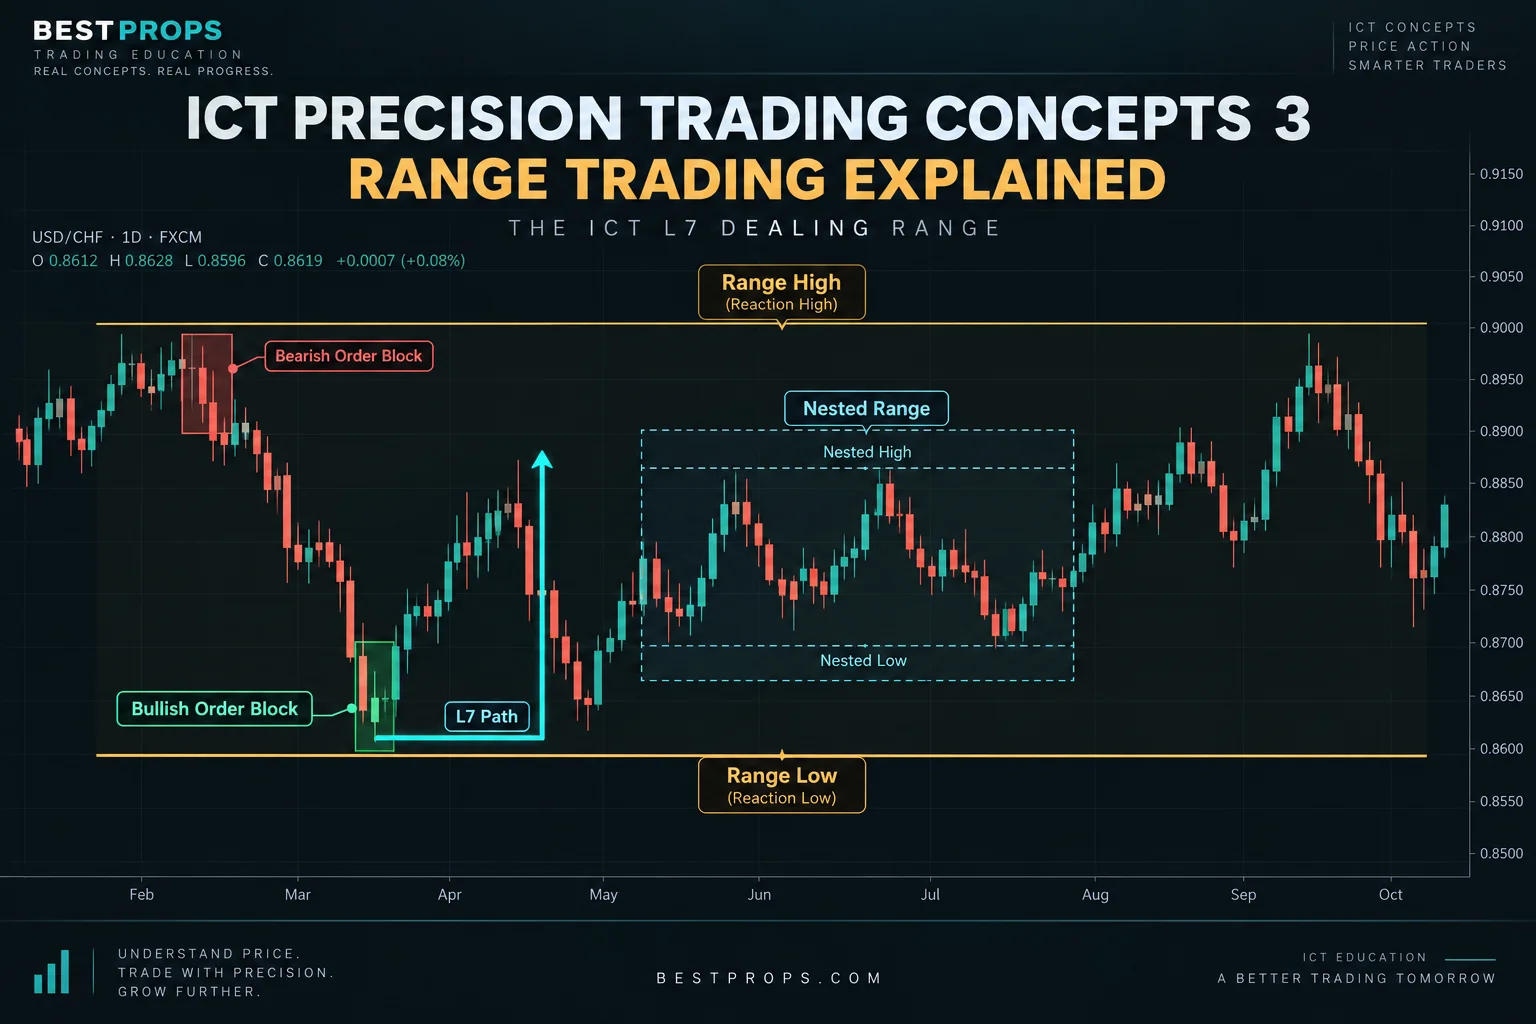
In ICT Precision Trading Concepts – 3, uploaded on December 26, 2017, ICT concludes this three-part series by discussing how he interprets price action inside a predefined dealing range. Whereas the earlier installments addressed weekly order flow and weekly order blocks, this lesson focuses on trading between established highs and lows without requiring a persistent directional bias.
The presentation uses a daily USD/CHF chart, but the captions do not expose the chart’s dates or exact price levels. The examples should therefore be understood as ICT’s retrospective chart interpretation—not as independently tested evidence or a record of executable trade results.
The “L7” range idea
ICT introduces what the captions render as the “L7 range” concept. He describes it as a simple visual mnemonic he used when teaching his children. The “L” represents the relationship between the trader’s present location near one side of a range and a reference point on the other side. Later, the “7” is used to visualize the reverse orientation when price is near the upper boundary.
The terminology is informal, and the generated captions alternate among “L7,” “seven range,” and similar phrases. The supported point is not the exact spelling of the label but the underlying exercise: identify a meaningful high and low, determine where price currently sits between them, and then examine possible movement back toward the opposite side.
Defining the active dealing range
At 3:46, ICT explains that his understanding of a trading range is broader than a narrow sideways consolidation. In his framework, a reaction low and reaction high can define a range even when price makes forceful moves within—or briefly beyond—those boundaries.
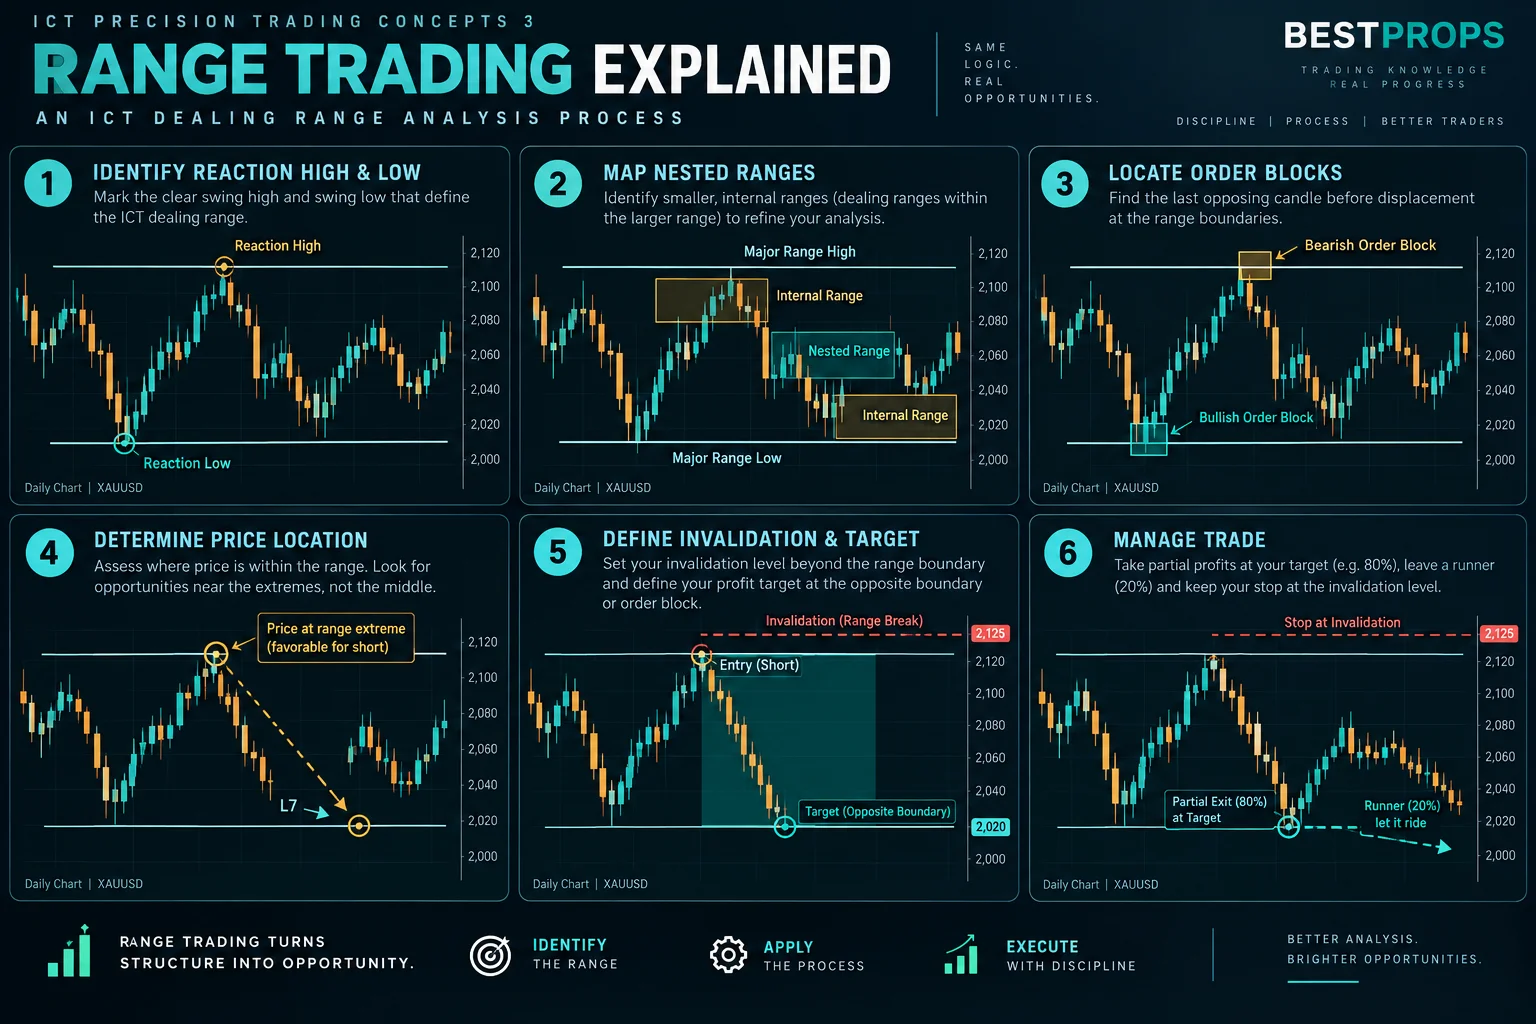
That creates an important practical question: which range is currently relevant? A chart may contain several nested ranges formed by long-term and short-term swing points. Around 10:50, ICT marks multiple highs and lows as potential reference points. His process can be summarized as follows:
ICT repeatedly states that markets remain within ranges about 70% of the time. He uses that figure as the premise for expecting many attempted breakouts to return inside the range. The video does not provide a dataset, definition, or statistical test supporting the percentage, so it should be treated as ICT’s stated heuristic rather than a verified probability.
- Locate visible reaction highs and lows.
- Identify the pair of boundaries within which current price is operating.
- Recognize that smaller dealing ranges can exist inside a larger one.
- Update the range after a boundary is violated and a new swing extreme forms.
- Use prior order blocks and short-term highs or lows as possible objectives within that structure.
Combining range location with order blocks
The lesson does not suggest trading every touch of a boundary. ICT combines range location with his order-block framework. Near the bottom of a range, he looks for a bullish order block and considers old highs or bearish order blocks above as potential objectives. Near the top, he reverses the logic: a bearish order block may provide context for movement back toward a bullish order block or prior low.
At 15:53, ICT summarizes the intended benefit: a trader who knows the present range may consider short-term opportunities in either direction without first committing to a long-term trend forecast. He mentions intraday scalps, day trades, and short-term swings, while warning against remaining in a position too long.
ICT characterizes USD/CHF as volatile and range-bound in the chart under discussion. That is his market interpretation in this lesson, not a universal property established by the transcript. He also acknowledges that price can move through an order block and later presents an example that he says would have produced a loss. This is a useful limitation because it shows that the framework does not make every range-based setup successful.
Why ICT emphasizes the range extremes
The clearest operational message appears near 28:48. ICT says traders should concentrate most of their activity near the outer extremes rather than in the middle of a range. In his interpretation, buying after price has already reached the upper extreme—or selling near the lower extreme—offers less favorable positioning for a return toward the range interior.
This does not mean a boundary must hold. The transcript includes examples in which price briefly sweeps an old high or low, returns inside, and eventually establishes a new range. The framework is therefore about organizing scenarios around location, not treating horizontal boundaries as guarantees.
Objectives and partial exits
ICT also connects range analysis to trade management. Around 18:10, he discusses taking a substantial partial exit near the opposite side of a range and leaving a smaller portion open in case price continues. His example uses an 80% reduction and a 20% remainder, but the transcript supplies no account records, fills, costs, or forward results validating that allocation.
The educational principle is narrower: predetermined boundaries can provide a reason for reducing exposure instead of assuming that every move will become a breakout. Any specific position-sizing method would still require independent risk analysis and testing.
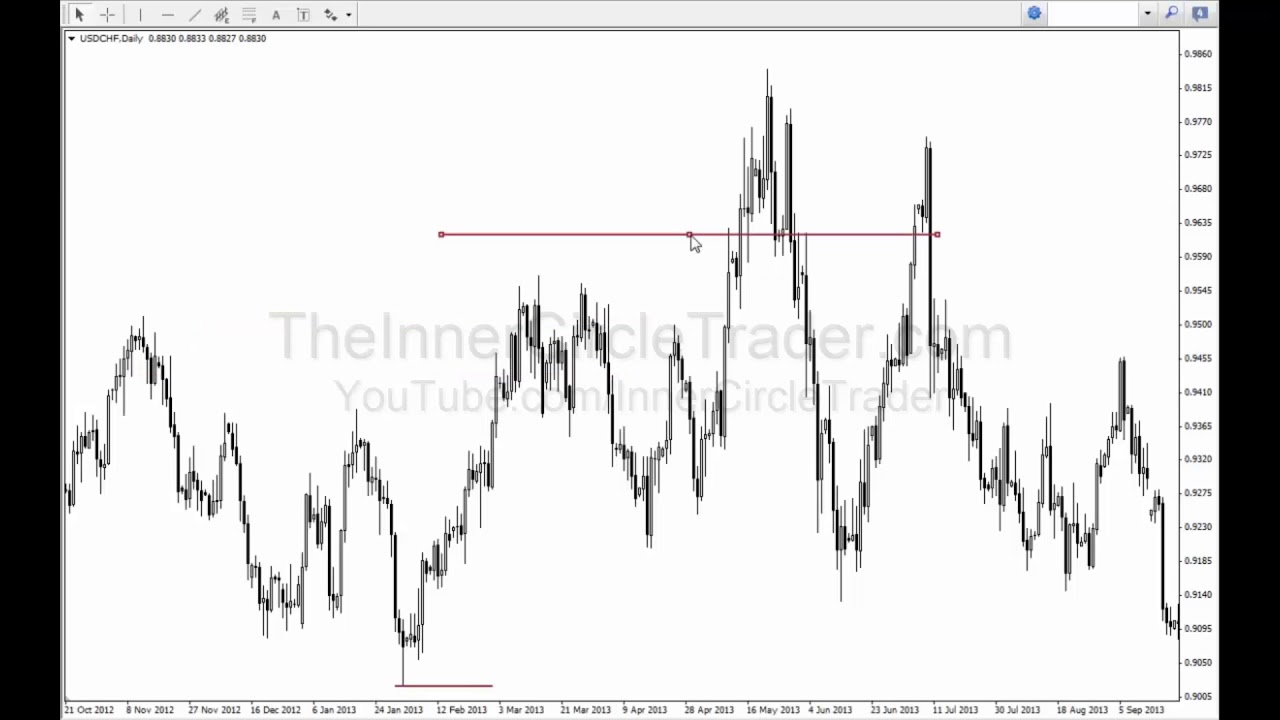
ICT Precision Trading Concepts – 3
ICT concludes the three-part Precision Concepts series by explaining how to trade inside a predefined dealing range using the L7 framework, nested ranges, order blocks, and range extremes.
Watch on YouTubePractical study takeaway
In the closing recap, ICT returns to three questions: Where is price inside the current range? Which highs and lows define that range? Where are the relevant opposing order blocks? He contrasts this active, two-sided style with the more directional approach discussed in the first two videos and explicitly notes that taking more trades can also create more losing opportunities.
A neutral way to study the lesson is to annotate historical charts without assuming the conclusion: mark ranges using rules defined in advance, record every qualifying example rather than only attractive ones, and distinguish temporary boundary sweeps from confirmed range changes. That turns ICT’s visual framework into a reviewable exercise while avoiding the assumption that its stated probabilities or outcomes are proven. This material is educational and is not investment advice.
Additional Resources
- ICT Precision Trading Concepts – 3 (YouTube) — Primary source video uploaded December 26, 2017.
- Support and Resistance Basics (BabyPips) — Foundational reference for identifying reaction highs and lows.
- Order Block Definition (Investopedia) — Third-party explanation; unofficial and untested in the context of ICT’s specific methodology.



