
How we researched this article
BestProps used document-based research from primary firm sources, checked September 25, 2026. The complete source list, scope, limitations, and commercial-state record appear near the end of this article.
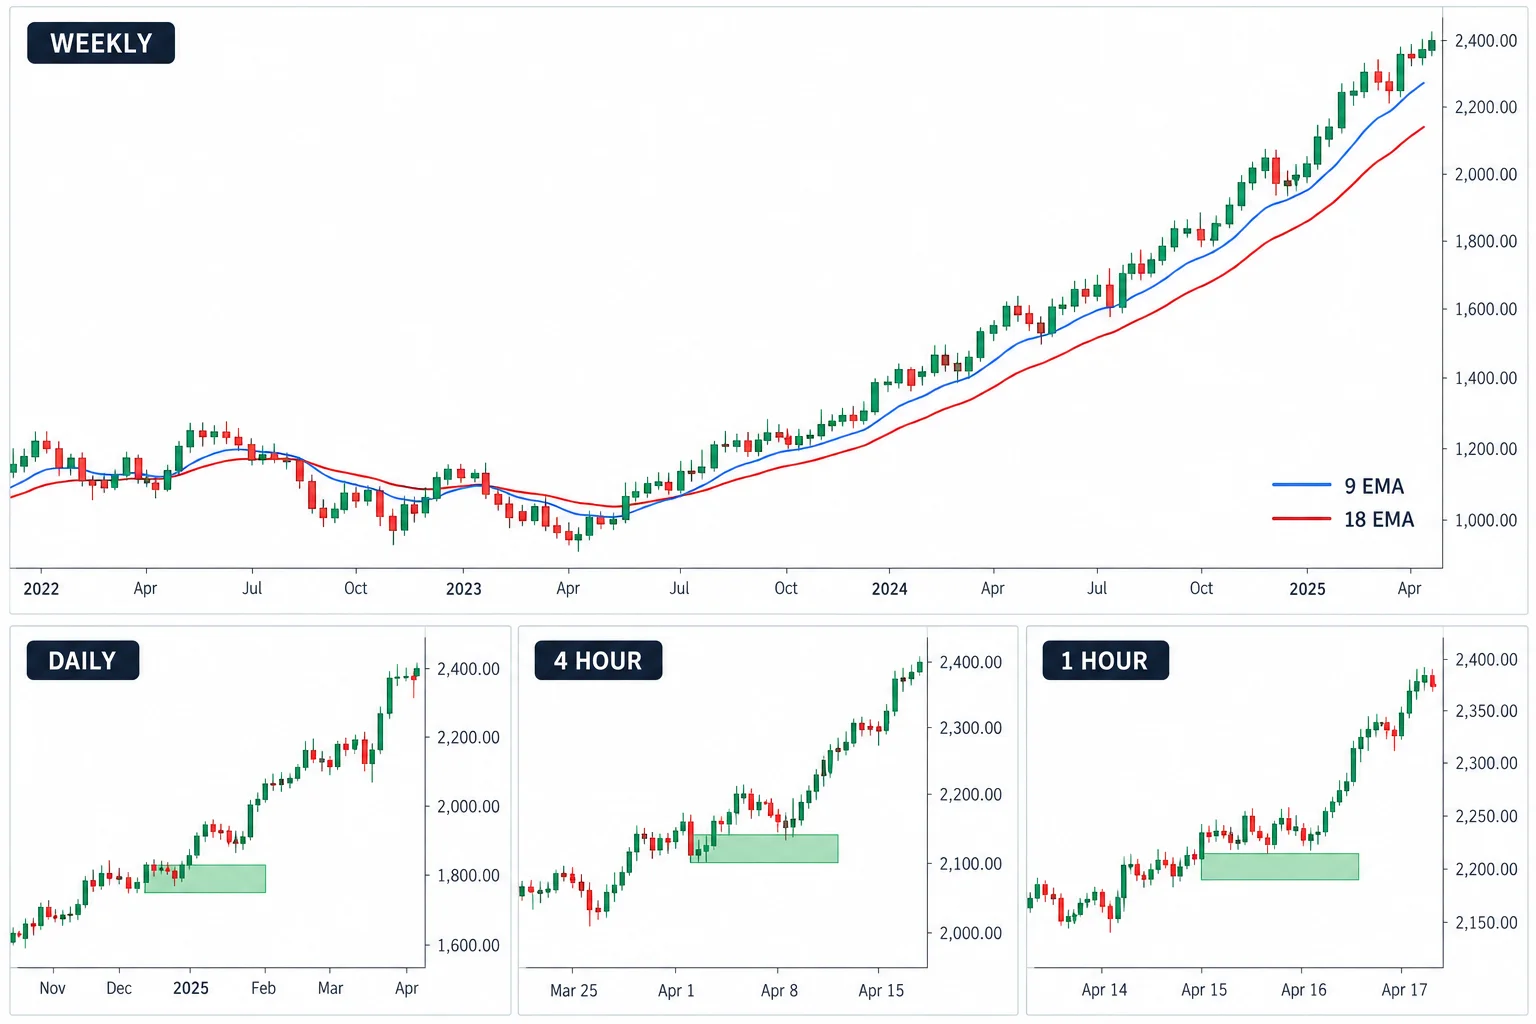
In ICT Precision Trading Concepts – 1, uploaded December 26, 2017, ICT presents a top-down framework for combining weekly directional context with lower-timeframe order blocks. The central lesson is not that the weekly chart supplies exact entries. Instead, ICT uses it as a filter for deciding whether to concentrate primarily on bullish or bearish setups.
The presentation includes strong claims about institutional activity and the usefulness of this framework. These should be understood as ICT’s interpretation of price action, not as independently verified facts or evidence of a proven trading edge. ICT also repeatedly acknowledges that losses remain possible, individual results differ, and the concepts deal in probabilities rather than certainty.
The weekly chart as a directional filter
ICT introduces the module as a lesson on weekly order blocks and order flow. His argument is that traders often focus on daily and intraday charts while overlooking the weekly timeframe. In his framework, the weekly chart establishes a broad directional premise that can guide day trades, swing trades, and other shorter-term decisions.
At 7:12, he says weekly trends and order flow tend to persist and require a meaningful change before reversing. His practical conclusion is that short-term fluctuations should not automatically override the higher-timeframe view. A trader following this approach would first identify the weekly condition and then wait for a lower-timeframe setup aligned with it.
This is also presented as a way to reduce reactive decision-making. Around 15:42, ICT contrasts a higher-timeframe premise with the “noise” of small intraday moves. He does not deny that traders can scalp countertrend fluctuations; rather, he explains that such trading is outside this lesson’s purpose.
The 9 and 18 exponential moving averages
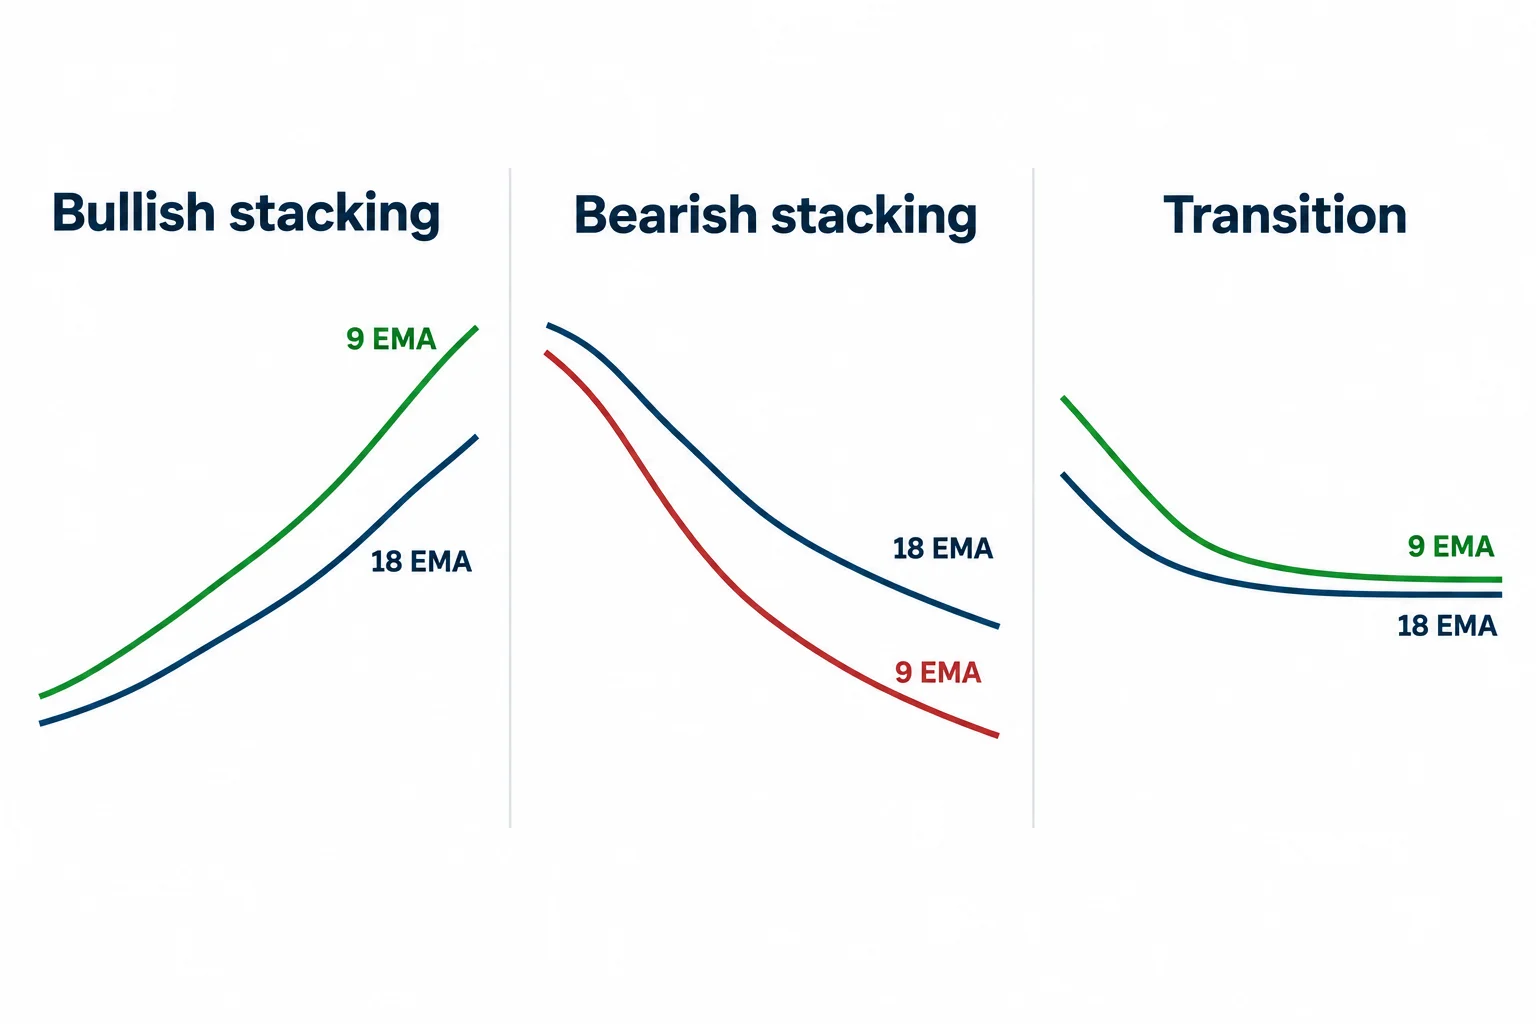
The module’s most concrete rule begins at 18:48. ICT applies a 9-period EMA and an 18-period EMA to the weekly chart:
- Bullish weekly order flow: the 9 EMA is above the 18 EMA, and the averages are widening while pointing upward.
- Bearish weekly order flow: the 9 EMA is below the 18 EMA, and the averages are widening while pointing downward.
- Transition or consolidation: the averages converge, cross, flatten, or cease to provide a clearly stacked condition.
ICT calls the widening, same-direction arrangement “stacking.” He recognizes that moving averages lag and that transitions can produce losses. In the chart discussion beginning near 27:40, he says he waits for an actual crossover rather than anticipating one from every temporary downturn.
Educationally, the distinction is important: the EMAs are being used as a regime filter, not as a precise entry signal. They simplify the directional decision, but they cannot establish that a market will continue in that direction.
Pairing weekly direction with lower-timeframe order blocks
After establishing what he labels bullish weekly order flow on a EUR/USD example, ICT moves to a lower timeframe. At approximately 31:51, he explains that the weekly condition narrows his search to bullish order blocks.
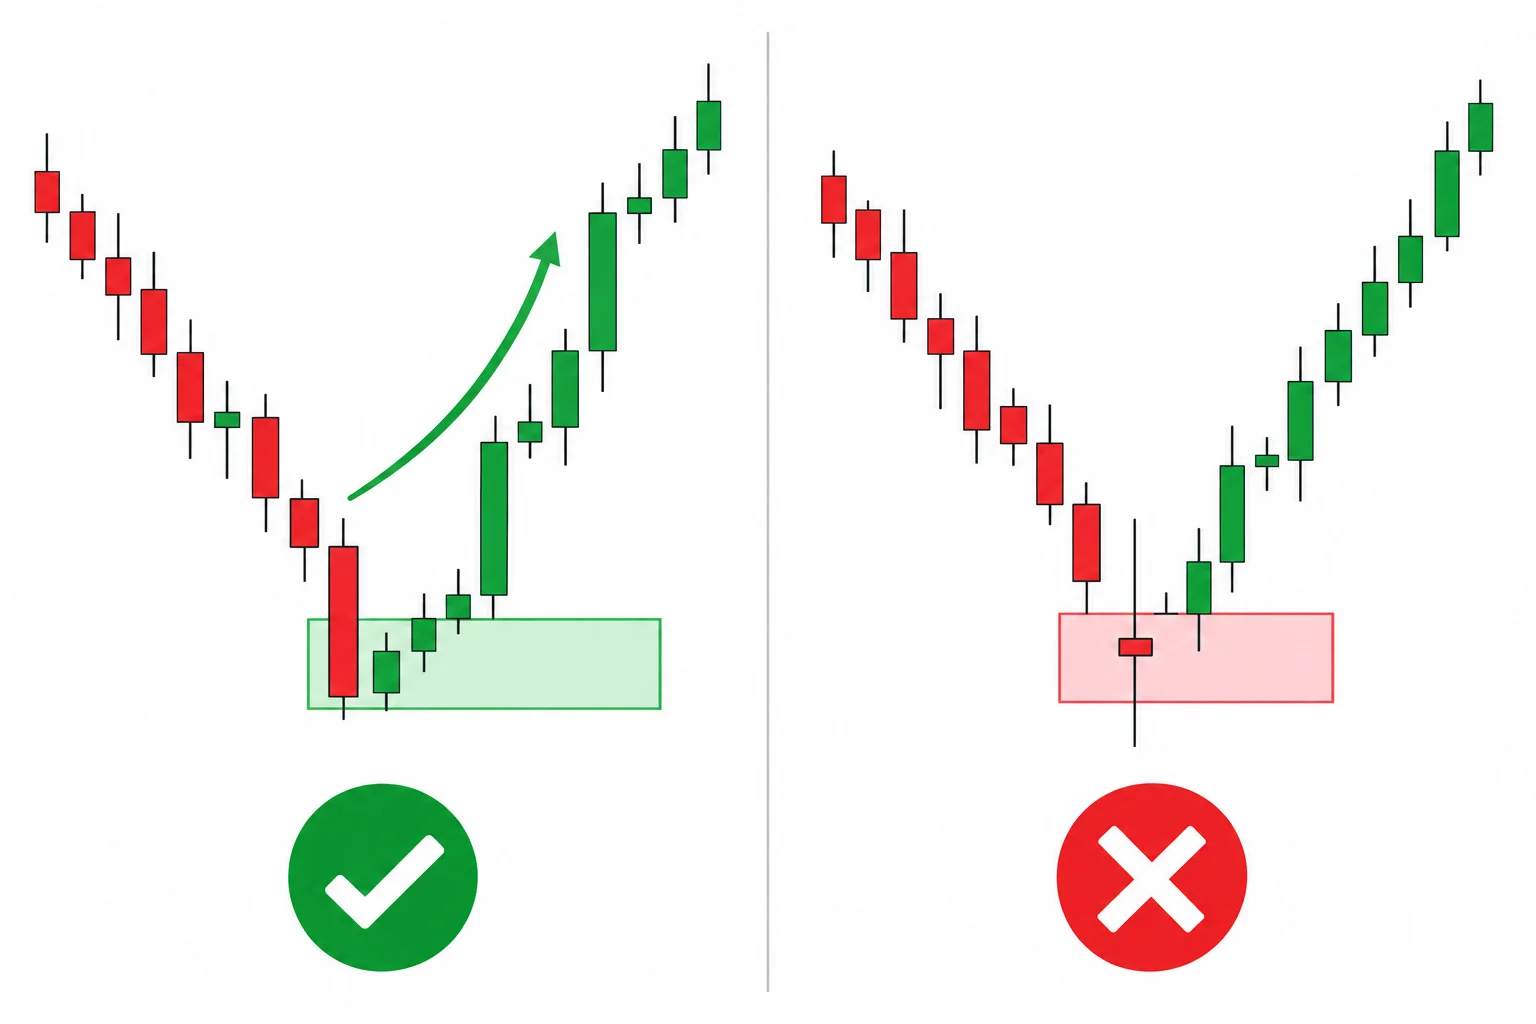
Within the terminology used in this lesson, a bullish order block is generally the bearish candle immediately preceding an impulsive move higher. ICT prefers examples with a substantial candle body and is reluctant to use long-wick or spinning-top-like candles. He also treats a rapid departure from the area as a qualifier. Once price revisits such an area, he looks for a possible bullish reaction when the weekly filter is bullish.
The reverse logic would apply in a bearish weekly condition: focus on bearish order blocks and selling opportunities. The video, however, spends most of its chart walkthrough illustrating bullish conditions.
ICT further discusses repeated reactions around an order block. Near 40:40, he interprets several holds near one area as support for trusting the level. That institutional interpretation is his own market model; the transcript does not independently verify who traded there or why price reacted.
Patience, selectivity, and risk
A recurring theme is that directional alignment is intended to discourage chasing every move. At 43:00, ICT asks why someone would short while his weekly flow and lower-timeframe bullish order blocks remain aligned. His preferred response to a missed move is to wait for another qualifying retracement rather than force a countertrend trade.
He also warns against expecting to capture every swing. Around 1:11:23, the advice is to accept missed moves and repeatedly seek only a limited segment of price action. This is one of the lesson’s more broadly applicable educational points: a defined process can help separate planned opportunities from impulsive participation.
The video contains promotional-sounding examples and hypothetical pip or reward-to-risk figures, but it also includes explicit cautions. ICT says:
- the method does not eliminate losing trades;
- excessive leverage and oversized risk can cause substantial losses;
- backtesting differs from making decisions in real time;
- one trader’s results should not be assumed transferable to another;
- development should be measured against one’s own prior understanding, not against a mentor.
Those cautions are especially clear in the discussion beginning at 24:00, where ICT describes the method as probabilistic rather than certain. The transcript reports chart examples selected and narrated by the speaker; it does not provide independently auditable fills, transaction costs, a complete trade log, or subsequent performance.
A practical study sequence
For chart study—not a recommendation to trade—the lesson can be reduced to four steps:
- Open a weekly chart and apply the 9 and 18 EMAs.
- Classify the weekly condition from the relative position, direction, and separation of the averages.
- Move to a lower timeframe and mark only order blocks aligned with that weekly classification.
- Document both successful and failed reactions, including ambiguous transitions, spreads, and invalid setups.
The last step is essential because the video mostly illustrates historical chart reactions. Reviewing failures and unclear cases is necessary before drawing any conclusion about how the framework behaves. This material is educational commentary, not investment advice or a promise of results.
Additional Resources
- Investopedia – Order Block Definition (educational reference; not ICT-specific)
- CME Group Education – Market Mechanics & Order Flow (official exchange educational materials)
- SEC Investor Alert – Day Trading Risks (regulatory risk disclosure)




