
Key takeaways
ICT Optimal Trade Entry, or OTE, is a retracement-entry framework that combines higher-time-frame direction, an impulsive market-structure break, Fibonacci levels, predefined invalidation and staged exits.
Read the full summary
ICT Optimal Trade Entry, or OTE, is a retracement-entry framework that combines higher-time-frame direction, an impulsive market-structure break, Fibonacci levels, predefined invalidation and staged exits. Bullish setups require an upward impulse and pullback, while bearish setups require a downward impulse and rally. The measured impulse leg defines a 62% to 79% OTE zone with 70.5% as the preferred sweet spot, and ICT may enter near 62% while allowing a deeper retracement. Analysis starts with monthly, weekly and daily highs and lows before moving intraday, and candle bodies are preferred over wicks because forex feed extremes can differ. A EUR/USD example uses an old monthly high, an institutional price increment and a 15-minute chart, with a break above a short-term high followed by stronger confirmation above an intermediate-term high. Risk runs from the proposed entry to the originating swing extreme, position size follows a chosen account-risk percentage, and the preferred first scale-out near a prior high or low targets roughly twice initial risk before later extension targets and a smaller measured-move position. ICT warns against tightening stops while price remains inside the setup and states that OTE is hypothetical educational material, not proof of profitability or a guarantee of results.
How we researched this article
BestProps used document-based research from primary firm sources, checked September 25, 2026. The complete source list, scope, limitations, and commercial-state record appear near the end of this article.
In OTE Primer – Intro To ICT Optimal Trade Entry, the Inner Circle Trader (ICT) introduces Optimal Trade Entry, or OTE, as a framework for entering a retracement after a directional price move. The lesson combines higher-time-frame context, a break in market structure, Fibonacci retracement levels, predefined risk, and staged profit objectives.
This is a summary of ICT’s teaching and market interpretation, not evidence that the model is profitable or suitable for every trader. ICT also states early in the recording that he cannot promise viewers will make money and presents the material as hypothetical and informational.
How ICT Optimal Trade Entry Works
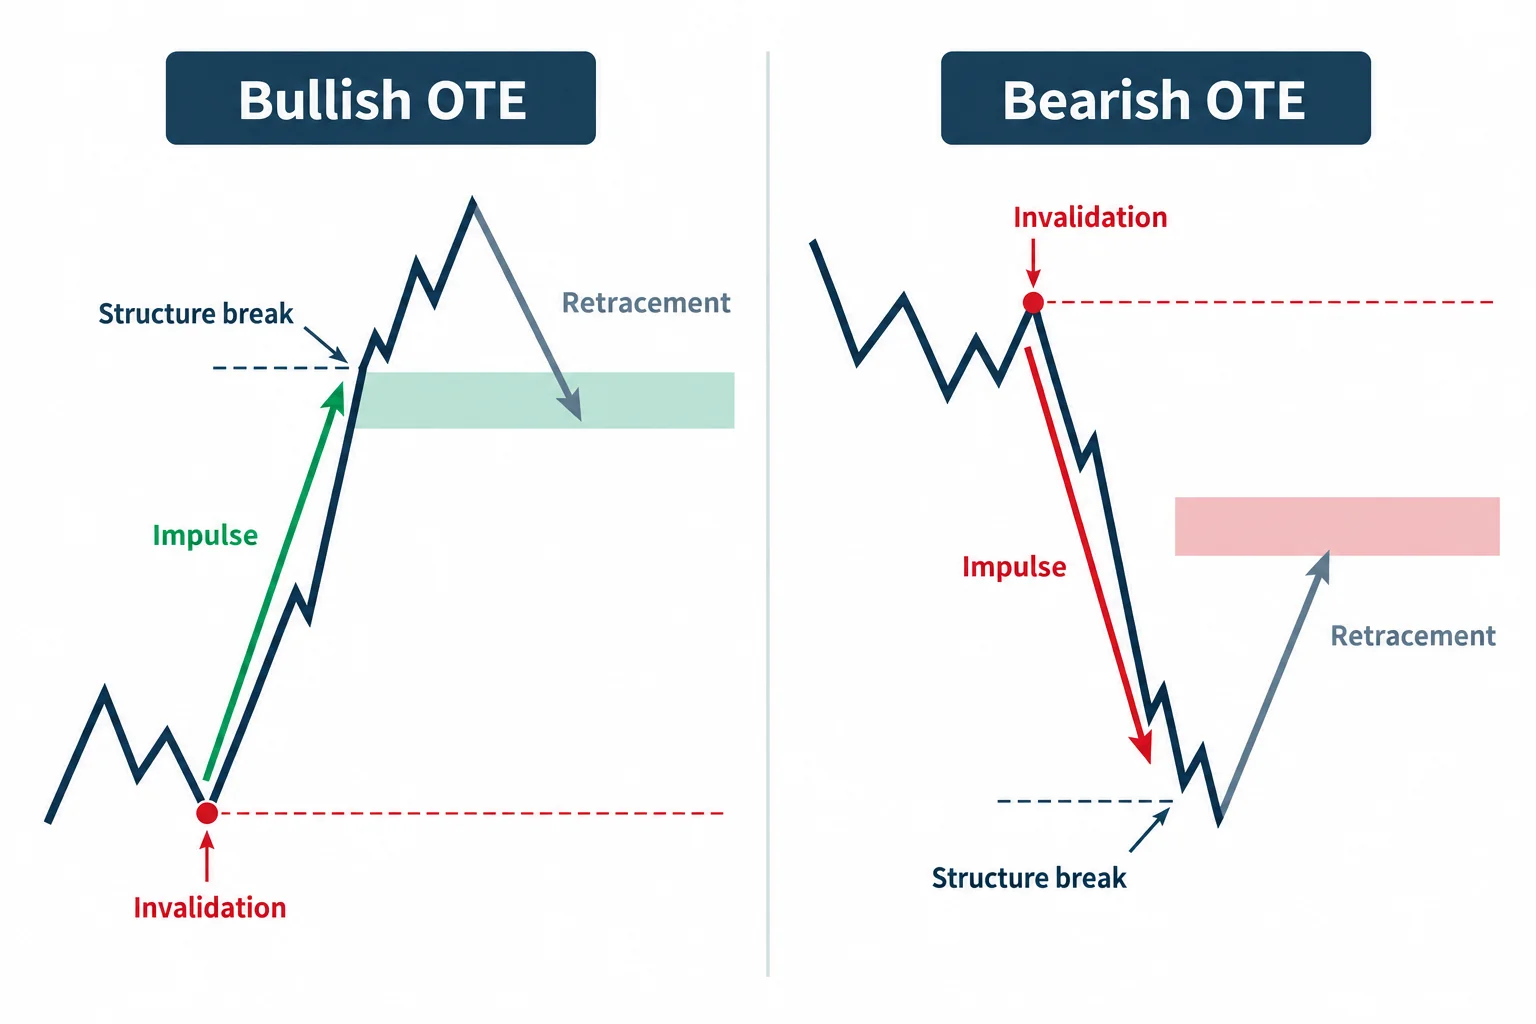
ICT gives the basic definition at 9:06. In a bullish scenario, the model looks for an impulsive move higher that breaks market structure, followed by a retracement in which a long entry may be considered. In a bearish scenario, the sequence is reversed: an impulsive decline, a structural break, and then a rally that may provide a short-entry opportunity.
- Bullish OTE: establish a bullish premise, observe an upward impulse and structural break, then evaluate a pullback.
- Bearish OTE: establish a bearish premise, observe a downward impulse and structural break, then evaluate a retracement higher.
- Invalidation: ICT frames risk against the origin of the relevant price swing rather than treating the retracement level alone as sufficient.
The central point is that OTE is not presented as buying or selling every Fibonacci retracement. Directional context and market structure come first.
ICT Optimal Trade Entry Fibonacci Levels
Beginning around 10:17, ICT explains his Fibonacci template. He defines the OTE area as a retracement from approximately 62% to 79% of the selected impulse leg, with 70.5% described as a preferred “sweet spot.” He says he may seek an entry near the 62% level while allowing price to move more deeply into the range.
The distinction matters: the 62%–79% interval is a zone within ICT’s model, while 70.5% is a favored reference inside it. None of those numbers independently establishes direction or confirms that a reversal will occur.
How ICT Selects the Measured Swing
The Fibonacci tool is applied to an impulse leg associated with a structural break. Later in the example, ICT says he prefers using candle bodies when selecting swing references because quoted wick extremes can vary across foreign-exchange data feeds. That explanation appears near 35:35.
Because the source is an audio transcript without verified chart images, the precise anchors shown on screen cannot be independently confirmed here. The supported lesson is that ICT measures the relevant impulse, not an arbitrary recent high and low.
ICT Optimal Trade Entry and Higher Time Frames
At 5:23, ICT begins with what he calls market predisposition: a view that price is more likely to move higher or lower. He recommends examining monthly, weekly, and daily levels before moving to an intraday chart. Old highs and lows are used as potential reference points where price previously moved away.
ICT interprets these reactions as signs of institutional interest. That is his market framework rather than a fact demonstrated by the transcript. For practical study, the sequence taught in the video can be separated into four questions:
- What is the higher-time-frame directional premise?
- Has price reacted around a meaningful prior high or low?
- Has an impulsive move broken a short- or intermediate-term structural point?
- Does the subsequent retracement enter the measured OTE range?
ICT argues that starting with higher time frames reduces the distraction created by very short-term fluctuations. He later notes that hourly setups may offer more range than one- or five-minute examples, although the transcript does not provide comparative testing of that claim.
ICT Optimal Trade Entry EUR/USD Example
From approximately 20:26, ICT walks through a EUR/USD example, first on a higher-time-frame chart and then on a 15-minute chart. He identifies an old monthly high, rounds it to what he calls an institutional price increment, and watches for a reaction after price returns to that area.
At 27:30, he describes price rallying from the level and moving above a short-term high. ICT labels that movement a market-structure break. A later break above a more significant intermediate-term high is treated as stronger confirmation within his framework. He then measures the impulse and identifies the retracement as the OTE portion of the sequence.
The transcript records ICT’s narration of the chart, but it does not establish an actual trade fill, independently verified order flow, or later trading result.
ICT Optimal Trade Entry Risk and Profit Management
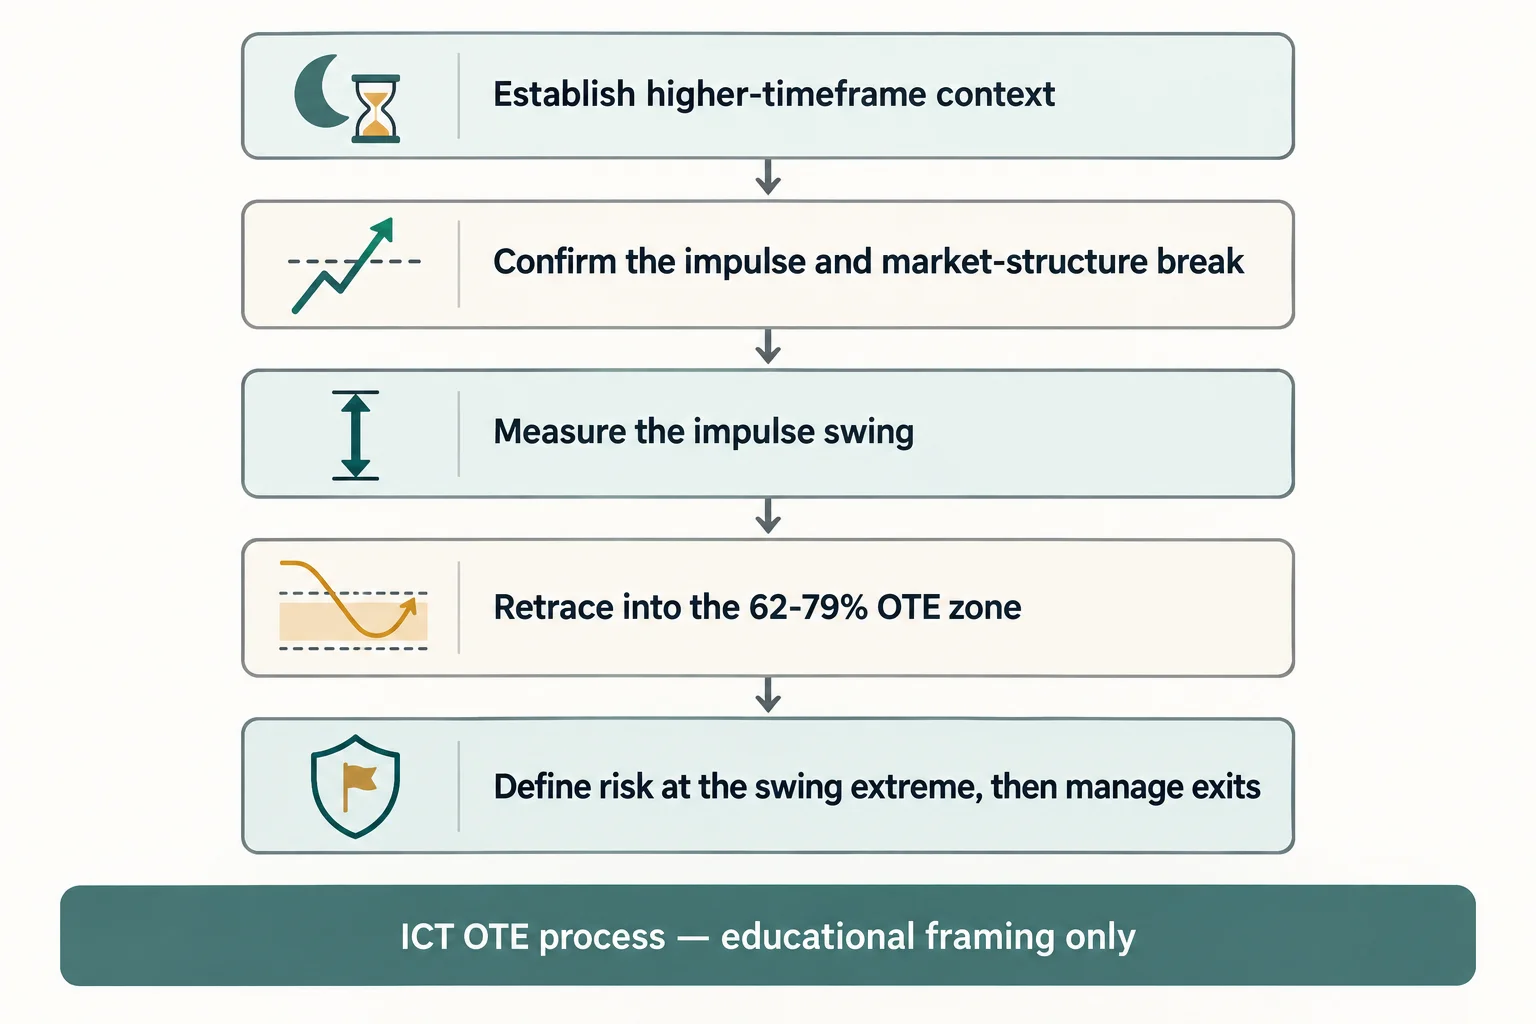
ICT emphasizes that a setup still requires a risk plan. Around 15:40, he discusses defining risk between the proposed entry and the swing extreme used for invalidation, then sizing the position according to a chosen percentage of the account.
He distinguishes a first scale-out near the prior high or low from subsequent extension targets. His preferred setup seeks roughly twice the initial risk by the first partial-profit point, although he mentions accepting less under some conditions. This is ICT’s personal trade-management preference, not a universal rule or performance guarantee.
In the chart recap near 37:17, he warns against moving a stop too close while price is still fluctuating inside the setup. He then describes scaling out as price reaches successive objectives and leaving only a smaller portion for a possible measured move.
How to Study ICT Optimal Trade Entry
A source-faithful study exercise is to mark historical higher-time-frame highs and lows, identify an impulse that breaks a prior structural point, and measure its retracement. Record whether price reaches the 62%–79% area, where invalidation would have been defined, and whether a plausible first objective offered sufficient distance relative to that risk. Use historical observation or simulation rather than assuming the narrated example predicts future behavior.
The most important takeaway is that ICT presents OTE as one component of a larger process: directional context, structural confirmation, retracement, invalidation, and exits. The Fibonacci range is the entry framework, not the entire setup.
Watch the original lesson on YouTube
The video cannot be played inside another website: when its embedded player was opened and clicked on 22 September 2026, the player itself reported “Playback on other websites has been disabled by the video owner.” and settled on a “Watch on YouTube” prompt, with no playback progress reported. That is the reason no embed is reserved or left blank here; the recording itself is available directly on YouTube.
Watch OTE Primer – Intro To ICT Optimal Trade Entry on YouTube ↗
Primary source and further reading
- The original Inner Circle Trader lesson: use the timestamp links in this article to compare the explanation with its source.
- YouTube’s embedding documentation: platform guidance relevant to the external watch link above.
- 17 CFR 4.41: disclosures concerning hypothetical performance: a regulatory reference, not a statement that a particular recording or this article meets every legal requirement.
This is independent educational commentary. It is not official ICT material, a tested trading system, or a claim that the reported results can be reproduced.



