
Key takeaways
ICT defines the classic New York Killzone as seven a.m.
Read the full summary
ICT defines the classic New York Killzone as seven a.m. through nine a.m. New York time, a two-hour observation window within the broader New York session ending at two p.m., focused mainly on major USD currency pairs. The preferred continuation model combines a daily-chart directional bias, confirming London-session price action, and a New York retracement before renewed expansion in the daily direction. In bullish conditions London forms a low, price rises, then retraces after seven a.m. toward an ICT optimal trade entry before potentially continuing higher, with the logic reversed for bearish conditions. ICT treats reversals as more demanding, says the clock window alone is not an entry signal, and describes liquidity concepts including equal lows, stops beneath them, relative equal highs, and a possible liquidity run before continuation. News may accelerate or reverse price, but the lesson provides no event filter, precise entry calculation, risk rules, testing methodology, costs, verified fills, loss statistics, or audited performance. ICT recommends retrospective chart study rather than daily live trading and acknowledges that examples are easier to identify with hindsight.
How we researched this article
BestProps used document-based research from primary firm sources, checked September 25, 2026. The complete source list, scope, limitations, and commercial-state record appear near the end of this article.
The “ICT New York Killzone” is a time-based framework presented by ICT for studying price action around the New York open. In the source lesson, ICT defines the classic window as 7:00 a.m. to 9:00 a.m. New York time and focuses primarily on major currency pairs involving the US dollar.
This article summarizes ICT’s teaching in ICT Forex – The ICT New York Killzone, uploaded on December 9, 2017. The ideas below are ICT’s market interpretations, not independently established trading rules or promises of performance.
Watch: ICT Forex – The ICT New York Killzone
ICT’s original lesson on the New York Killzone, posted to YouTube on December 9, 2017. Approximately 16 minutes.
Watch on YouTubeWhat Time Is the ICT New York Killzone?
ICT introduces the classic New York Open Killzone as the period from 7:00 a.m. through 9:00 a.m. New York time. He describes time and price as the central concepts and says he prefers to monitor major currency pairs coupled with the dollar during this window.
The broader New York session is treated separately. Later in the lesson, ICT describes that session as extending until 2:00 p.m. New York time. Thus, the two-hour killzone is a narrower study window within the longer session, not another name for the entire New York trading day.
ICT New York Killzone Core Model
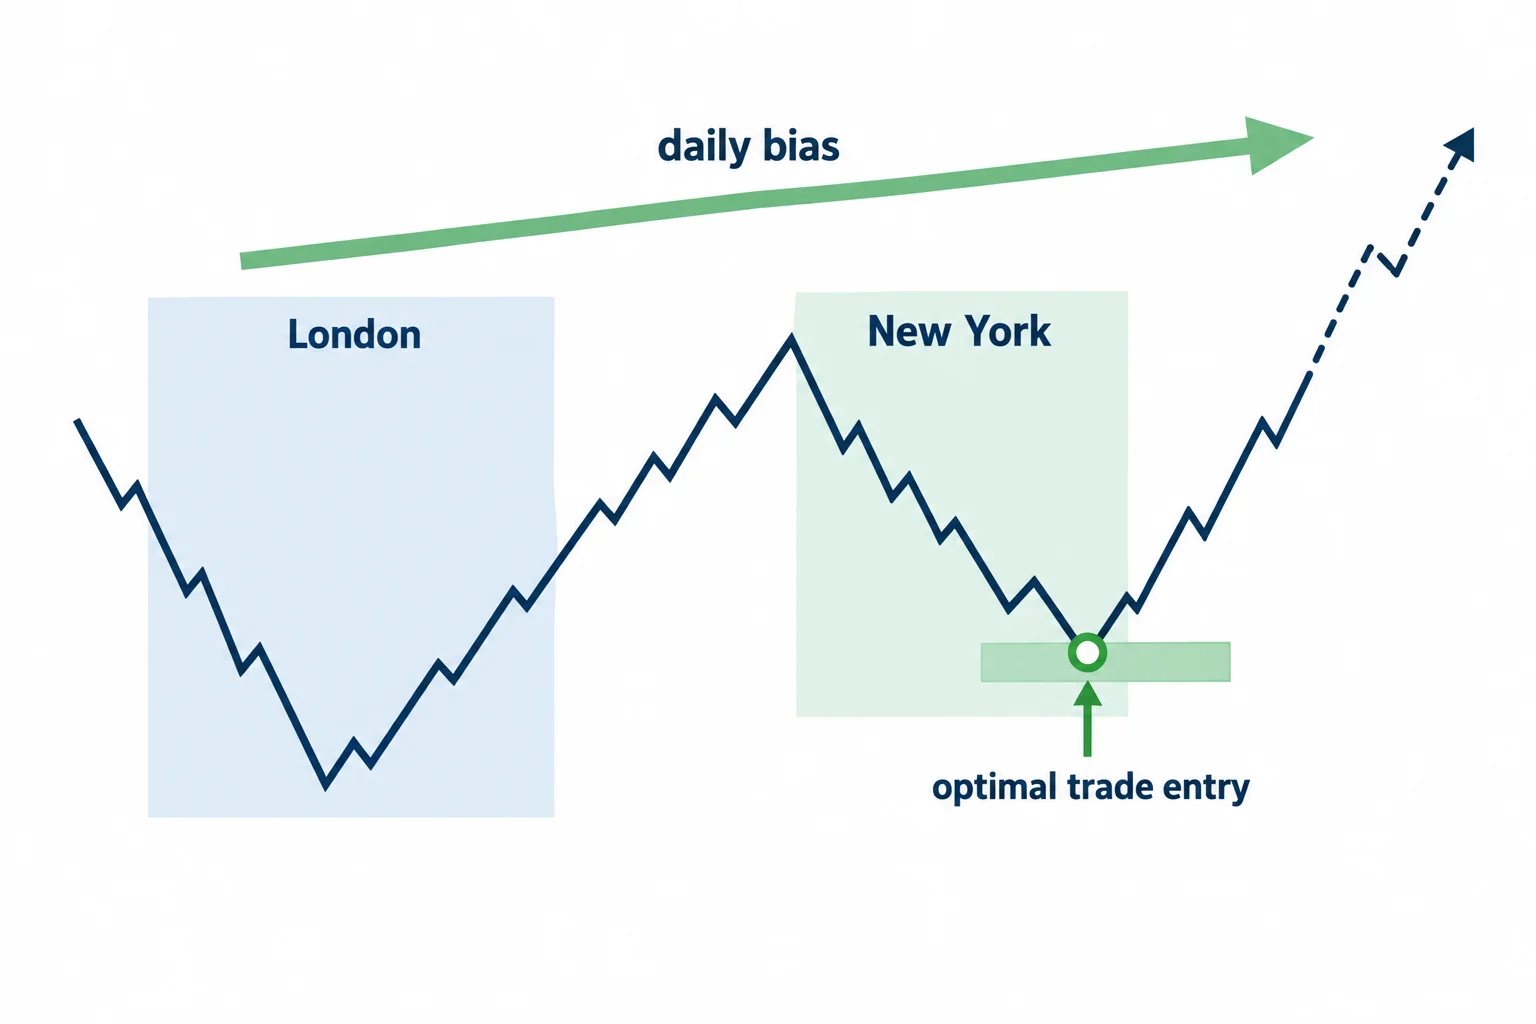
The lesson’s main model combines three elements:
- A directional view derived from the daily chart.
- London price action that supports that directional view.
- A retracement during the New York killzone, followed by a possible continuation in the anticipated daily direction.
ICT considers continuation of London’s move easier to study than a complete daily reversal. At 9:53, he begins explaining that when the daily chart has clear one-sided momentum, the trader should look for London price action to confirm it.
Bullish ICT Daily Bias Example
For a bullish daily bias, ICT’s sequence is broadly as follows:
- London establishes a session low and price moves upward.
- Price retraces lower as the New York open approaches.
- The trader studies that decline for what ICT calls an “optimal trade entry.”
- The anticipated move is renewed expansion in the bullish daily direction.
ICT restates this model at 13:03: if the daily view is bullish, he looks for London to create a low and for a retracement after 7:00 a.m. before anticipating upside expansion.
Bearish ICT Daily Bias Logic
ICT says the framework is reversible. In his verbal description of a EUR/USD chart, the Asian session creates a swing high, London forms another high, and the New York retracement creates a high before price moves lower. Because the transcript cannot verify the chart itself, this should be understood as ICT’s narration of the displayed example rather than an independently confirmed price sequence.
London's Role in the New York Killzone
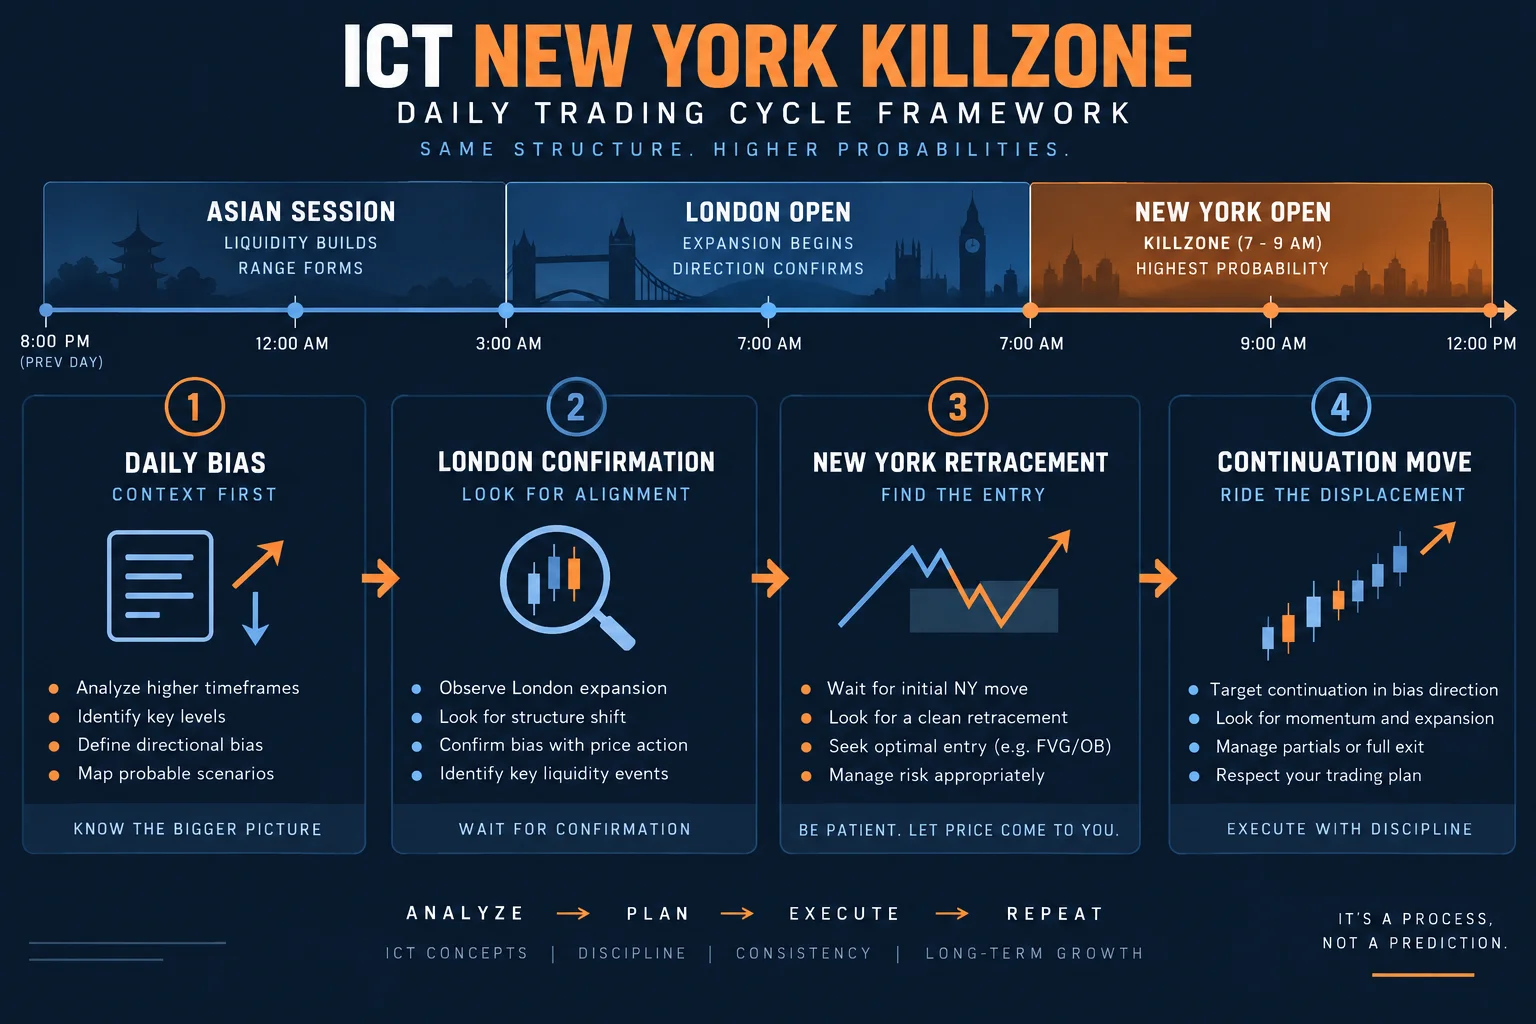
The New York window is not taught in isolation. ICT says its “secret” is what has already happened in London. Near 14:36, he summarizes the process as establishing a daily bias, waiting to see whether London supports it, and then watching for a New York retracement.
This makes the model conditional. A clock reading between 7:00 and 9:00 a.m. is not, by itself, an entry signal. In the lesson, the time window is used to organize observation after a directional thesis and London-session structure have already been considered.
New York Killzone Continuation and Reversal
ICT identifies two possible New York-session scenarios at 9:13:
- Continuation of the move established during London.
- A reversal of the day’s direction.
He concentrates on continuation because he regards reversal analysis as more demanding and dependent on additional conditions. His educational preference in this video is therefore to align the New York setup with the daily bias rather than attempt to trade against the higher-time-frame direction.
New York Killzone News and Volatility
The lesson also notes that the New York session contains recurring economic news releases. ICT says these events may accelerate an existing move or contribute to a reversal, while acknowledging that their effects are not always predictable. The video does not provide a specific news calendar, event filter, or risk-management procedure, so the transcript does not support turning that observation into a mechanical rule.
ICT New York Killzone Liquidity and Trade Entry
In a later narrated USD/CAD example, ICT refers to a retracement, equal lows, stops below those lows, and a liquidity pool above relative equal highs. He interprets the move below the equal lows during the New York open as a run on liquidity before continuation upward.
“Optimal trade entry” is an ICT-specific term used repeatedly in the presentation, but this lesson does not fully define its calculation. Readers should not infer a precise retracement level or executable entry formula from the transcript alone.
How to Study the ICT New York Killzone
ICT repeatedly encourages chart review rather than indiscriminate live trading. At 1:31, he distinguishes the opportunity to study each day from an instruction to trade live funds every day. He also acknowledges at 5:01 that examples are easy to identify in hindsight.
A cautious educational review could therefore label historical charts with the following questions:
- What was the apparent daily directional bias before New York?
- Did London support or contradict that bias?
- Was there a retracement between 7:00 and 9:00 a.m. New York time?
- Did price continue, reverse, or remain unclear?
- Would the setup have been identifiable without knowing what happened afterward?
This type of review can clarify what ICT means by the model, but it does not establish profitability. The transcript supplies no complete testing methodology, transaction costs, verified fills, loss statistics, or independently audited results.
ICT New York Killzone Key Takeaway
In this video, the ICT New York Killzone is best understood as a structured observation period. ICT’s preferred setup aligns daily direction, London-session behavior, and a New York retracement during 7:00-9:00 a.m. New York time. The video emphasizes continuation over reversal and encourages retrospective study, while leaving several entry and risk-management details unspecified.
Further Resources
- ICT Forex – The ICT London Killzone (YouTube) — ICT’s companion lesson covering the London session killzone, directly referenced in this lesson.
- ICT Forex – The ICT Asian Killzone (YouTube) — ICT’s companion lesson covering the Asian session killzone, also referenced in this lesson.
- ICT Forex – Market Maker Primer Course (YouTube playlist) — The full ICT playlist containing the Asian, London, New York, and London Close killzone lessons along with related context.
- ICT Forex – Higher Time Frame Concepts (YouTube) — ICT’s lesson on higher-time-frame analysis, relevant to the daily bias component of the New York Killzone model.



