
How we researched this article
BestProps used document-based research from primary firm sources, checked September 25, 2026. The complete source list, scope, limitations, and commercial-state record appear near the end of this article.
The ICT London Killzone represents a specific intraday observation framework focused on the London market open. In his educational video ICT Forex – The ICT London Killzone, Michael Huddleston outlines how this period may interact with daily market direction, volatility, and the potential formation of session highs or lows. This resource documents the framework for educational study. It does not constitute verified trading performance, statistical backtest validation, or investment advice.
Because the original presentation relies on visual chart examples, this analysis relies on the spoken audio transcript. The transcript validates the theoretical concepts but cannot retrospectively confirm the exact prices, order executions, or subsequent market outcomes displayed in the recording.
What Is the ICT London Killzone Time Window?
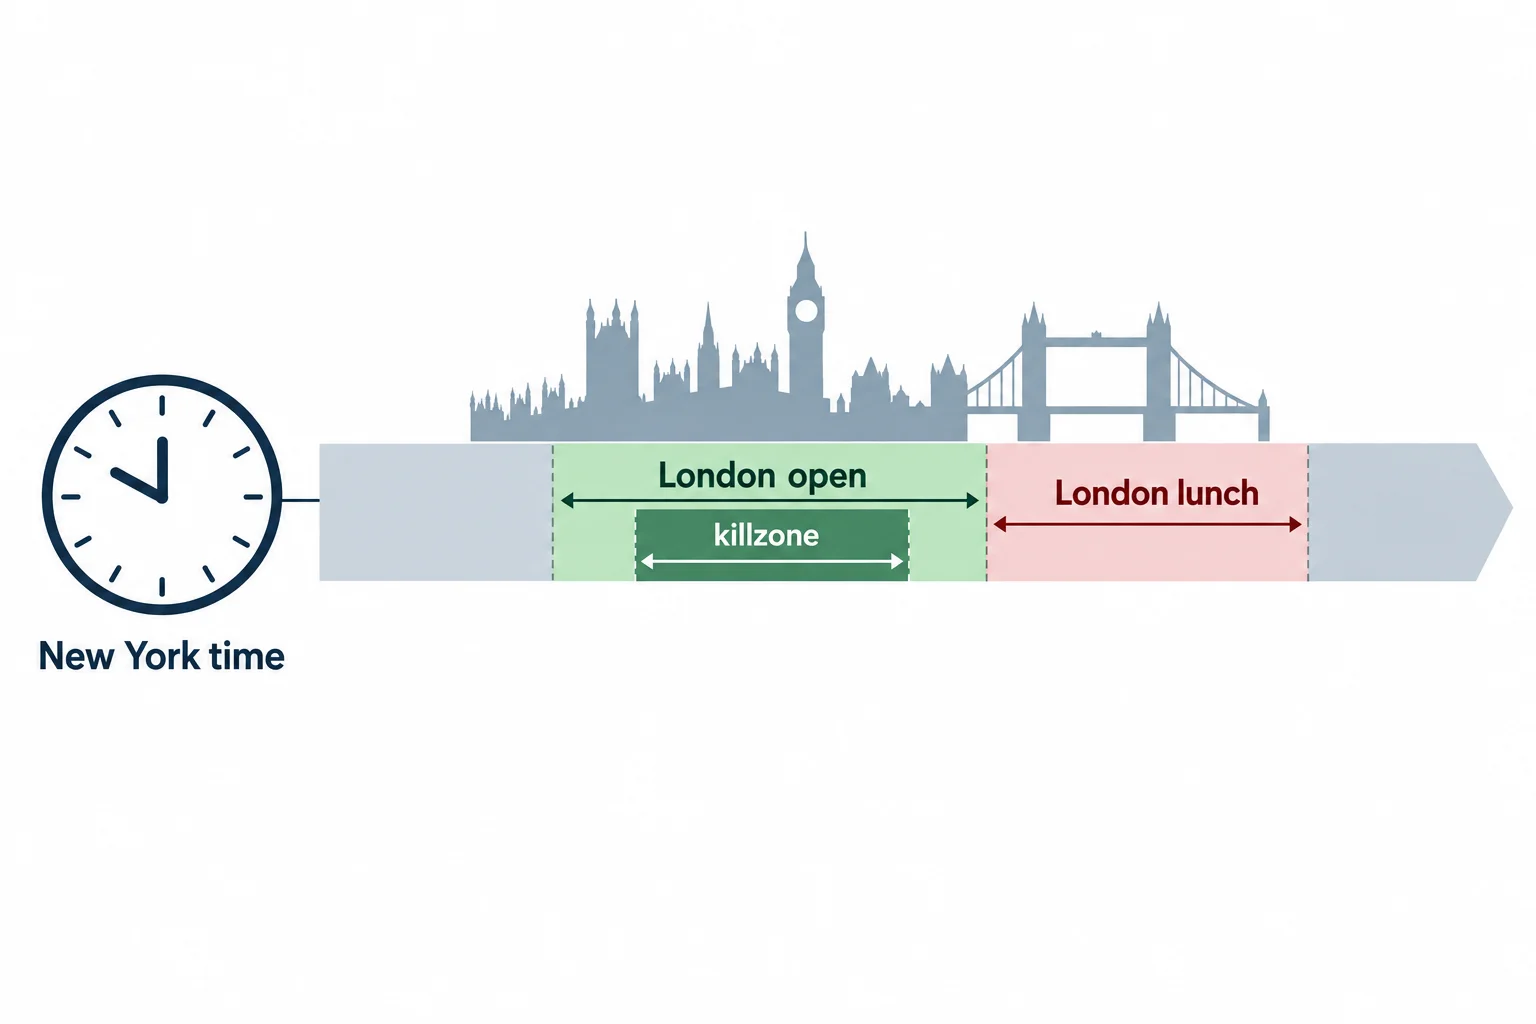
ICT defines the primary observation window as 2:00 a.m. to 5:00 a.m. New York time. He introduces this timeframe at 1:43 and reiterates it at 2:41. This three-hour block corresponds to the London open’s most active period.
Rather than providing static conversions for global time zones, ICT instructs viewers to anchor their local and broker platform clocks to New York time. This approach mitigates errors caused by seasonal daylight-saving changes. For historical chart review, traders require a reliable New York-time reference applicable to the specific date under analysis.
The killzone constitutes a focused subset of the broader London session. ICT notes that London trading activity continues beyond 5:00 a.m., extending into a quieter interval from approximately 5:00 to 7:00 a.m. New York time—often described as London lunch. He indicates that he typically avoids initiating new positions during this phase, as price may consolidate ahead of New York participation (9:29).
How Does Daily Bias Guide the London Killzone?
ICT separates the time window from the directional setup. The framework first requires an assessment of higher-time-frame market conditions, particularly since overnight economic releases can generate substantial pre-London volatility (1:14).
The directional framework operates as follows:
- When higher-time-frame analysis indicates bullish conditions, ICT looks for the London window to establish a low of the day before any directional expansion higher.
- When analysis indicates bearish conditions, he looks for London to form a high of the day before any expansion lower.
- If a decisive move does not materialize during London, the subsequent New York session may produce the meaningful range expansion.
ICT formalizes this relationship near 16:55: seek a London low in primarily bullish markets and a London high in bearish markets. These remain his qualitative observations about session tendencies, not mathematical certainties for every trading day.
What Is the ICT London Killzone Session Profile?
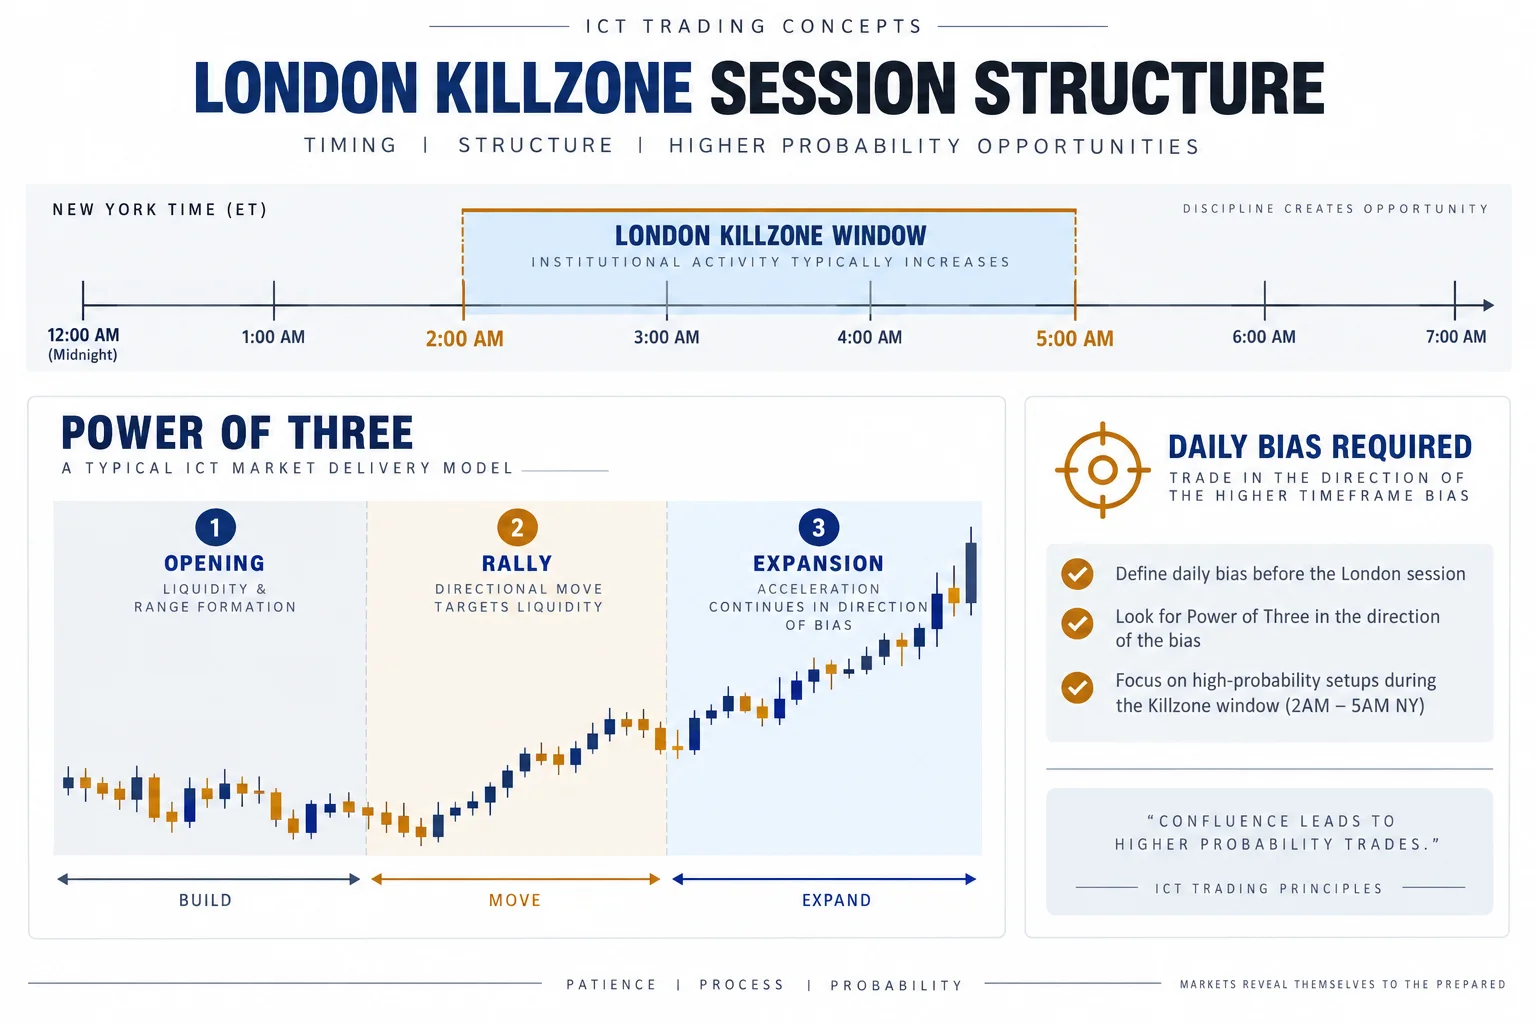
ICT describes a recurring intraday sequence he associates with a “Power of Three” structure. In bearish profiles, the sequence involves an opening phase, a limited counter-trend rally, followed by an expanded decline that closes near the session low. Bullish profiles apply the inverted logic.
He references price as fractal, proposing that structural patterns visible on daily candles may replicate within the London window’s micro-structure (12:09).
Near the conclusion, ICT examines a specific bearish example where price rallies above the opening level during London, surpasses equal highs, and reverses lower. He interprets those equal highs as representing a pool of buy-stop liquidity within his higher-time-frame bearish context (19:14).
How Does Optimal Trade Entry Relate to the London Open?
The lesson introduces the concept of an “optimal trade entry” (OTE) as a potential retracement zone. In a daily-chart example, ICT identifies Fibonacci levels including the 70.5 and 79 levels—relative measurements rather than absolute price points—using these as a non-indicator method to assess overbought or oversold conditions (17:44).
The transcript does not provide exhaustive construction rules for OTE, and the audio source cannot verify the specific chart anchors used in the original demonstration. The documented framework suggests that traders first establish higher-time-frame directional bias, then utilize London-session behavior as a potential execution context. The time window alone does not constitute a complete entry signal.
What Are the ICT London Killzone Risk Considerations?
While ICT characterizes the London open as offering significant directional potential, he emphasizes commensurate risk. High-impact economic releases can render the session extremely volatile, and markets moving forcefully in one direction may provide limited opportunity to exit adverse positions (10:43).
For educational review, a structured study approach involves marking New York midnight, highlighting the 2:00–5:00 a.m. window, documenting pre-analysis directional bias, and observing whether daily extremes formed within the window. Analysts must differentiate between ordinary session behavior and volatility driven by scheduled news releases, accounting for daylight-saving transitions, historical spread conditions, and hindsight bias.
Summary and Limitations
The ICT London Killzone framework combines a specific New York time window with higher-time-frame directional analysis, anticipation of daily highs or lows, liquidity considerations around prior price extremes, and potential range expansion from the opening zone. The content represents Michael Huddleston’s market interpretation and a subject for continued study—not a guarantee of specific setups, exact ranges, or profitability outcomes. No statistical success rates are provided in the source material, and individual results vary based on execution, risk management, and market conditions.
Watch the original lesson
Watch on YouTubeAdditional Resources
For further study of the primary source and related context:
- ICT Forex – The ICT London Killzone (Original Video) — The complete lesson transcript and visual examples referenced in this analysis.
- Inner Circle Trader YouTube Channel — Official archive of ICT educational content, including related sessions on time and price theory.
- Forex Factory Economic Calendar — Schedule of upcoming high-impact economic releases referenced in session volatility discussions.
- Investopedia: Forex Market Hours Overview — General reference for global session timing and overlap characteristics.



