
Key takeaways
ICT’s daily bias framework uses intermediate-term swing highs and lows on the Dollar Index daily chart to assess whether price is in a trending or range-bound model.
Read the full summary
ICT’s daily bias framework uses intermediate-term swing highs and lows on the Dollar Index daily chart to assess whether price is in a trending or range-bound model. When not trending, classic support/resistance applies at obvious turning points. A bullish Dollar Index bias translates to a bearish bias for EUR/USD (mirror image), targeting the prior day’s low; a bearish Dollar Index bias translates to bullish EUR/USD, targeting the prior day’s high. ICT also watches for outside days at turning points as potential short-term reversal signals (citing Larry Williams). The lesson does not guarantee accuracy, provides no statistical back-testing, and presents concepts as a framework for demo practice, not a complete trading system.
How we researched this article
BestProps used document-based research from primary firm sources, checked September 25, 2026. The complete source list, scope, limitations, and commercial-state record appear near the end of this article.
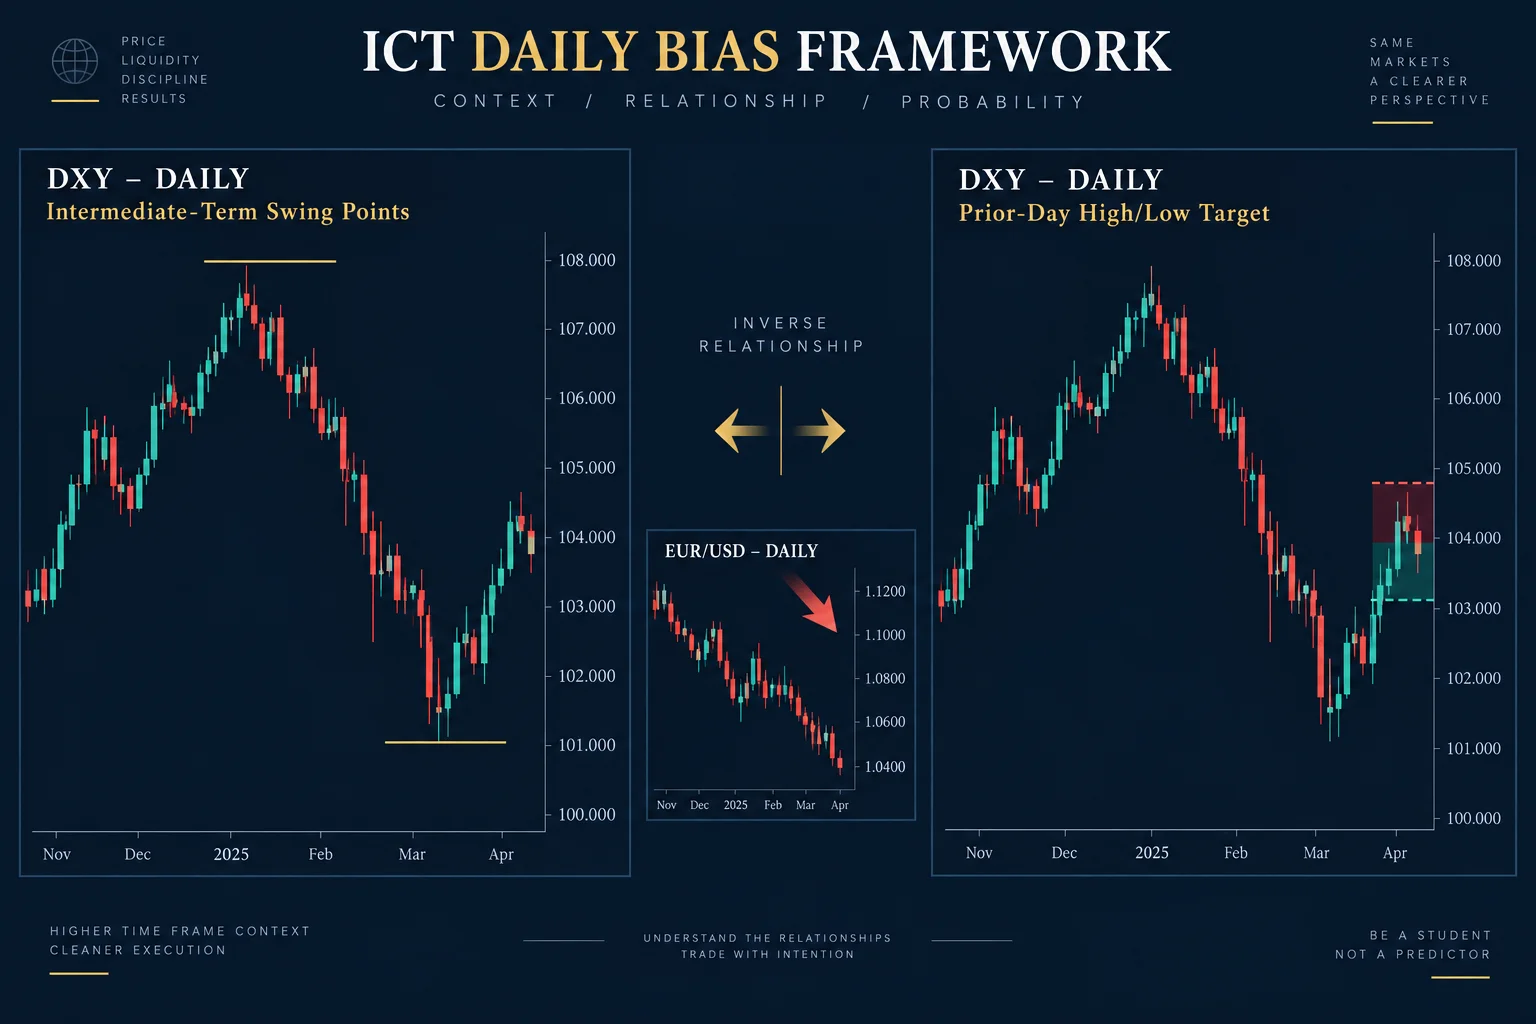
In the video “ICT Daily Bias Using Swing Points and Prior Day Ranges”, ICT walks through how he determines daily directional bias using the Dollar Index (DXY) daily chart and then mirrors that bias to foreign currency pairs such as EUR/USD. He emphasizes that this is an interpretive framework, not a guarantee of results, and should be practiced in a demo account first.
Intermediate-Term Swing Points as the Foundation
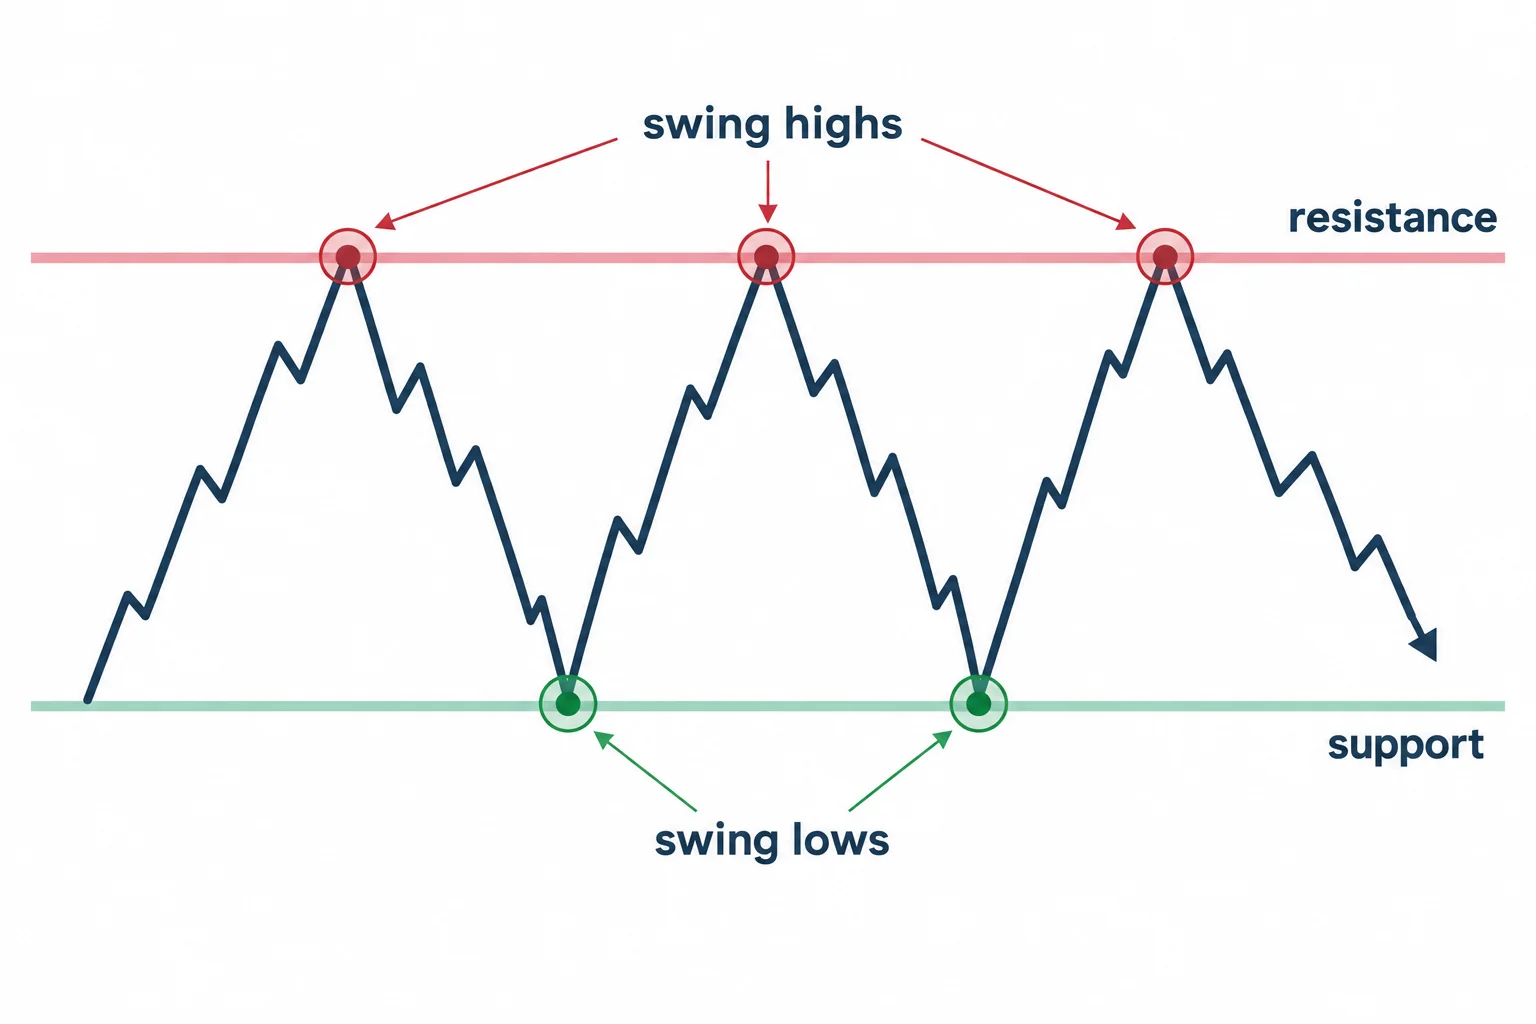
ICT opens at 0:15 by identifying “essentials to trading the daily bias.” At 0:30 he states the goal: ascertain the likelihood of an up-close or down-close day. He immediately cautions at 0:43 that nothing he teaches guarantees accuracy.
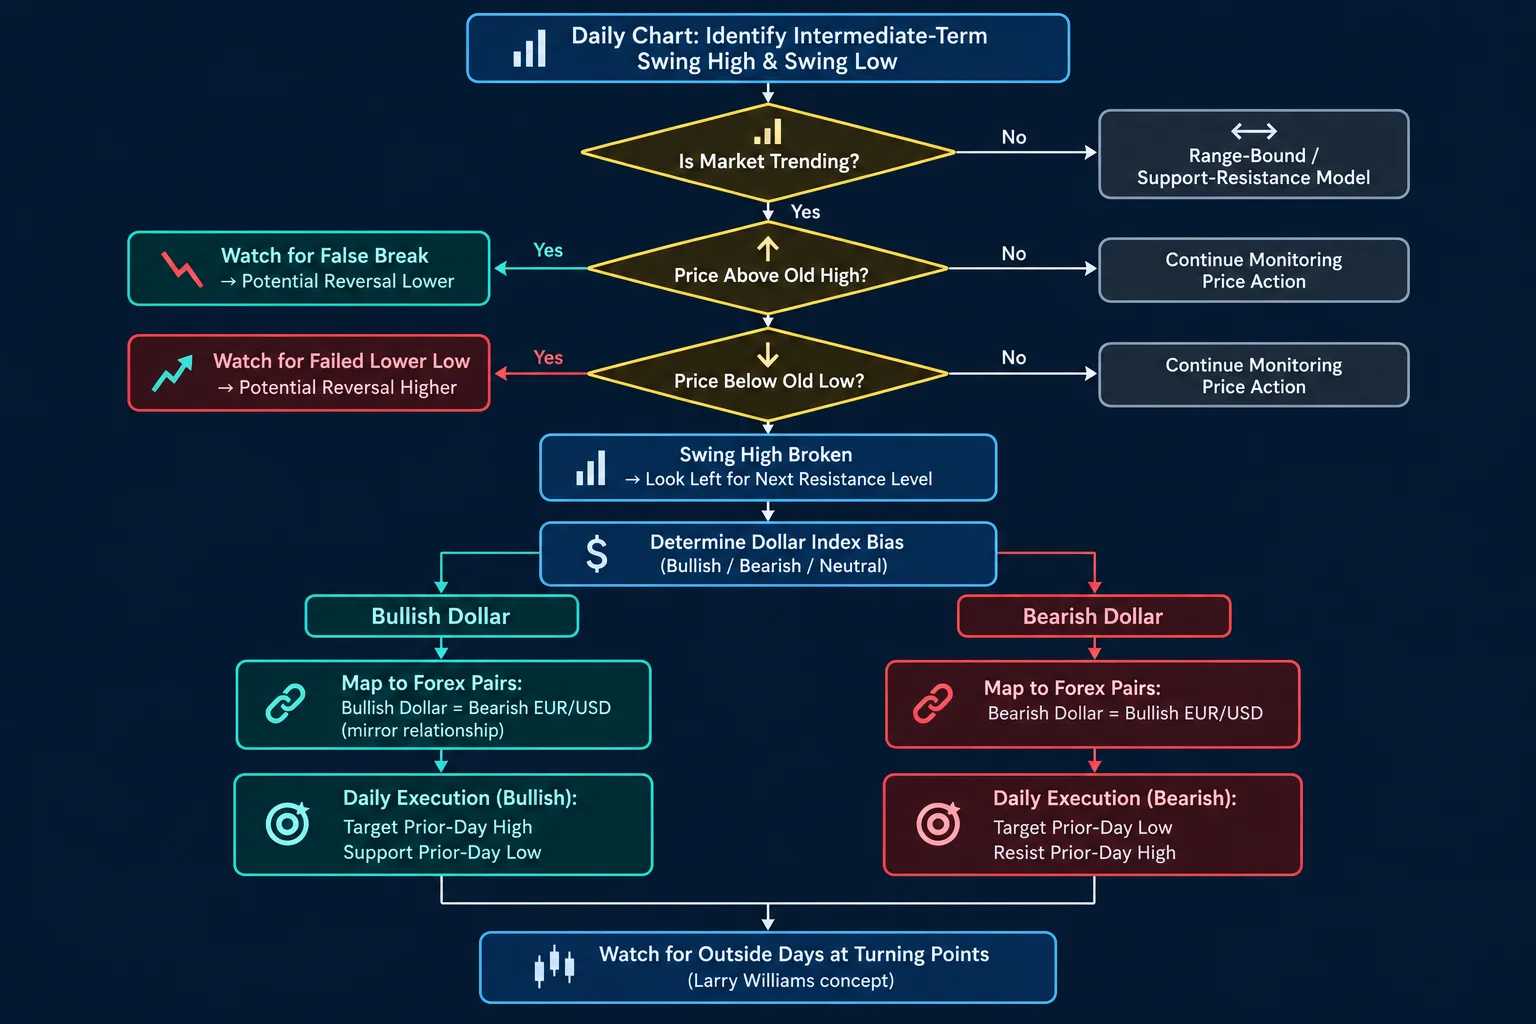
His first structural step, shown around 2:35, is marking intermediate-term swing highs and swing lows on the daily chart. He calls these “key turning points” and uses them as the primary support and resistance levels, rather than every minor high or low. When the market is not in a trending or parabolic move (discussed at 3:55), it operates within a range-bound support/resistance model.
False Breaks of Old Highs and Lows
ICT explains at 3:52–5:07 that when price runs above an old high, it may continue higher but can also reject and trade back below — a false break. The same logic applies to old lows: price may fail to make a lower low and reverse higher. He treats these intermediate-term swing points as potential reversal zones.
At 6:20 he notes that every time the market breaks a swing high, you look left for the next old intermediate-term high as the next resistance target. This “look left” principle guides where price may stall or reverse.
Prior-Day High and Low as Daily Targets
Starting at 8:04, ICT introduces the prior-day candle as the immediate execution framework. In a bullish scenario (Dollar Index context), the prior day’s high becomes the target and the prior day’s low acts as support — price should not trade below it. In a bearish scenario, the roles reverse: the prior day’s low is the target and the prior day’s high is resistance.
At 12:35 he adds that both sides of the prior day’s candle are rarely traded through; when they are, it often signals indecision or an imminent reversal. He illustrates this at 12:59 with an example where both the prior day’s high and low were violated ahead of a reversal.
Dollar Index Bias → Forex Mirror Image
At 15:54, ICT connects the Dollar Index analysis to foreign currencies: a bullish Dollar Index bias implies a bearish bias for EUR/USD (a mirror image), and vice versa. He walks through EUR/USD at 16:07–17:23, showing how each day’s price action targets the prior day’s low when the Dollar is bullish, with repeated “Judas swing” false rallies selling off into the low.
At 18:33 he states the daily bias for the recording date (December 12, 2017) as a move lower below a specific low on EUR/USD, derived from the Dollar Index bullish bias. This is presented as his real-time analytical conclusion, not a verified outcome.
Outside Days at Turning Points (Larry Williams)
Around 13:44–15:15, ICT describes an “outside day” — a day whose range fully engulfs the prior day’s range. An outside day with a down close in a bullish market is typically bullish (false break above prior high, then close on the low), creating a short-term oversold scenario per Larry Williams. An outside day with an up close in a bearish market would be the bearish equivalent. ICT uses outside days at turning points as confidence builders for potential short-term reversals or continuations.
Key ICT Daily Bias Takeaways
- Mark intermediate-term swing highs/lows on the daily chart as primary support/resistance.
- Determine if the market is trending or range-bound; apply classic support/resistance in range-bound conditions.
- Watch for false breaks of old highs/lows as potential reversal signals.
- Use the prior day’s high/low as the immediate daily target and support/resistance level.
- Translate Dollar Index bias to forex pairs as a mirror image (bullish Dollar → bearish EUR/USD).
- Outside days at turning points may signal short-term reversals (Larry Williams concept).
- Nothing guarantees results; practice in demo and treat as a framework, not a system.
ICT’s daily bias framework is a discretionary chart-reading methodology. It combines swing-point identification, range/trend classification, prior-day range targeting, intermarket Dollar Index correlation, and outside-day pattern recognition. The transcript provides illustrative historical examples but no statistical validation, win-rate data, or complete risk-management rules. Traders should study it as an educational framework and test it thoroughly before risking capital.
Watch the full lesson: ICT Daily Bias Using Swing Points and Prior Day Ranges
If the embed does not play, use the link above to watch on YouTube.
Further Reading
- ICT YouTube Channel – Inner Circle Trader (original source)
- Multiple Time Frame Analysis – BabyPips (general education)
- Support and Resistance Basics – Investopedia (general reference)
- Outside Day Definition – Investopedia (general reference)



