
Key takeaways
ICT Forex Market Maker Series Volume 4 applies ICT’s time-and-price framework to GBP/USD for July 26 to 30, 2021, combining weekly directional bias, liquidity objectives, trading days, New York midnight opens and session windows.
Read the full summary
ICT Forex Market Maker Series Volume 4 applies ICT’s time-and-price framework to GBP/USD for July 26 to 30, 2021, combining weekly directional bias, liquidity objectives, trading days, New York midnight opens and session windows. ICT interprets the week as a market maker buy model targeting liquidity above relative equal highs, with the weekly low expected Monday through Wednesday’s New York session in bullish conditions, a stated 70% heuristic unsupported by test data. Monday formed the identified low, Tuesday and Wednesday offered retracements, Thursday formed a short-term high and Friday moved slightly above it before declining. Bullish setups prioritize price near or below the daily midnight open during Monday through Wednesday, particularly in the London kill zone from two a.m. to five a.m. or New York kill zone from seven a.m. to ten a.m. New York time, while a broader New York window runs from eight thirty a.m. to eleven a.m. Entry references include runs below short-term or relatively equal lows, order-block returns and optimal trade entry retracements, without requiring all three together. ICT advises avoiding or reducing exposure around major news such as the Wednesday FOMC release at two p.m., reassessing after the weekly liquidity objective is reached and treating the walkthrough as an educational narrative, not verified market mechanics or a controlled test.
How we researched this article
BestProps used document-based research from primary firm sources, checked September 25, 2026. The complete source list, scope, limitations, and commercial-state record appear near the end of this article.
Volume 4 of ICT’s five-part Forex Market Maker Series applies his time-and-price framework to GBP/USD during the trading week of July 26–30, 2021. Using hourly and 15-minute chart views, ICT explains how he combines a weekly directional bias, the day of the week, session windows, daily opening prices and anticipated liquidity targets.
This article summarizes the lesson as presented in the primary video. Terms such as “market maker buy model,” “smart money,” “algorithm” and “kill zone” belong to ICT’s own market interpretation; the transcript does not independently establish those ideas as proven market mechanics.
ICT Market Bias and Weekly Price Direction
ICT begins by treating earlier installments as prerequisites. At 1:28, he recaps his premise: daily sell stops had been cleared, an “SMT divergence” had appeared, and he interpreted GBP/USD as operating within a market maker buy model. From that premise, his target was liquidity above relative equal highs and an earlier consolidation.
The key point is methodological. ICT does not begin with an isolated intraday pattern. He first selects a weekly bias and a prospective price objective, then asks when a retracement or stop run might offer alignment with that scenario.
ICT Time and Price Expectations by Trading Day
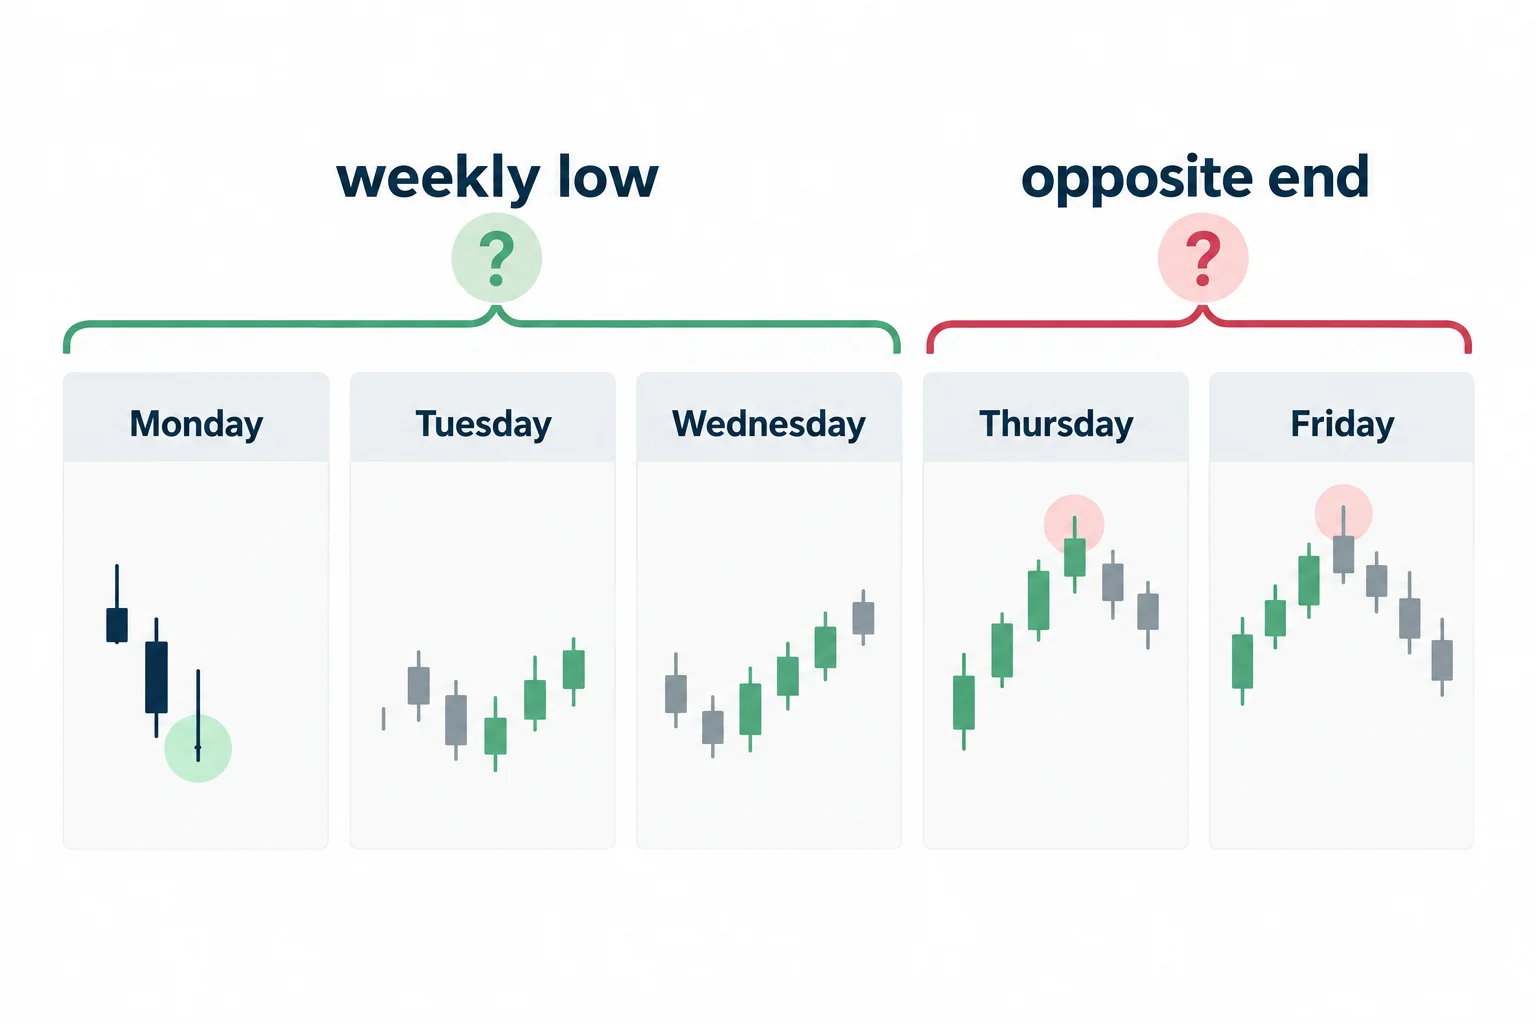
At 3:15, ICT divides the weekly range conceptually into five trading days. For a bullish week, he says he expects the weekly low to form on Monday, Tuesday or by Wednesday’s New York session. He gives a 70% figure, but the video does not provide the dataset or test behind that statistic, so it should be understood as ICT’s stated heuristic rather than a verified probability.
His walkthrough characterizes the example week as follows:
- Monday opened the week and produced what he identified as its low.
- Tuesday and Wednesday supplied retracements that he interpreted as potential buying opportunities.
- Thursday formed a short-term weekly high.
- Friday moved slightly above Thursday’s high before declining from that area.
ICT consequently emphasizes Monday through Wednesday for seeking bullish setups. At 7:00, he says Thursday and Friday more often help form the opposite end of the weekly range in this model. He also acknowledges that markets can continue sharply higher late in the week, meaning this is a filtering rule rather than a guarantee.
ICT Price Levels at New York Midnight
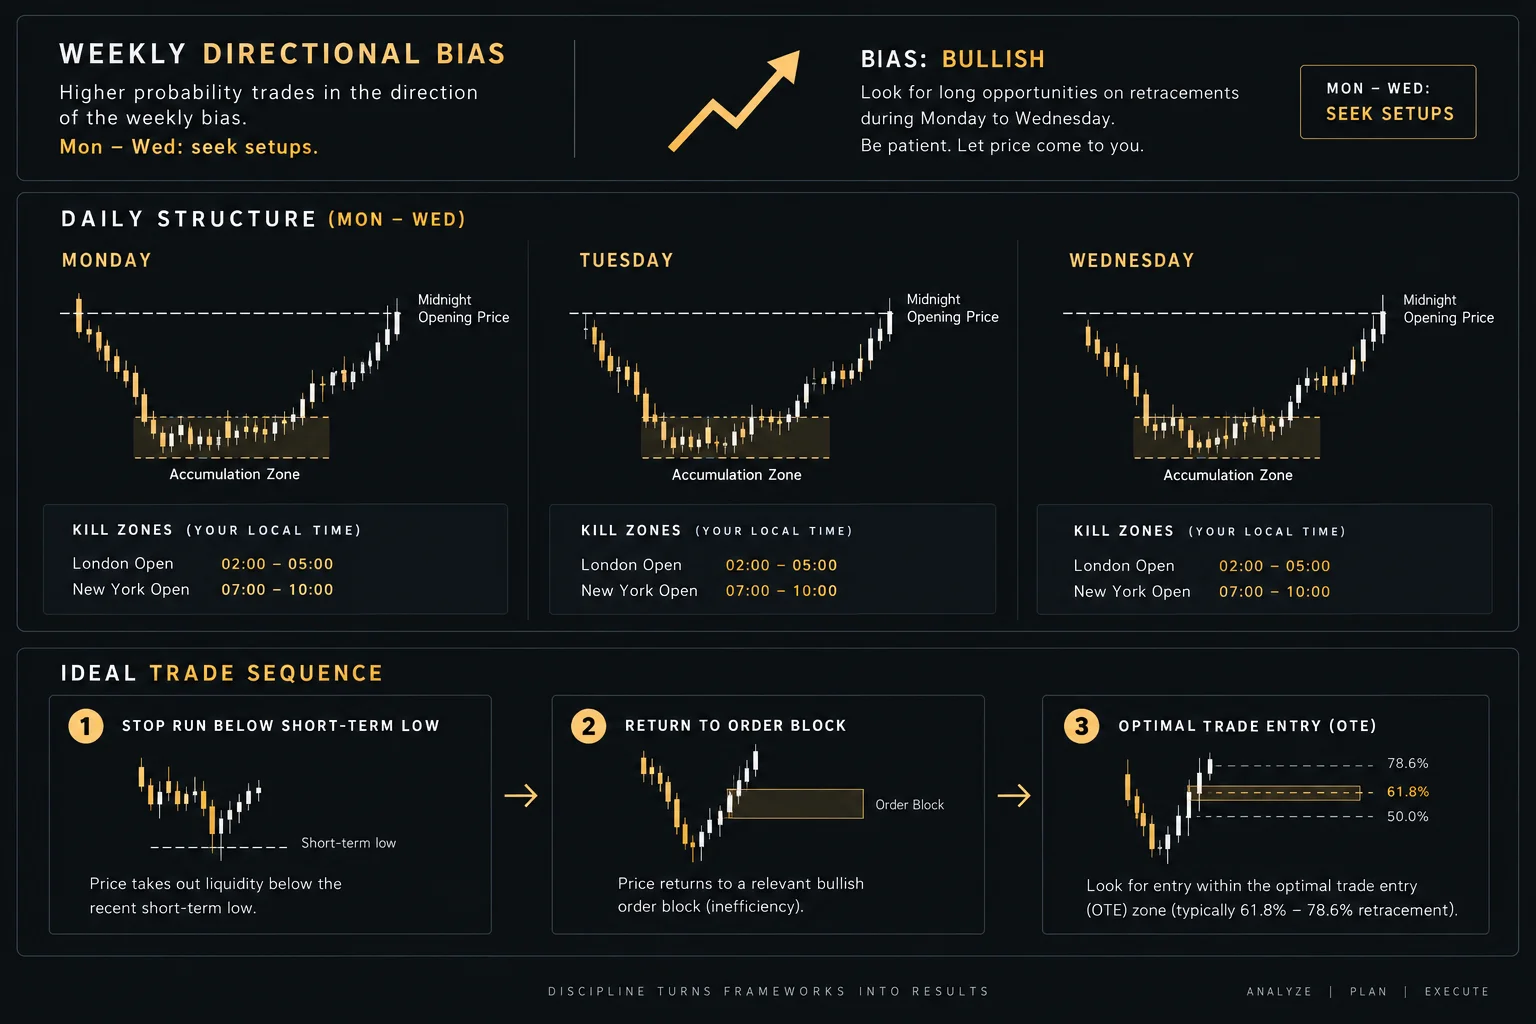
ICT marks each day at midnight New York time and extends that day’s opening price through the active morning sessions. The chart setting matters because all of his session references use New York local time. His bullish-week template is to look for price at, near or below the midnight opening price during the first three days of the week.
As explained around 10:13, the Wednesday example included a sharp FOMC-related move below a short-term low before price moved higher. The transcript supports the described sequence, but it cannot verify the chart’s exact levels, any orders or the later outcome independently of the speaker’s narration.
ICT Kill Zones for Time and Price Setups
The 15-minute discussion adds specific session windows. At 13:13, ICT defines the London “kill zone” as 2:00–5:00 a.m. New York time and the New York kill zone as 7:00–10:00 a.m. He separately describes a broader New York session window of 8:30–11:00 a.m.
Within his framework, a low being breached is not sufficient by itself. The event should occur at a relevant time, on an appropriate day and in agreement with the expected weekly direction. He contrasts those windows with periods after London close that he characterizes as more prone to consolidation. At 16:40, he explicitly rejects the idea that every sweep below visible lows has equal significance.
Three ICT Price References
Once time and bias align, ICT identifies three price-based references:
- A run below short-term or relatively equal lows when the bias is bullish.
- A return to what he calls an order block.
- A retracement into an “optimal trade entry,” abbreviated OTE.
At 22:19, he explains that all three do not need to appear together. A student might instead define a narrower model (for example, waiting for a Tuesday or Wednesday London-session move below a prior short-term low when the broader premise remains bullish).
ICT Market News and Price Risk Limits
The example week contained a Wednesday FOMC release at 2:00 p.m. New York time. ICT treats it as an exceptional volatility event rather than an ordinary session pattern. At 15:41, he cautions developing students against trading FOMC volatility, suggesting that they observe it instead because rapid whipsaws can create confusion and stop-outs.
He also advises checking the economic calendar and either remaining out of the market or reducing exposure before major scheduled events. These are the speaker’s general risk-management comments, not personalized investment advice.
How the ICT Time and Price Framework Works
The practical sequence taught in this volume is:
- Form a directional weekly hypothesis and identify a prospective liquidity objective.
- Prioritize Monday, Tuesday and Wednesday for setups aligned with that hypothesis.
- Mark midnight New York time and the daily opening price.
- Focus on the London or New York windows rather than treating every intraday pattern equally.
- Look for a stop run, order-block return or OTE in the expected direction.
- Reassess if the weekly objective has already been reached, since consolidation may follow.
Near 24:44, ICT describes this as building a narrative and then observing whether price continues to conform to it. That is the central educational takeaway: time supplies the context, while price supplies the location. The video presents one historical walkthrough, not a controlled test, and viewers would need independent chart study to evaluate how consistently these ideas apply.
More ICT Forex Market Maker Resources
- ICT Forex Market Maker Series Volume 4 the primary source video on the Inner Circle Trader YouTube channel.
- Inner Circle Trader YouTube channel the official channel for ICT’s free educational series on price action and market structure.
- BabyPips School of Pipsology a free introductory curriculum for forex mechanics and risk management.
- CFTC Consumer Protection Education Center U.S. regulator resources on trading risks and fraud prevention.
The third-party links above are provided for educational context; their inclusion does not constitute an endorsement of any specific trading methodology or a guarantee of results.




