
Key takeaways
ICT Forex Market Maker Series Vol.
Read the full summary
ICT Forex Market Maker Series Vol. 3 of 5 presents two mirrored, subjective roadmaps for price swings, a market maker buy model that targets a higher-timeframe low before reversing toward prior highs and buy stops, and a sell model that targets a key high before declining through staged expansions and retracements. Analysis starts with monthly, weekly and daily levels, with four-hour levels secondary, then examines consolidations, bullish or bearish breakers, order blocks, optimal trade entry patterns and compact reversal structures. Potential lows include a lower low followed by a break above a short-term high or a higher low confirmed by SMT divergence, while potential tops invert those formations. SMT means smart money technique or smart money tool and is strictly a confirmation tool, not a timing tool, illustrated by EUR/USD making a higher low while GBP/USD makes a lower low, or the US Dollar Index making a higher high while GBP/USD fails to make the inversely expected lower low. Consolidation is timeframe-relative, with roughly 10 candles on a 15-minute chart potentially appearing as only 1 or 2 four-hour candles, not a fixed rule. The GBP/USD example moves from daily relative equal lows and sell stops below them toward relative equal highs, but no verified prices, fills, costs, slippage, sizing, risk statistics or performance record are provided, and ICT acknowledges setups can fail and stop traders out.
How we researched this article
BestProps used document-based research from primary firm sources, checked September 25, 2026. The complete source list, scope, limitations, and commercial-state record appear near the end of this article.
In ICT Forex – Market Maker Series Vol. 3 of 5, ICT presents a framework for studying price swings through higher-timeframe levels, staged consolidations, reversal structures and intermarket divergence. The lesson develops two mirrored roadmaps: a “market maker buy model” and a “market maker sell model.” These are ICT’s interpretations of market behavior, not independently established mechanisms or guarantees of an edge.
ICT Forex Structure Starts With Higher Timeframe Levels
ICT opens the lesson by assuming that broader analysis has already produced a directional expectation. At 0:46, he illustrates a market expected to decline toward a key low before reacting upward. He describes potential reference points such as weekly lows, prior higher-timeframe highs and the boundaries of an older trading range.
His hierarchy places the greatest emphasis on monthly, weekly and daily charts, with the four-hour chart treated as less significant. The practical point is that the model does not begin with a lower-timeframe entry signal. It begins with a proposed destination and then asks how the intervening price swing might develop.
ICT also distinguishes between trading with the anticipated swing and taking shorter countertrend trades. Although he discusses leverage and position emphasis, the transcript supplies no account details, verified fills or risk statistics. Those remarks should therefore be understood as the speaker’s trading perspective rather than actionable sizing guidance.
ICT Market Maker Buy Model Structure
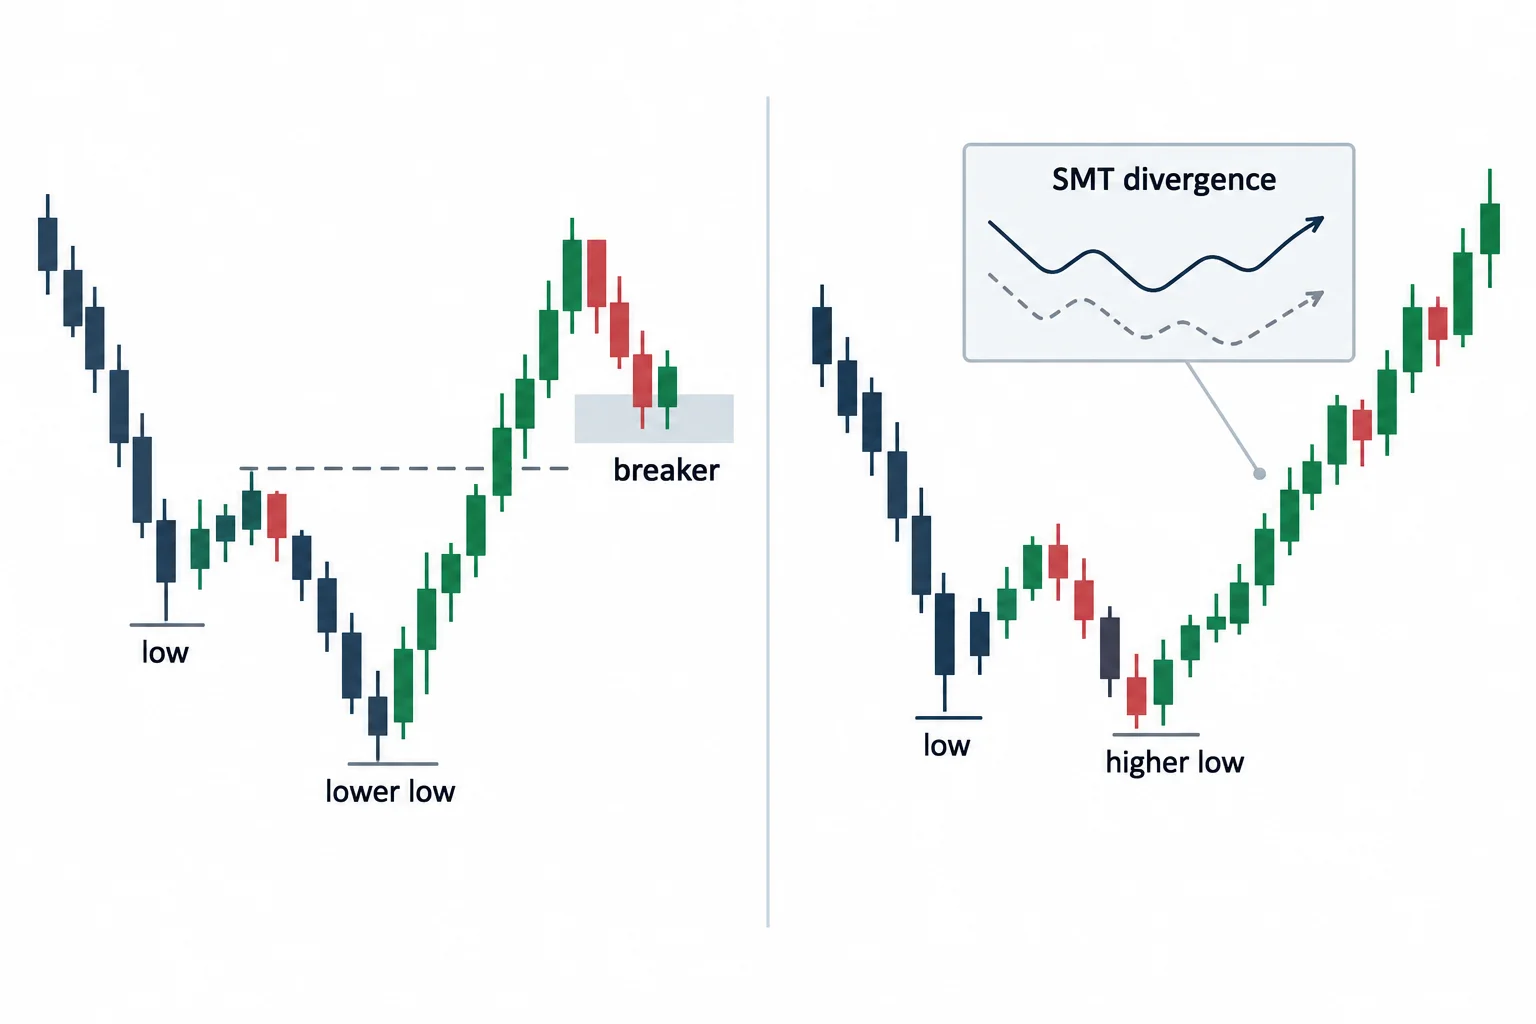
At 4:16, ICT begins assembling the buy model: price declines toward a key level and then turns higher. He identifies two possible low formations:
- A low followed by a lower low, after which price breaks an intervening short-term high. ICT calls a subsequent return toward that structure a potential bullish “breaker.”
- A low followed by a higher low. ICT says he prefers this version when a related market provides what he calls SMT divergence.
The larger decline is divided into phases. An initial consolidation gives way to lower prices, followed by one or more shorter pauses or retracements. ICT says these intermediate areas may contain his “optimal trade entry” pattern, a bearish order block or a sweep of a short-term high before another decline. These specialized labels belong to ICT’s methodology and are not defined by objective tests in this transcript.
Once the anticipated low is reached, ICT looks for a compact reversal area rather than a prolonged, flat base. From there, the buy-model roadmap calls for an advance through additional consolidation zones and ultimately toward buy stops above prior highs or the original consolidation. His discussion of “accumulation,” “distribution” and algorithmic price delivery is a conceptual interpretation; the transcript does not provide order-book evidence proving who held particular positions.
ICT Market Maker Sell Model Structure
At 18:30, ICT reverses the framework. In the sell model, price begins below a proposed key high, rallies toward it and is then expected to decline. The key high might be an older high or another monthly, weekly, daily or, secondarily, four-hour reference.
The proposed top can form as a high followed by a higher high and a breakdown, or as a high followed by a failed higher high. For the latter case, ICT again wants confirmation from a correlated market. After the reversal, his roadmap looks for successive downward expansions, retracements and possible bearish entry structures.
ICT acknowledges at 24:53 that an apparent setup can fail and stop out a trader. He describes one possible re-entry technique using a sell stop below a short-term low, but this is a risky execution idea rather than a validated rule. No costs, slippage, position sizing or complete performance record are supplied.
ICT Forex Consolidation Across Market Timeframes
A recurring qualification is that consolidation is relative. Beginning around 7:33, ICT explains that a range visible across many five- or 15-minute candles might appear as only one or two candles on a four-hour chart. He gives roughly ten candles as a possible 15-minute example but explicitly presents this as a rough illustration, not a fixed definition.
This subjectivity matters. The model cannot be reproduced merely by counting a universal number of candles. ICT instead urges viewers to review historical swings across multiple timeframes and learn how the smaller formations sit inside the higher-timeframe move.
ICT Forex SMT Divergence Confirmation
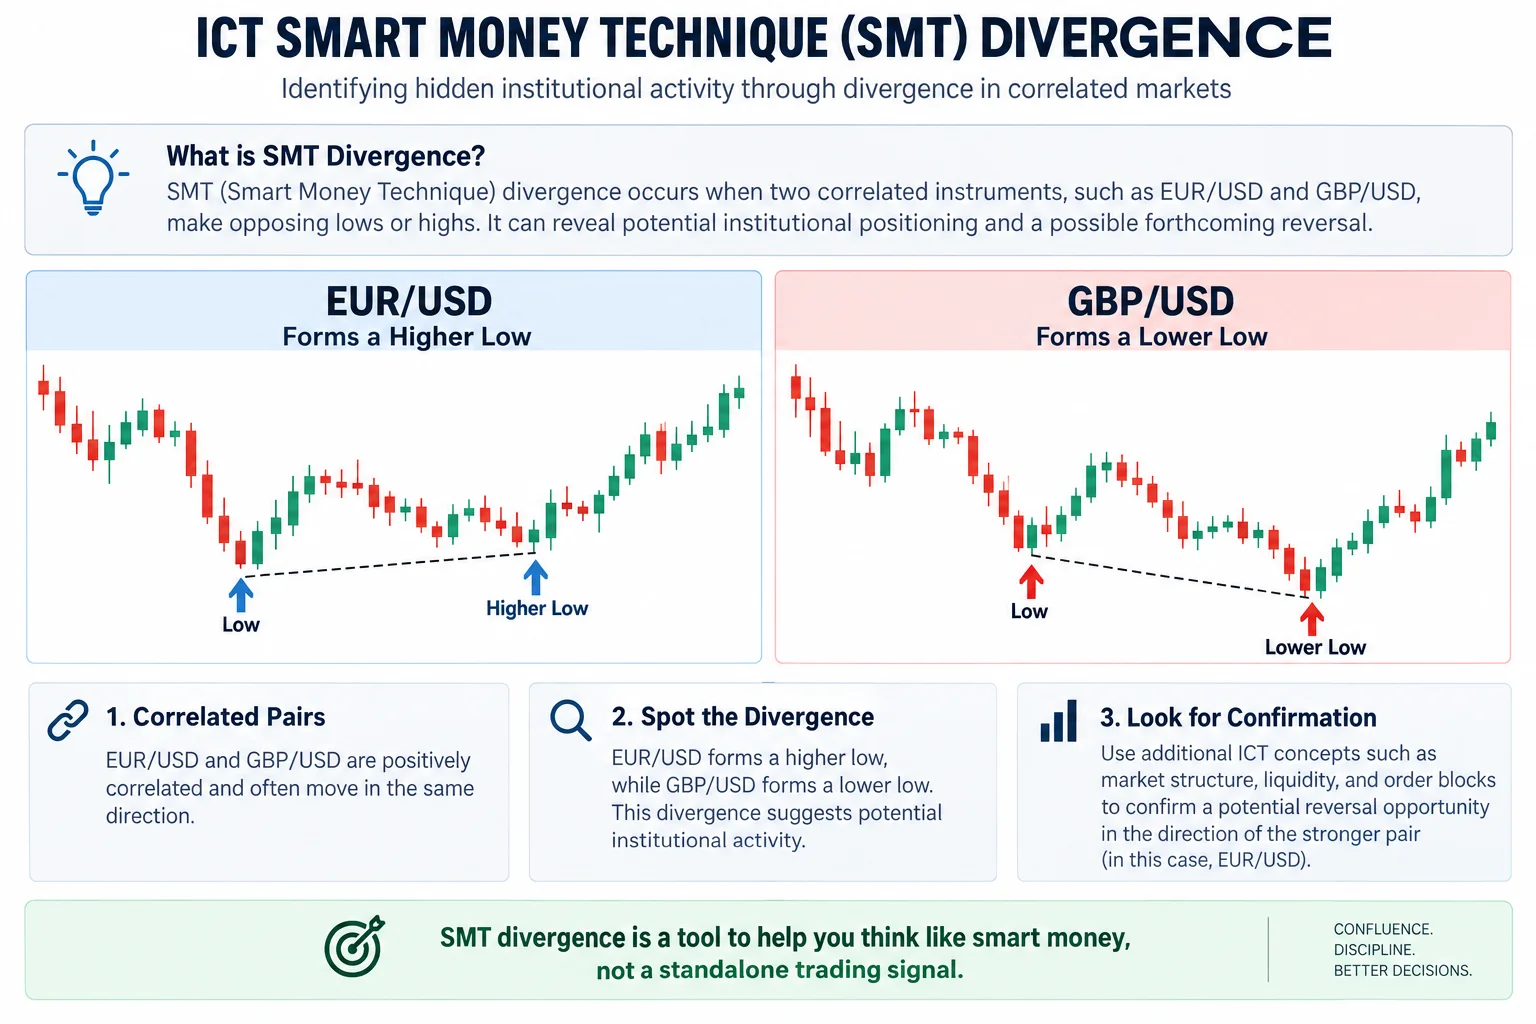
ICT defines SMT as either “smart money technique” or “smart money tool,” noting that he never settled on a single expansion of the letter T. At 5:38, he gives a correlated-pair example: EUR/USD forms a higher low while GBP/USD forms a lower low. He interprets that break in correlation as evidence supporting a potential upward turn.
Later, he compares GBP/USD with the US Dollar Index. In the example discussed from 34:54, the dollar index makes a higher high while pound-dollar does not make the inversely expected lower low. ICT treats this mismatch as confirmation of an existing bullish narrative for GBP/USD.
His central restriction is especially important: at 37:42, ICT says SMT is a confirmation tool, not a timing tool. In his framework, traders should not scan indiscriminately for mismatched highs and lows. A divergence is considered relevant only near a previously identified level and within an established directional narrative.
What the ICT Forex Chart Example Shows
Near 27:09, ICT applies the framework to GBP/USD, discussing daily relative equal lows, sell stops below them and relative equal highs as a later objective. He says the market moved from the low-side area toward the highs during the week being reviewed. Because the source is an audio transcript without verified chart inspection, exact prices, chart annotations and trade executions cannot be confirmed here.
The educational takeaway is a sequence rather than a standalone signal: identify a higher-timeframe destination, study how price leaves and revisits consolidations, watch for one of the proposed reversal structures, and use related markets only as contextual confirmation. Historical chart review may help a learner understand the terminology, but it does not establish profitability or predict future outcomes.
Resources
- Primary source: ICT Forex – Market Maker Series Vol. 3 of 5 (YouTube) — full video with the timestamped sections referenced throughout this article.
- SMT divergence definition with EUR/USD higher low vs GBP/USD lower low (5:38) — correlated-pair divergence used to confirm a potential turn.
- Why ICT treats SMT as confirmation, not a timing tool (37:42) — the central restriction on when a mismatch is relevant.
- TradingView — charting platform commonly used to review historical swings across timeframes (unofficial third-party tool; not independently tested by BestProps).



