
Key takeaways
The ICT 2025 Lecture Series NQ May 01, 2025 Review connects a bullish daily-chart thesis with a London-low liquidity sweep, a morning inversion fair value gap, and higher-time-frame objectives. ICT then discusses alternative entry concepts and an afternoon reversal. These are his narrated interpretations and reported trades, not independently verified market causation or performance.[1]
How we researched this article
BestProps used document-based research from primary firm sources, checked September 24, 2026. The complete source list, scope, limitations, and commercial-state record appear near the end of this article.
ICT opens by identifying the session as Thursday, May 1, 2025, and reviewing that day’s Nasdaq action. He asks viewers to watch his April 30 analysis first. The earlier recording is context, not a reason to relabel this as an April 30 review. See 0:34–1:23.[1]
Source method: This article was checked against a timestamped automatic transcription of the original audio, not human-verified captions or a visual inspection of the charts. Specialized terms were normalized only where repeated context supported them. Exact quoted market prices are omitted because spoken-number recognition is uneven. The narration cannot establish order fills, account type, net results, or whether the referenced X posts were issued before the moves.
Daily-chart context: wicks and a volume imbalance
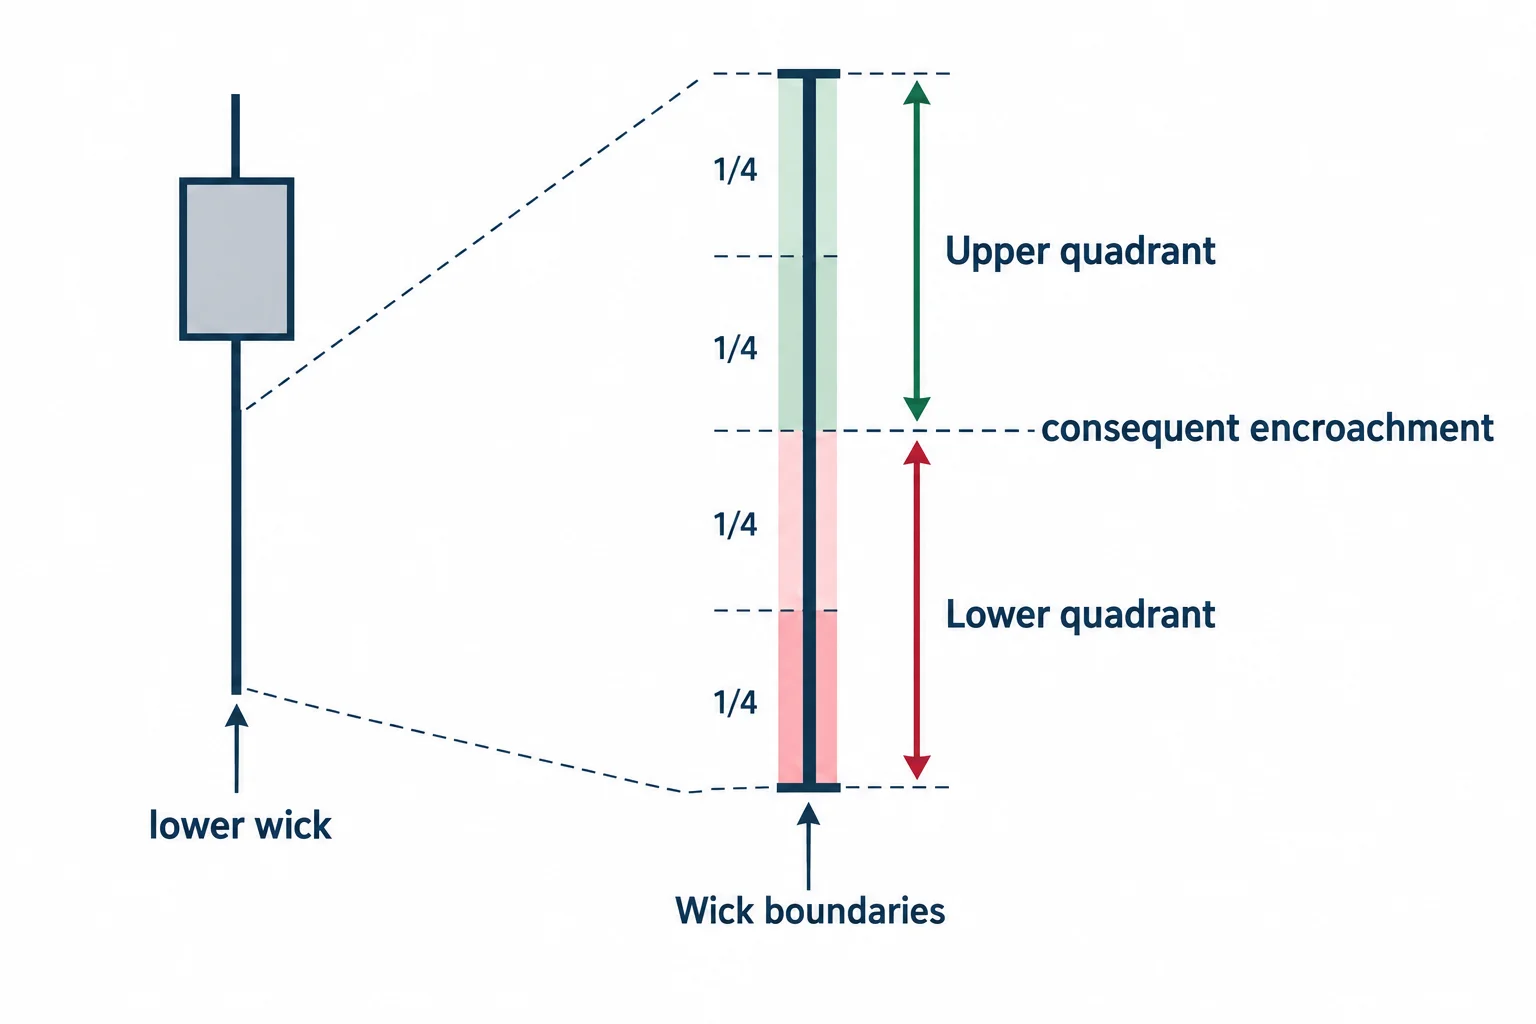
At 1:28–3:44, ICT moves through a daily candle’s wick, its lower and upper quadrants, and consequent encroachment. He treats wicks like gaps that can be divided into reference levels. Later, when explaining a lower wick, he explicitly identifies consequent encroachment as its midpoint. His daily references include an April 2 wick high and a daily volume imbalance that he identifies as March 27.[1]
He also acknowledges uncertainty about whether he mentioned one of the wick-midpoint references in the previous night’s recording. His account therefore should not be flattened into a claim that every level was demonstrably announced in advance. He describes the day’s move into the volume imbalance and toward another wick midpoint; those are descriptions from the speaker, not chart observations made for this article.[1]
His directional premise is explicitly personal. At 4:37–6:28, he says he was bullish, while telling viewers that this does not mean they should be bullish or trade on his opinion. In that framework, a drop below an old low could precede a move toward higher objectives rather than automatically invalidate the bullish thesis.[1]
London liquidity and the morning inversion fair value gap
At 6:58–7:50, ICT describes a one-minute chart with the London-session low, an initial buy-side objective, and the first presented fair value gap of the 9:30–10:00 a.m. Eastern opening range. He identifies the gap with the 9:38 candle and says he expected it to function as an inversion rather than a conventional area from which to sell.[1]
At 7:50–9:49, he discusses a 10 a.m. ISM manufacturing release and narrates this sequence: price stopped short of the initial buy-side objective, swept below the London low, rallied through the morning gap after the news, and returned into it before moving higher. He interprets the pullback’s behavior as validation of the inversion fair value gap. The news timing and sequence here are attributed to the lecture, not independently reconstructed from historical market data.[1]
The important distinction is between identifying a candidate gap and waiting for the behavior ICT considers confirmation. He revisits that distinction at 16:12–17:09: the first return is not sufficient in his account, and he emphasizes waiting for a subsequent move above the gap and a return that is followed by expansion. His explanation of orders and an algorithm driving these movements remains his market interpretation.[1]
Objectives and alternatives after a missed entry
At 9:55–11:17, ICT distinguishes the nearby buy-side liquidity pool from the more ambitious daily volume-imbalance objective. He describes the latter’s high as his preferred exit area. At 11:21, he then addresses a practical problem: a trader can watch attentively and still miss the preferred entry.[1]
Algorithmic “gray pool”
At 12:14–13:27, he marks the midpoints of selected lower candle wicks and projects them forward, calling the resulting area an algorithmic “gray pool.” He subsequently reports entering near its lower edge and exiting at the daily volume imbalance’s high. That is a reported trade description; it does not verify a fill, account record, or profitability.[1]
Immediate rebalance and a bullish order block
At 17:22–18:27, ICT offers two alternatives. His immediate-rebalance example involves a rally through a candle’s high and a return to that high on the next candle; he expects prompt continuation under his rules. He also identifies two consecutive down-close candles as a possible bullish order block. These are examples within his framework, not evidence that either pattern reliably produces a profit.[1]
He notes that a preferred model may simply not offer an entry on a particular move. He also warns inexperienced viewers about trading around the Thursday and Friday associated with nonfarm payrolls. See 18:34–19:11. Missing a move is not a reason to invent an entry afterward.[1] The final sentence is an editorial study principle, not a claim about any viewer’s results.
Why the selected range matters for premium and discount
At 19:47–21:17, ICT answers whether the later gray-pool entry was chasing price. He frames a range from the inversion gap to the intended daily volume-imbalance objective, then divides it at 50%. He says his entry was below that midpoint and therefore in discount within that selected range.[1]
The study point is that “discount” is relative to the chosen anchors, not a label that applies merely because price has fallen or is below an arbitrary line. Record the anchors and reasoning before evaluating an example. This is an editorial method for reviewing his explanation, not independent validation of the entry.
The afternoon did not preserve the morning narrative indefinitely
In the closing section, ICT describes repeated interactions with the earlier gap, buy-side reference, and daily levels. At 23:29–24:03, he narrates a decline through the morning gap and below the London low, followed by a move toward the midpoint of the April 2 daily wick. His review thus includes an afternoon breakdown after the earlier bullish move, rather than a one-directional session story.[1]
A practical study workflow
The following is BestProps’ editorial workflow for studying a recorded trading lesson, not a six-step trading system attributed to ICT. Watch once without trading, log timestamps alongside the claims they support, clarify unfamiliar terms, and revisit the historical examples. If testing a defined idea, use a non-live environment and record failures as well as favorable cases. Check applicable platform and account rules before testing or taking any action; the numbered graphic is a study aid, not a mandatory operational order.
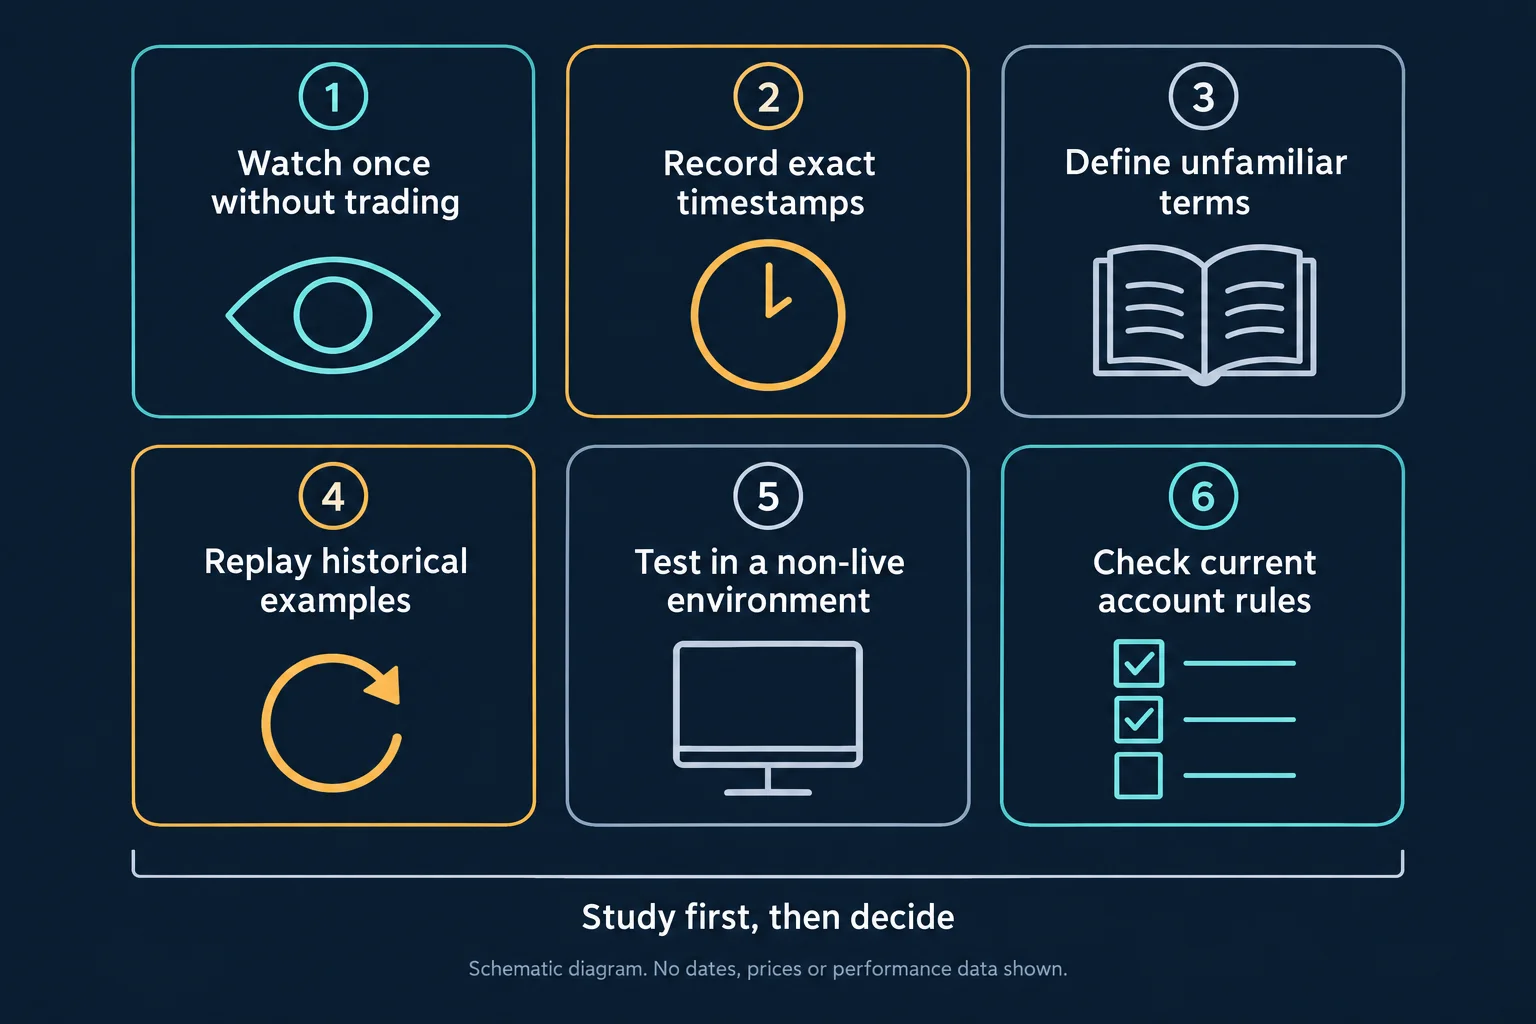
Open the study checklist at full resolution. The paragraph above provides the checklist in readable text.
For publisher-provided study links, ICT’s official home page links to his YouTube library and mentorship content.[2] For instrument background, CME’s E-mini Nasdaq-100 overview lists NQ as its CME Globex product code and provides contract information; it does not authenticate the lecture’s narrated trades.[3]
Watch the original May 1 review
The Inner Circle Trader: 2025 Lecture Series – NQ May 01, 2025 Review
Watch the original recording on YouTube
The timestamp links above open the relevant passages in the original recording.
Risk note: This is educational commentary, not investment advice or a recommendation to copy a reported trade. The lecture and these study notes do not establish a strategy’s reliability or anyone’s future returns.



