
Key takeaways
2022 ICT Mentorship Episode 40 is a trading lesson using USD/CAD and the September 2022 E-mini S&P contract to explain daily bias, liquidity, fair value gaps, economic-calendar filtering and intermarket context.
Read the full summary
2022 ICT Mentorship Episode 40 is a trading lesson using USD/CAD and the September 2022 E-mini S&P contract to explain daily bias, liquidity, fair value gaps, economic-calendar filtering and intermarket context. ICT starts with weekly objectives such as old highs, old lows or imbalances, then moves through daily, four-hour, hourly and intraday charts, favoring sessions where higher-time-frame direction, a medium- or high-impact event and a defined-window setup align. In USD/CAD, he forms a bearish view from a three-candle swing high near an earlier high while noting a prior down-close daily candle as a bullish order block that could impede the decline. After the Canadian retail-sales release at 8 30 a.m. New York time, price takes buy-side liquidity above a short-term high, breaks a nearby low with bearish displacement, leaves a fair value gap and targets relative equal lows as sell-side liquidity. He recommends observing news reactions in a demo account and controlling risk through position sizing rather than rejecting setups solely because of wider stops. In the E-mini S&P example, an overnight run below a prior low, bullish market-structure shift and retracement into discount support a New York-session move toward relative equal highs and an hourly fair value gap in premium. Bearish USD/CAD conditions provide contextual support for a risk-on S&P view, not a fixed correlation. The core lesson is to avoid forcing daily predictions, wait for aligned conditions, journal observations and treat the examples as discretionary retrospective interpretations rather than verified rules or guaranteed signals.
How we researched this article
BestProps used document-based research from primary firm sources, checked September 19, 2026. The complete source list, scope, limitations, and commercial-state record appear near the end of this article.
2022 ICT Mentorship Episode 40, uploaded June 22, 2022, combines a USD/CAD review with an E-mini S&P futures example. ICT uses the two markets to explain his approach to daily bias, economic-calendar filtering, liquidity, fair value gaps and intermarket context.
The central lesson is not that a trader should predict every daily candle. ICT instead argues for selecting sessions in which several conditions align: a plausible higher-time-frame objective, a medium- or high-impact calendar event, and an intraday setup during a defined trading window. The examples represent ICT’s interpretation of the displayed charts; the transcript alone does not independently verify the chart markings, orders or later outcomes.
2022 ICT Episode 40 USD CAD News Setup
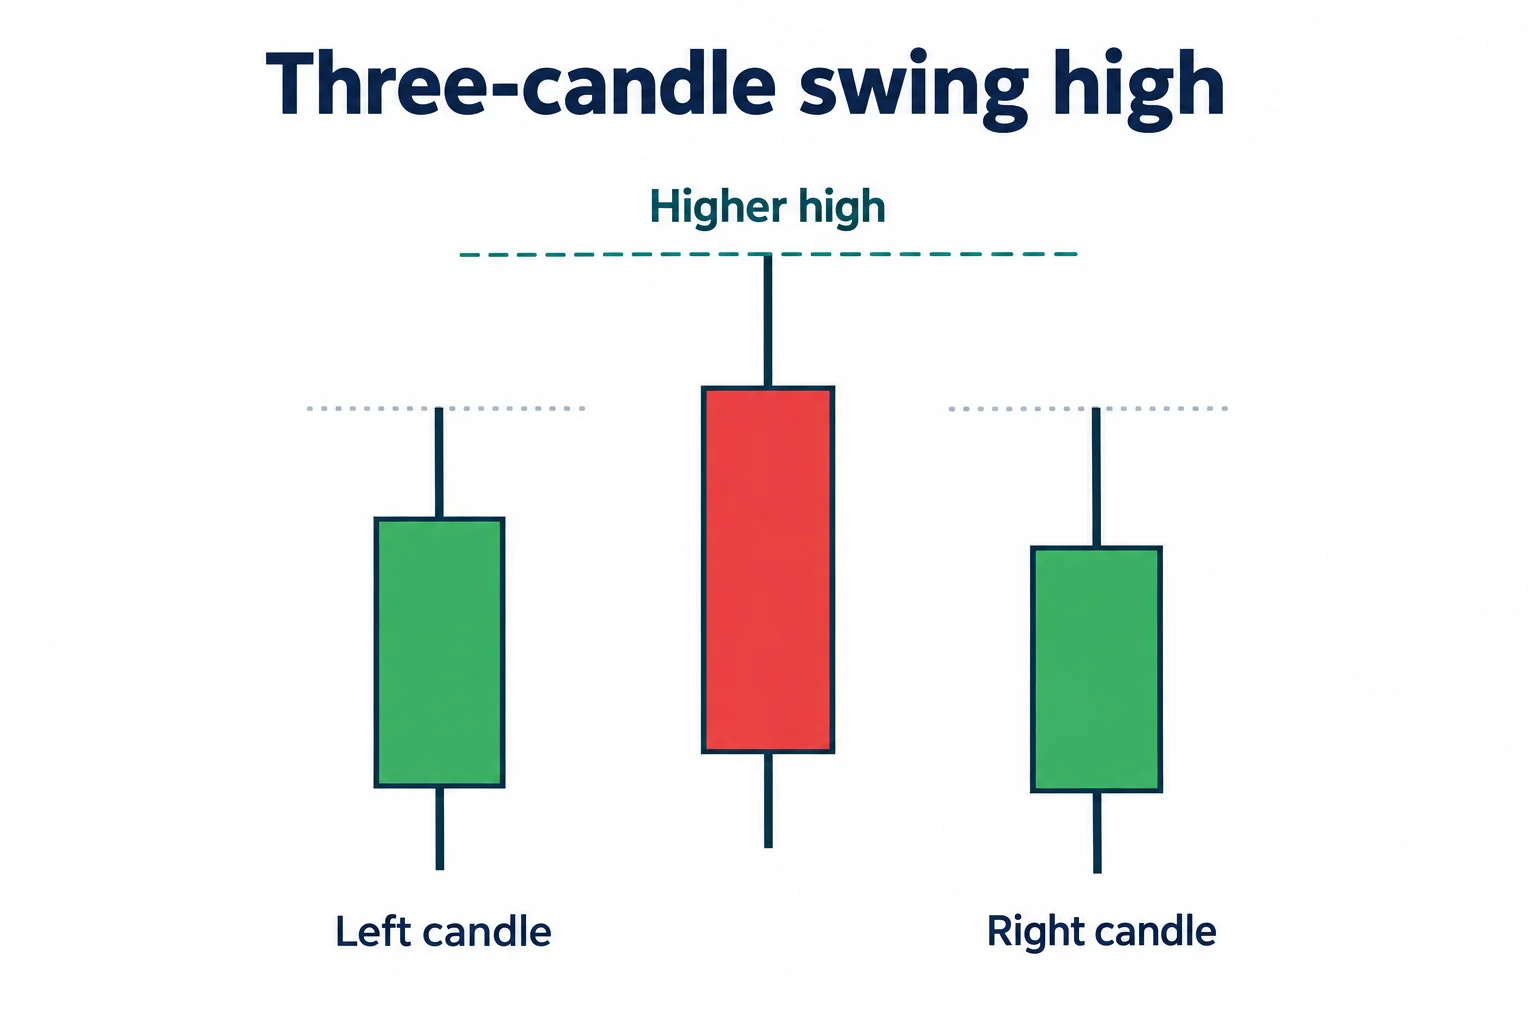
ICT begins the chart lesson with USD/CAD on daily and hourly time frames at 3:58. He identifies what he calls a three-candle swing high: a candle with a higher high than the candles immediately to its left and right. Because this formation appeared near an earlier high, he interprets it as support for looking lower.
That bearish expectation was not presented without an obstacle. At 6:23, ICT points to a prior down-close daily candle that he labels a bullish order block. In his framework, movement into that candle could impede or temporarily interrupt a decline. This is an important qualification: directional bias does not mean ICT expects price to travel to a target in a straight line.
Moving to the 15-minute and five-minute charts, he discusses the Canadian retail-sales release scheduled for 8:30 a.m. New York time. His preferred sequence was to wait until after the release rather than take the earlier setup. At 8:48, he describes price first moving above a short-term high, then breaking a short-term low with stronger displacement as the news arrived.
Within ICT’s terminology, that sequence supplied several parts of a bearish setup:
- Buy-side liquidity was taken above a short-term high.
- A forceful decline broke a nearby low, which ICT calls a market-structure shift.
- The decline left an imbalance or fair value gap.
- Relative equal lows below price served as a proposed sell-side liquidity objective.
ICT recommends observing this type of event in a demo account rather than trying to anticipate the initial news reaction. He also emphasizes defining risk around the full setup instead of rejecting a trade merely because the stop distance appears large. Position size, in his explanation, should be adjusted to the permitted risk.
What ICT Episode 40 Teaches About Daily Bias
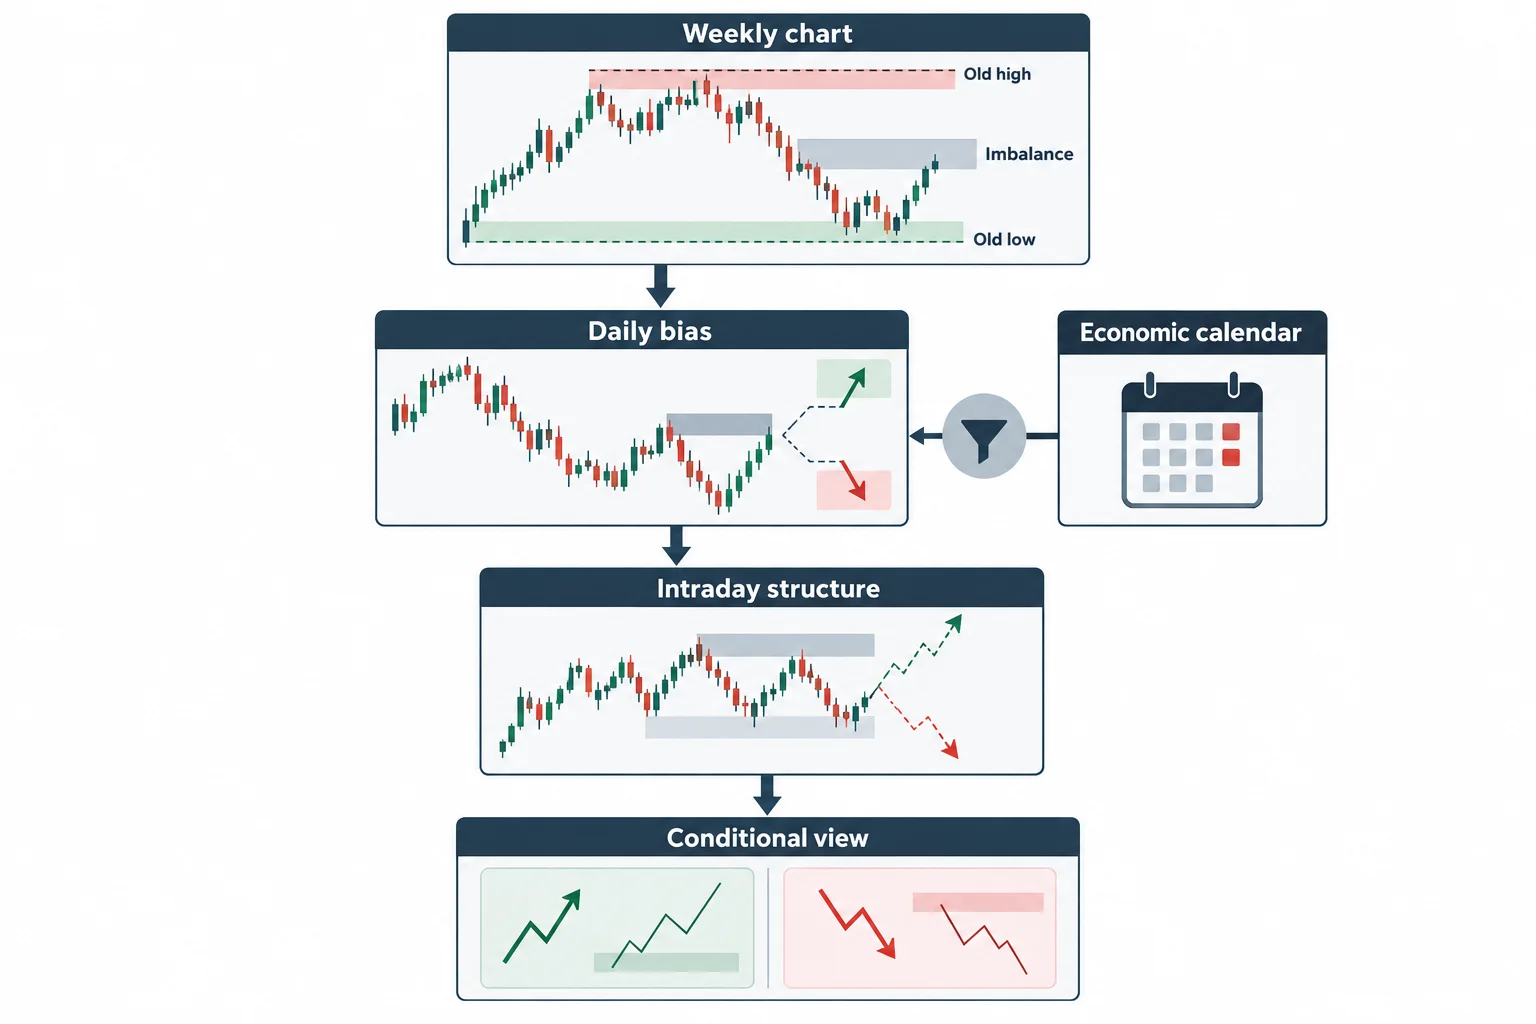
The broader daily-bias discussion begins at 18:24. ICT explicitly rejects the expectation of determining the correct bias every day through an infallible checklist. He says that even his own directional assessment can be wrong.
His simplified process starts with the weekly chart. Rather than forecasting the exact weekly high, low or close, he asks where expansion is more likely to occur. Candidate objectives include an old high, an old low or an imbalance above or below current price. He then works down through weekly, daily, four-hour, hourly and intraday charts to look for compatible structure.
At 24:50, ICT adds the economic calendar as a filter. He focuses on days containing medium- or high-impact events for the relevant market. If the weekly expectation is lower, for example, he looks around the event for an upward liquidity run followed by bearish displacement and a retracement into a fair value gap.
The practical takeaway is selectivity. ICT does not advocate forcing a trade every day. He presents waiting for higher-time-frame direction, scheduled volatility and an intraday pattern to align as a way to reduce impulsive overtrading. He also encourages chart journaling so students can review whether the claimed timing and setup relationships recur in their own observations.
ICT Episode 40 E-mini S&P Intermarket Context
At 30:44, the lesson turns to the September 2022 E-mini S&P contract. ICT describes price retracing into an hourly fair value gap situated above the midpoint of a prior range, which he classifies as a premium area.
On lower time frames, he interprets an overnight decline into an imbalance and order block as the foundation for a bullish New York-session idea. The sequence he highlights includes a run below a prior low, a bullish market-structure shift, a return into a discount and then movement toward relative equal highs and the boundaries of the hourly fair value gap.
ICT connects this index-futures example to USD/CAD at 40:35. In his interpretation, bearish USD/CAD conditions supported a “risk-on” framework in which the S&P could more readily rise. He cautions that he is not describing a fixed direct correlation between USD/CAD and the index. Instead, he treats the currency pair as contextual evidence concerning dollar direction and broader risk appetite.
ICT Episode 40 Educational Takeaways and Context
Viewed as a study process rather than a trade signal, Episode 40 proposes four questions:
- Where is the higher-time-frame market plausibly reaching?
- When is scheduled information likely to introduce volatility?
- Does intraday price action show the liquidity run, displacement and retracement required by the model?
- Does another market support or conflict with the proposed risk-on or risk-off narrative?
These are ICT’s discretionary market interpretations, not independently established rules or guarantees. Terms such as fair value gap, order block, liquidity run and market-structure shift are used according to his methodology. Anyone studying the lesson should distinguish retrospective chart explanation from evidence that the same reading will be available or profitable in real time.




