
Key takeaways
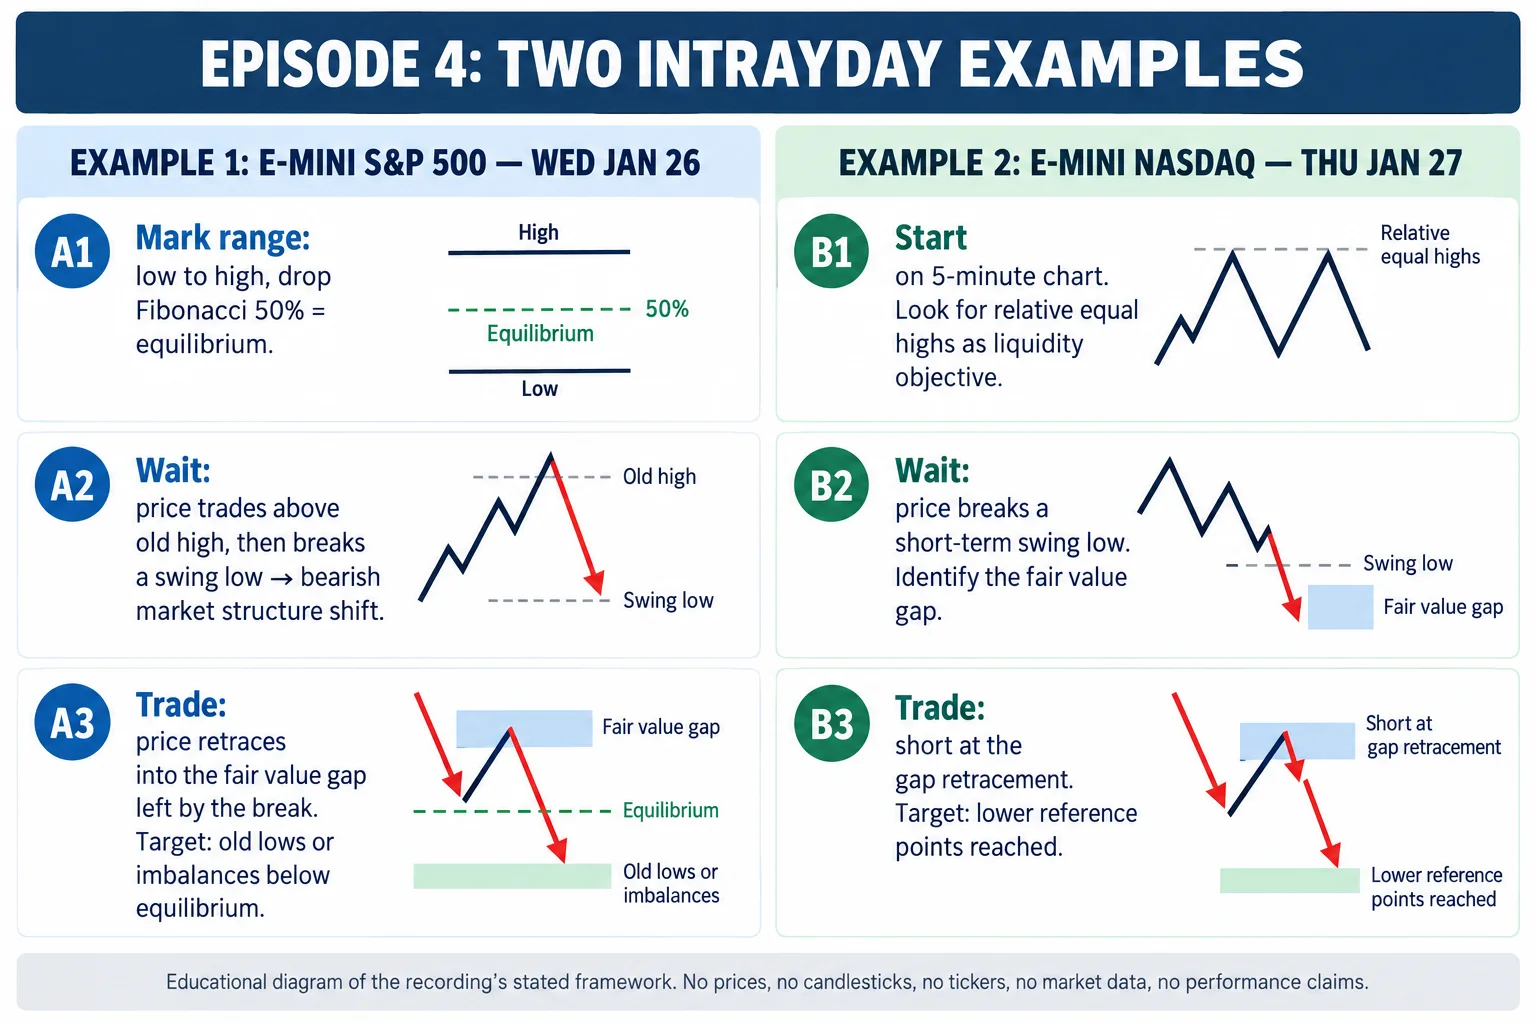
ICT’s roughly eight-minute 2022 Mentorship Episode 4 uses E-mini S&P 500 on January 26 and E-mini Nasdaq on January 27 to teach a repeatable bearish setup.
Read the full summary
ICT’s roughly eight-minute 2022 Mentorship Episode 4 uses E-mini S&P 500 on January 26 and E-mini Nasdaq on January 27 to teach a repeatable bearish setup. Mark the session low and high, use a Fibonacci retracement to locate the 50% equilibrium separating premium from discount, watch the eight thirty a.m. candle for a liquidity hunt above an old or relatively equal high, require a break below a short-term swing low for a bearish market structure shift, identify the resulting fair value gap, and short a retracement into that gap toward earlier lows or imbalances below equilibrium. The S&P example describes a hypothetical entry near 4440 and target near 4382 using rounded estimates, while the Nasdaq example applies the same sequence on a five-minute chart and reaches multiple lower targets. ICT recommends annotating historical charts, journaling each example, and recording the time from structure shift to gap entry and from entry to target. TradingView is mentioned for charting with a free tier and real-time data costing approximately $4 per month.
How we researched this article
BestProps used document-based research from primary firm sources, checked September 25, 2026. The complete source list, scope, limitations, and commercial-state record appear near the end of this article.
In this lesson ICT walks through two live chart examples from his mentorship to demonstrate the recurring pattern he had taught earlier in the week. He opens by acknowledging it will be shorter and more direct, then immediately transitions to the first chart. The lesson concludes with guidance to practice on your own charts over the weekend before the next session covers targeting refinement and entries.
2022 ICT Market Structure Example for E-mini S&P 500
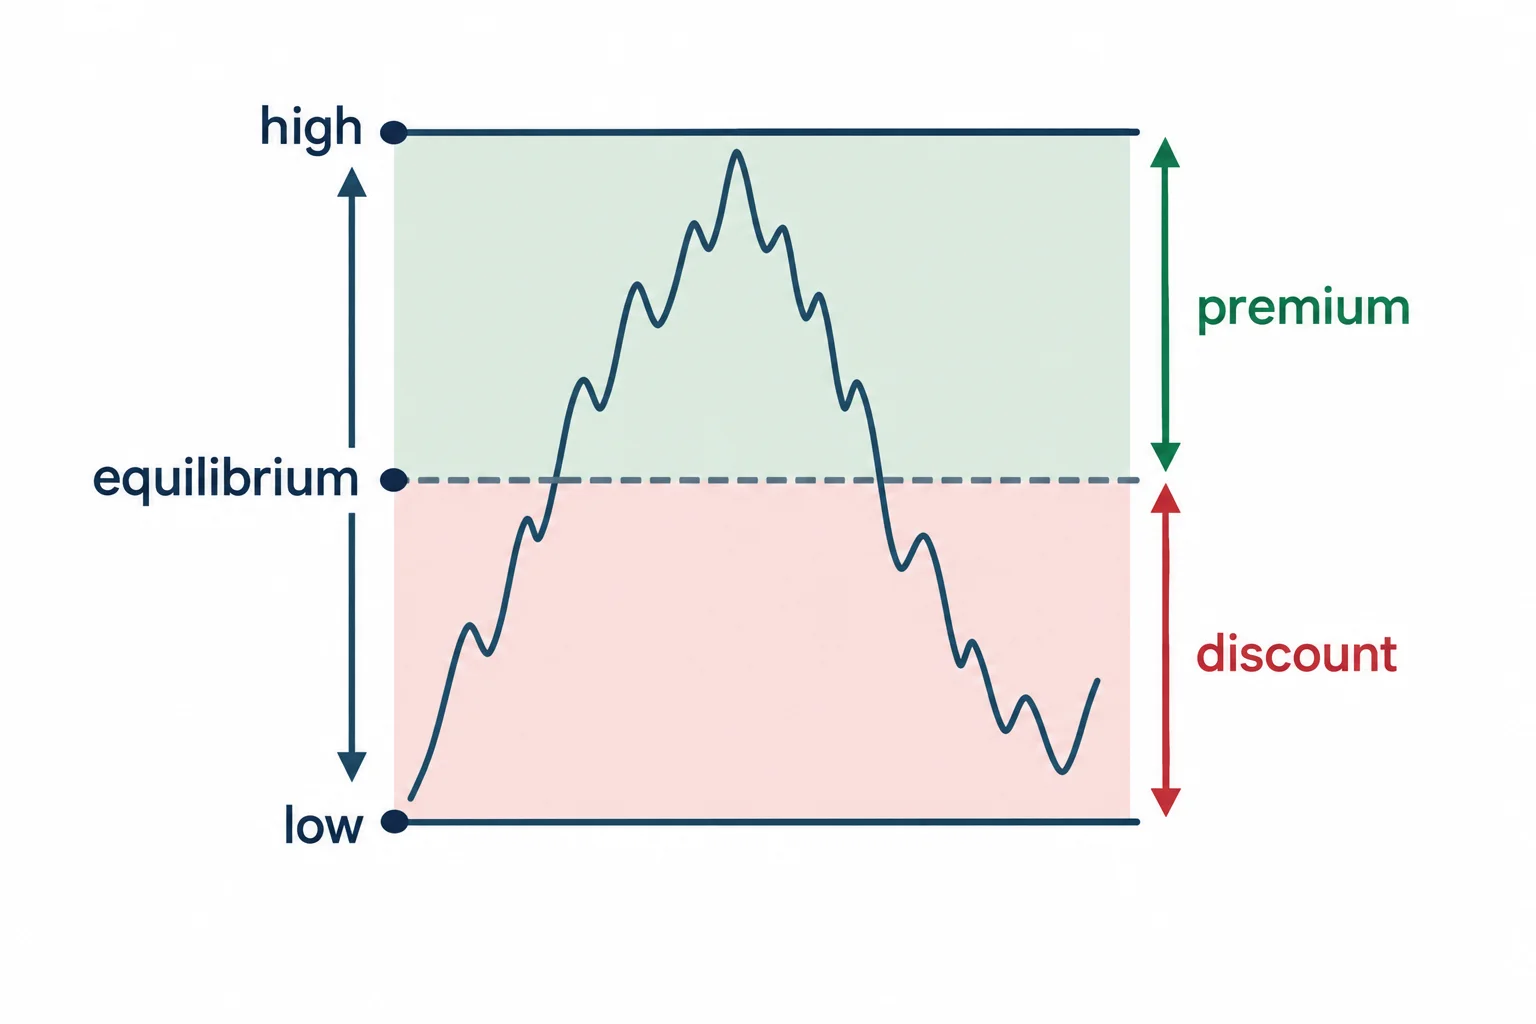
ICT begins by asking students to mark the low and high on the chart for the session, noting that the low he picks is the session low for a reason he will explain. That low-to-high price run defines the range. He then instructs viewers to drop a Fibonacci retracement across that range to find the 50% equilibrium price point, the level above which price is in premium territory and below which it is in discount.
The sequence unfolds as follows:
- Define the range Mark the session low and high; drop the Fibonacci to identify the 50% equilibrium level.
- Wait for the hunt Look for price to trade above an older high. ICT notes that the 8:30 AM candle start is what he uses to initiate this hunt. (0:27 and 3:02)
- Identify the shift Wait for a break below a short-term swing low. ICT calls this a bearish market structure shift. It signals a change in directional bias. (6:06)
- Find the gap A downward move that leaves price above the previous low creates an imbalance or fair value gap. ICT watches this area for a retracement entry. (3:34)
- Trade and target When price retraces into the fair value gap, a short entry is possible. Targets are earlier lows or imbalances below the range’s equilibrium. (8:13)
For this example ICT describes a hypothetical short entry near the 4440 area with a target around 4382, a ~37-point move within the range. He emphasizes these are not precise fills but rounded estimates to illustrate the logic. He stresses that students should log their own annotated charts in their study journal, using their own platform and broker feed, rather than relying solely on his examples.
2022 ICT Fair Value Gap Example for E-mini Nasdaq
ICT switches to a five-minute chart and immediately identifies the session low and high. He notes that relative equal highs can also serve as a liquidity objective, if price trades above them and then breaks a short-term swing low, the resulting fair value gap offers a short entry. He walks through the moment the swing low breaks, confirms the fair value gap is present, and describes how price rallies back into the gap (the entry zone) before price breaks lower again and reaches multiple targets below equilibrium.
ICT reinforces the importance of the deer-track analogy he introduced earlier in the week: traders must know what the pattern looks like to recognize and stalk it effectively. He urges students to go back through historical data and accumulate their own examples over the coming weekend.
ICT Episode 4 Market Structure Takeaways
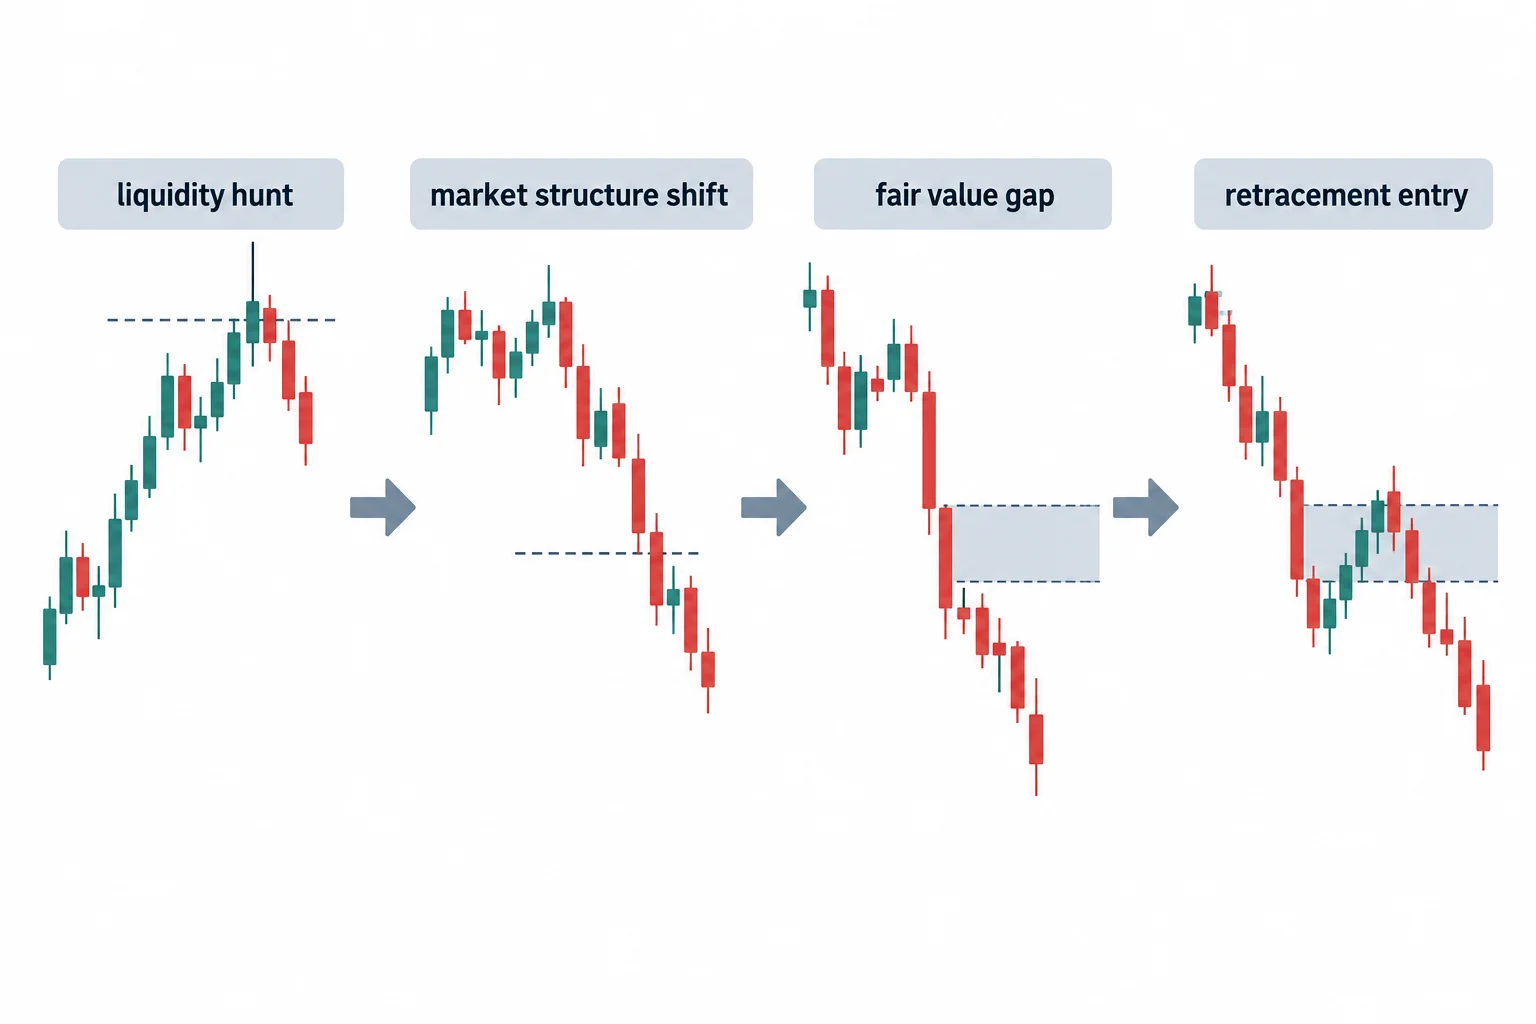
- The setup is consistent across different instruments and days: range definition, equilibrium identification, liquidity hunt, market structure shift, fair value gap, retracement entry.
- The 8:30 AM candle is a reference point for initiating the liquidity-hunt analysis on both days.
- Price must break a short-term swing low (the bearish market structure shift) before a fair value gap becomes a valid entry candidate.
- Entries are taken when price retraces into the gap; targets are earlier lows or imbalances below the range equilibrium.
- Students are encouraged to annotate their own charts and record how long each phase of the trade takes, from shift to gap entry, and from entry to target.
Watch 2022 ICT Mentorship Episode 4
ICT Mentorship Episode 4 on YouTube
2022 ICT Mentorship Episode 4 Resources
- “2022 ICT Mentorship Episode 4” on YouTube Primary source: ICT’s own recording.
- TradingView ICT mentions using TradingView for charting (free tier available; real-time data approximately $4/month).
- “ICT Trading Education” on YouTube ICT’s main educational channel for related lessons.
- “ICT Fibonacci Trading” on YouTube Related Fibonacci and equilibrium framework lessons.




