
Key takeaways
ICT’s 2022 Mentorship Episode 38 uses daily, hourly, 15-minute and five-minute E-mini S&P 500 futures charts to show that a failed bearish objective at 4070 does not require an immediate bullish reversal or any trade at all.
Read the full summary
ICT’s 2022 Mentorship Episode 38 uses daily, hourly, 15-minute and five-minute E-mini S&P 500 futures charts to show that a failed bearish objective at 4070 does not require an immediate bullish reversal or any trade at all. After price failed to reach 4070 and the defined mentorship setup never appeared, ICT moved to the sidelines until a daily fair value gap held, a short-term high broke, a bullish 15-minute market-structure shift formed, price retraced into a 15-minute fair value gap, and Nasdaq made a lower low while the S&P held a higher low, an SMT divergence he interpreted as S&P relative strength. The workflow uses daily context, the 15-minute chart as the bellwether timeframe, preservation of its marked fair value gap on the five-minute chart, and lower-timeframe confirmation, while the afternoon template looks for a morning advance, lunch consolidation or retracement, a sweep below a short-term low within higher-timeframe support, and renewed upside from the discount half of the dealing range. Potential entries include fair value gap retracements, Fibonacci-based optimal trade entries, Turtle Soup moves below prior lows, and buy stops above swing highs, but only after bias, location and the liquidity objective align. Key discussions begin around 4 minutes 26 seconds for the bellwether timeframe, 4 minutes 45 seconds for imbalance placement, 10 minutes 38 seconds for transferring higher-timeframe zones, 16 minutes 59 seconds for scalping versus larger daily-range trades, 20 minutes 13 seconds for lunch-session analysis, 39 minutes 59 seconds for SMT divergence, and 44 minutes 55 seconds for patience. The core lesson is to separate forecasts from valid setups, abandon weak theses without chasing, accept no-trade sessions, and target the middle of a move rather than exact turning points, with transcript-based chart claims treated as educational methodology rather than independently verified performance.
How we researched this article
BestProps used document-based research from primary firm sources, checked September 25, 2026. The complete source list, scope, limitations, and commercial-state record appear near the end of this article.
In 2022 ICT Mentorship Episode 38, ICT reviews an E-mini S&P 500 futures session to explain what to do when an initial directional idea does not materialize. The central lesson is not that a trader must reverse every incorrect forecast. Instead, ICT emphasizes waiting for price to provide new evidence, moving to the sidelines when necessary, and distinguishing the mentorship’s defined scalping model from broader discretionary analysis.
The discussion uses daily, hourly, 15-minute and five-minute charts. Because the transcript is generated from audio, the chart drawings and claimed executions cannot be independently verified from the text alone.
Why the ICT Episode 38 Trade Idea Failed
At the beginning of the lesson, ICT says his initial area of interest was 4070, which he viewed as a possible draw on liquidity beneath the market. Price reportedly moved lower but did not reach that level. More importantly, he says the specific mentorship setup never appeared. He introduces the session as an example of managing and potentially abandoning a bias.
ICT’s distinction is important: a directional expectation is not automatically a trade. If the anticipated setup is absent, no position is required. He says that changing bias can mean either adopting the opposite view or simply doing nothing. This is the episode’s main risk-control principle.
How ICT Episode 38 Shows When to Change Bias
ICT describes several lows being taken without what he considered a favorable short opportunity. The market then moved higher and produced what he labels a bullish market-structure shift on the 15-minute chart. At approximately 4:26, he identifies the 15-minute chart as his “bellwether” timeframe for this analysis.
His revised bullish narrative relied on a sequence of observations:
- The anticipated move to 4070 failed to occur.
- Price reportedly respected a daily fair value gap rather than breaking below it.
- A short-term high was exceeded, which ICT interpreted as a bullish structure shift.
- Price then retraced into a 15-minute fair value gap.
- The S&P and Nasdaq lows diverged in a way he calls SMT divergence.
In ICT’s framework, a fair value gap is an imbalance formed during a rapid price move. He does not argue in this lesson that every imbalance must be completely filled. Instead, he focuses on whether an imbalance is positioned in a useful location relative to the expected draw on liquidity. His explanation of that distinction begins near 4:45.
ICT Episode 38 Higher Timeframe Reading on Five-Minute Charts
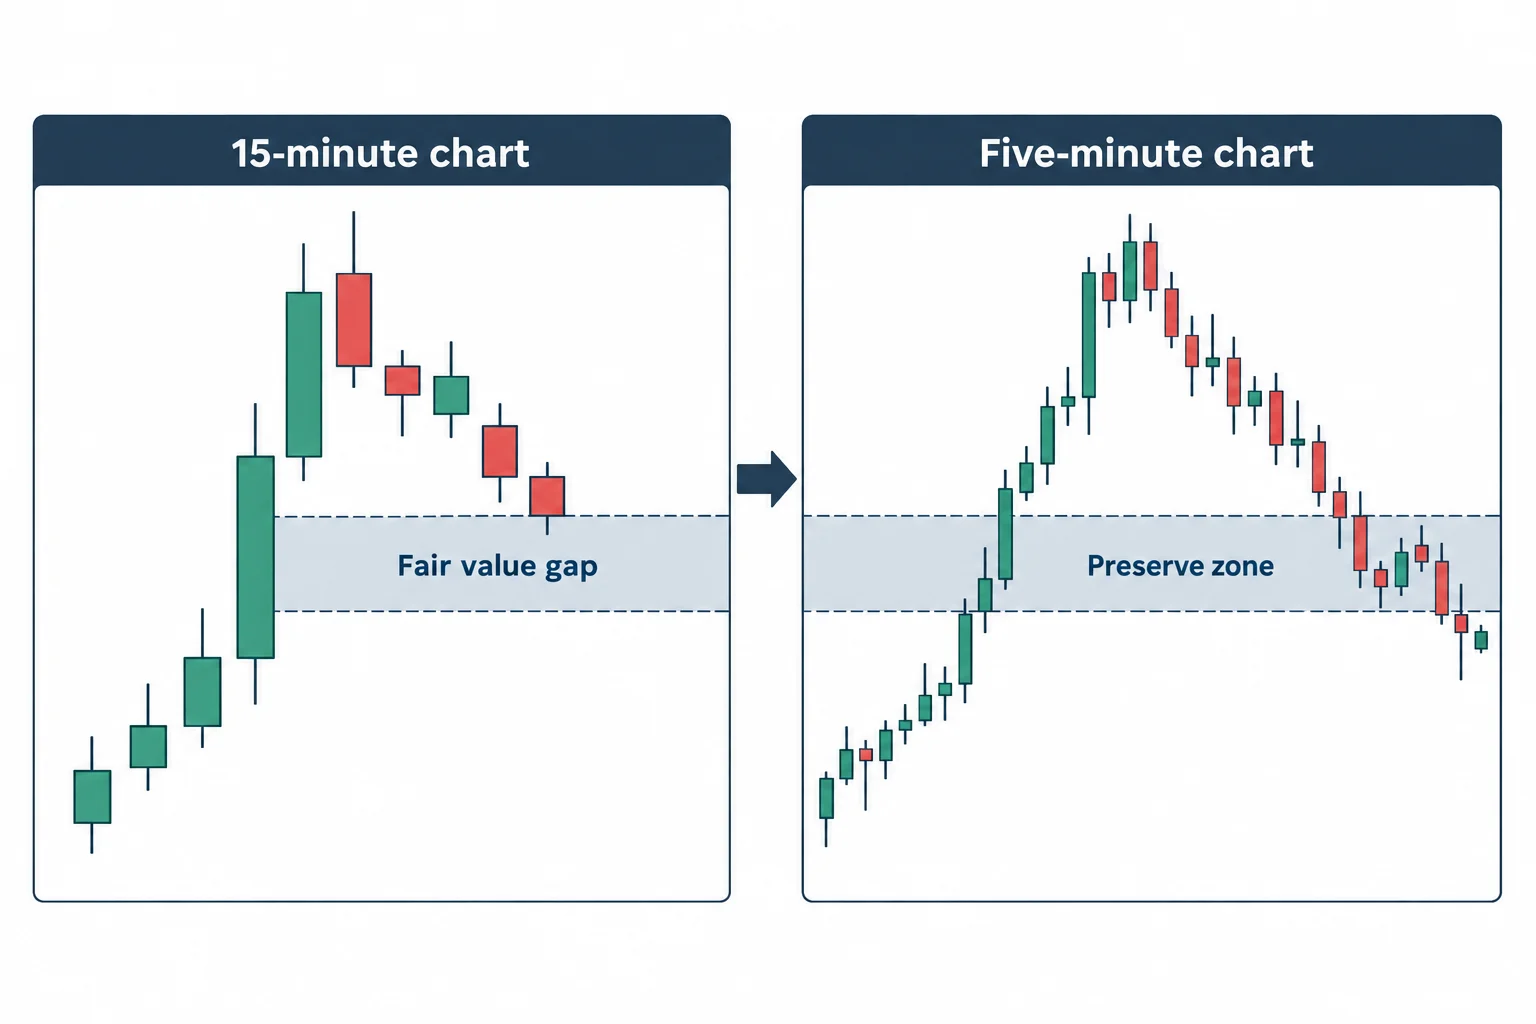
One practical instruction is to mark the fair value gap on the 15-minute chart and preserve that area when moving to the five-minute chart. ICT notes that the higher-timeframe gap may not look obvious when viewing the lower timeframe by itself. The walkthrough of this process starts around 10:38.
This is a multi-timeframe workflow rather than a standalone entry signal:
- Use the daily chart to establish broader context.
- Use the 15-minute chart to identify structure and the relevant imbalance.
- Transfer that marked area to the five-minute chart.
- Wait for lower-timeframe behavior that supports the working narrative.
ICT contrasts the mentorship’s short-term scalping model with an attempt to capture a larger portion of the daily range. For the latter, he says he uses the 15- and five-minute charts while still borrowing lower-timeframe entry concepts. This distinction is discussed at 16:59.
How ICT Episode 38 Reads the Afternoon Lunch Session
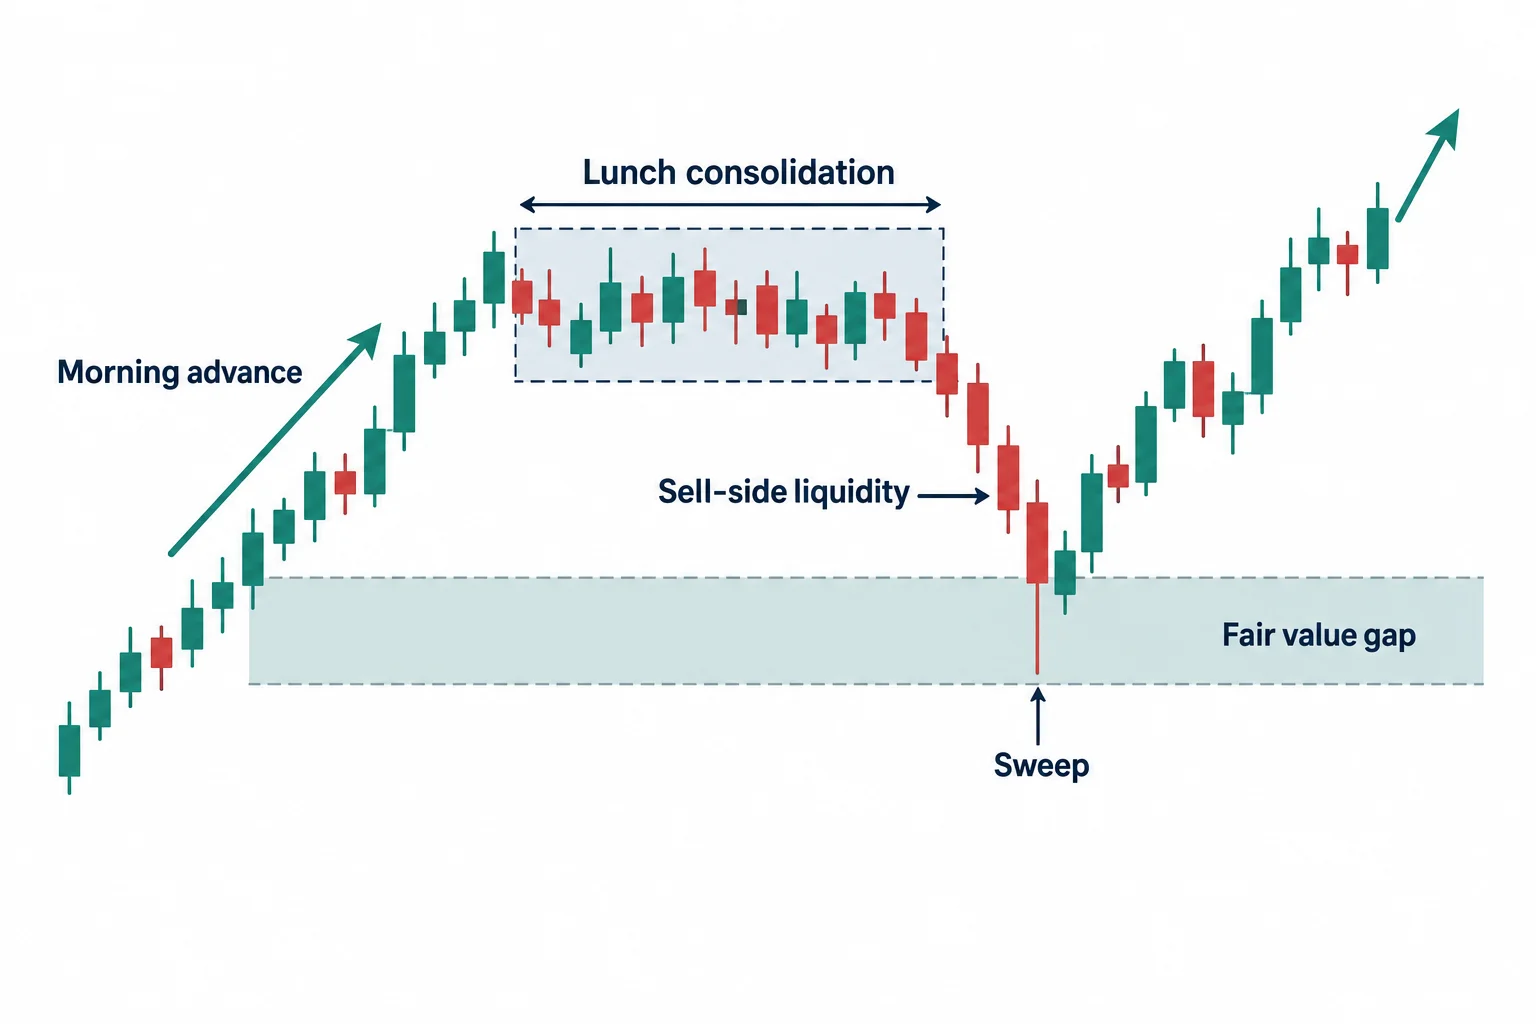
A substantial part of Episode 38 addresses the afternoon session. ICT’s general bullish template is a morning advance, lunch consolidation, a post-lunch sweep below a short-term low, and then another move higher. In this example, however, he characterizes the move into lunch as a retracement rather than a conventional consolidation.
That difference affected which swing points he used to define the dealing range. He measured from a more recent structure low to the subsequent high, then treated prices below the range’s midpoint as a discount. His lunch-session explanation begins near 20:13.
Within ICT’s interpretation, a dip below a short-term low represented a sweep of sell-side liquidity inside the higher-timeframe fair value gap. He says this helped support an afternoon bullish narrative. This should be understood as ICT’s reading of the session, not as proof that such a sequence reliably predicts future price movement.
ICT Episode 38 SMT Divergence Across S&P and Nasdaq
Near 39:59, ICT explains how he overlays a Nasdaq futures series on the S&P chart and compares corresponding lows. In the example, the Nasdaq reportedly formed a lower low while the S&P held a higher low. He calls this SMT, while noting that he has used both “smart money tool” and “smart money technique” for the abbreviation.
ICT interprets that divergence as relative strength in the S&P and as supporting evidence for accumulation. The transcript does not establish that this interpretation has been independently tested, so it is best treated as one component of ICT’s stated analytical framework.
Why ICT Episode 38 Prioritizes Bias and Patience
ICT outlines several possible entry styles, including a retracement into a fair value gap, an optimal trade entry measured with a Fibonacci retracement, a “Turtle Soup” style move beneath a prior low, or a buy stop above a nearby swing high. He nevertheless argues that these patterns should only be considered after bias, location and the expected liquidity objective have been assessed.
The broader educational point appears around 44:55: being present at the screen does not create an obligation to trade. ICT says traders may spend much more time waiting than acting, and that patience remains necessary after entry as well.
2022 ICT Mentorship Episode 38 Key Takeaways
- A forecast and a valid setup are separate things.
- An invalidated idea does not always justify an immediate reversal.
- Higher-timeframe zones should be carried onto lower-timeframe charts.
- ICT uses structure, displacement, fair value gaps and intermarket divergence to build what he calls narrative.
- The mentorship’s defined model may produce no setup during a given session.
- Protecting against a weak thesis is more important than capturing the exact high or low.
Episode 38 is ultimately a lesson about adapting without chasing. ICT presents the session as an example of letting the original bearish objective go, waiting for a clearer bullish sequence, and focusing on a middle portion of the move rather than demanding perfect turning points. These concepts are educational descriptions of ICT’s methodology, not investment advice or a promise of trading performance.




