
Key takeaways
2022 ICT Mentorship Episode 25 analyzes the June 2022 E-mini S&P 500 futures contract through daily, hourly, 15-minute, five-minute and two-minute charts, teaching that bearish bias, liquidity order, time, displacement and fair value gap location must align rather than treating one pattern as a setup.
Read the full summary
2022 ICT Mentorship Episode 25 analyzes the June 2022 E-mini S&P 500 futures contract through daily, hourly, 15-minute, five-minute and two-minute charts, teaching that bearish bias, liquidity order, time, displacement and fair value gap location must align rather than treating one pattern as a setup. For the May 10, 2022 session, ICT combines a prior bearish area, buy-side liquidity above relative equal highs, sell-side liquidity below prior lows and expected late-April-to-May seasonal weakness, then interprets the rally above highs first and decline below a prior low second as bearish movement from premium to discount. The eight thirty a.m. to nine thirty a.m. New York interval forms a claimed Judas swing around the equity open, followed by a market-structure shift, bearish displacement and Power of Three distribution lower. The procedural model marks the five-minute displacement range and its midpoint, requires an entry area in the premium half, rejects gaps in discount, finds no qualifying four- or three-minute gap and identifies a two-minute fair value gap after a short-term low breaks at 41 minutes 13 seconds. A hypothetical demo stop goes above the gap-creating candle or, more conservatively, a nearby swing high, with risk reduced only after a larger structural low breaks rather than after a minor favorable move. ICT discourages beginners from trading live funds, acknowledges losses at 17 minutes 34 seconds and promises neither profitability nor a perfect win rate, while the transcript provides no verified prices, fills, returns or proof of its claims about algorithmic and institutional behavior.
How we researched this article
BestProps used document-based research from primary firm sources, checked September 25, 2026. The complete source list, scope, limitations, and commercial-state record appear near the end of this article.
2022 ICT Mentorship Episode 25, uploaded May 11, 2022, presents ICT’s interpretation of a bearish E-mini S&P 500 futures session. The lesson moves from daily context to hourly, 15-minute, five-minute and two-minute charts. Its central idea is that a trader should combine directional bias, liquidity, time and a fair value gap rather than treat any single chart pattern as a complete setup.
This is an educational summary of ICT’s framework, not independent confirmation that markets operate as he describes. The transcript also cannot establish the chart’s precise prices, a real trade fill or the profitability of the model.
ICT Mentorship Risk and Practice Guidance
ICT opens by telling learners not to rush into live trading merely because recent examples appear understandable. At 1:12, he asks viewers to assess whether the recurring time-and-price logic is visible on their own charts. He then explicitly discourages beginners from using live funds while they are still learning.
This warning matters because the later chart discussion can sound highly confident. ICT nevertheless acknowledges at 17:34 that losing trades occur and says he is not promising profitability, a perfect win rate or a particular return. The practical educational takeaway is to separate pattern recognition from financial risk: a setup that looks clear in a reviewed example can still fail in real time.
ICT Mentorship Daily Chart Liquidity
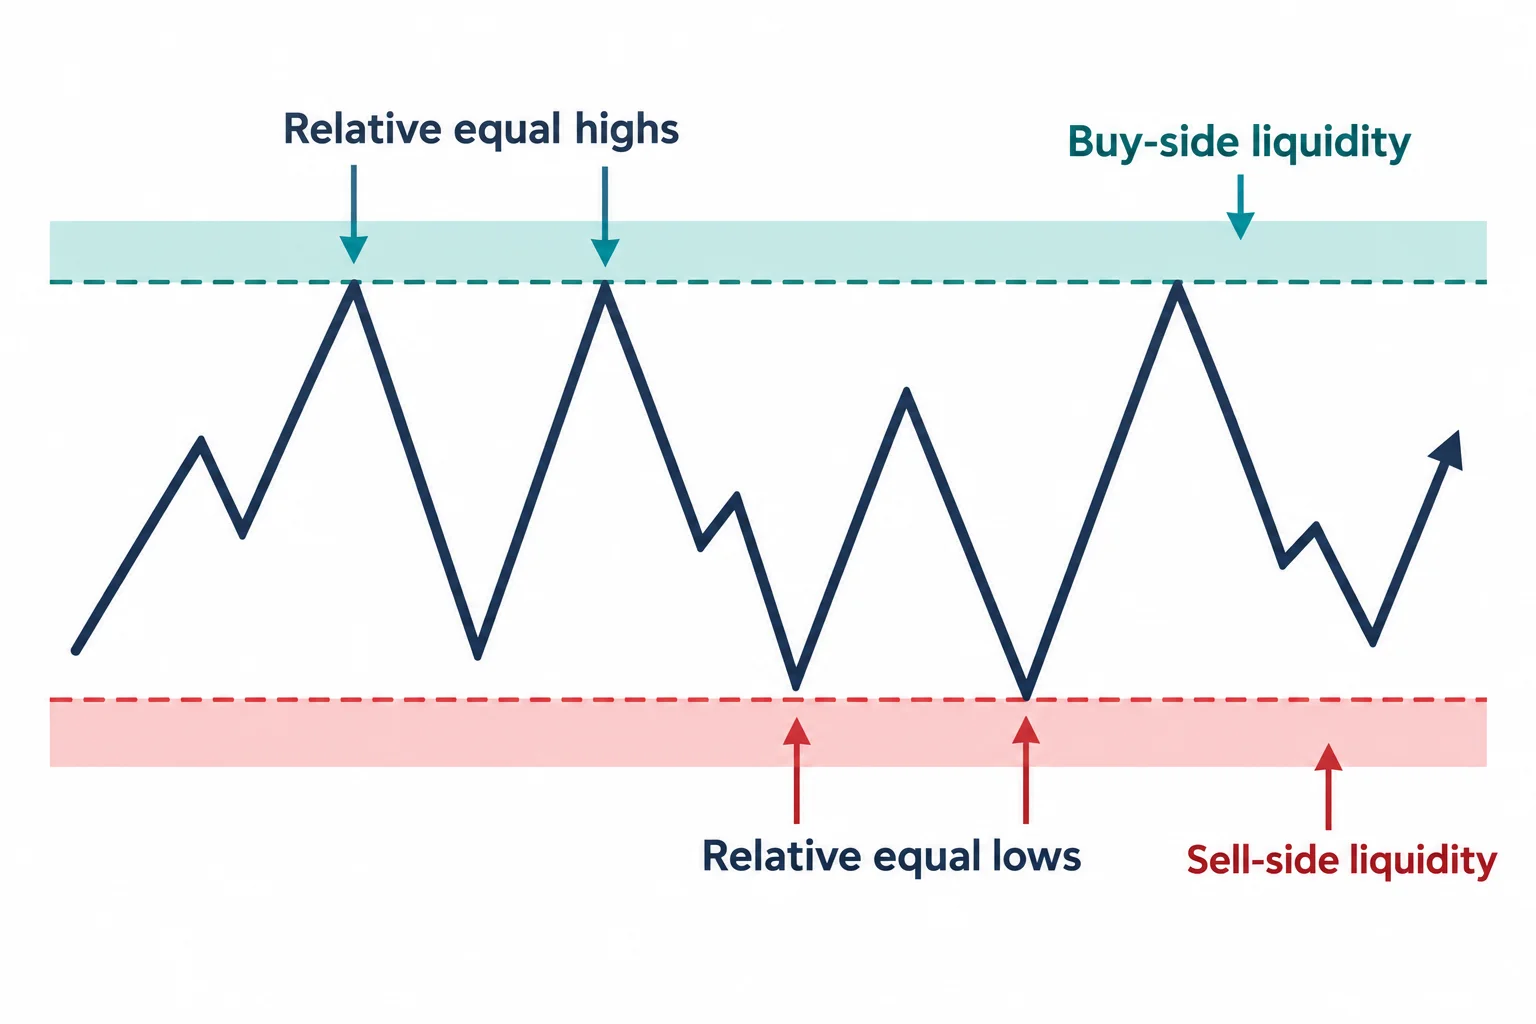
The chart lesson begins at 6:52 with the June 2022 E-mini S&P futures contract on a daily chart. ICT revisits a bearish order block and places greater emphasis on the fair value gap, which he presents as a relatively accessible concept for newer students.
He describes relative equal lows as a location of sell-side liquidity and relative equal highs as a location of buy-side liquidity. In ICT’s terminology, stops above old highs may provide liquidity for selling, while stops below old lows may provide liquidity for buying back short exposure. This is ICT’s market interpretation; the transcript does not independently demonstrate who placed the orders or why price moved.
At 11:01, he adds a seasonal component. ICT says U.S. equity indices have historically tended to weaken around late April and May, but he also stresses that such a tendency is not absolute. Within the lesson, seasonality is contextual rather than a standalone signal. His bearish narrative combines:
- a previously identified bearish area;
- buy-side liquidity above relative equal highs;
- sell-side liquidity beneath prior lows; and
- ICT’s expectation of seasonal weakness.
ICT cautions against trying to identify the ultimate market bottom after a large decline. Around 22:16, he argues that an oversold reading or bullish divergence should not automatically overturn an established bearish bias.
ICT Mentorship Intraday Liquidity Narrative
The main case study uses price action that ICT identifies as Tuesday, May 10, 2022. He first examines the prior three days’ open, high, low and close, then focuses on Monday’s large decline and Friday’s low. His thesis is that Tuesday’s rally returned to Friday’s low, thereby “rebalancing” part of Monday’s downward range.
On the hourly chart, introduced at 24:49, ICT divides each trading day at midnight New York time. Tuesday’s daily candle may appear indecisive, he says, but its lower-time-frame sequence is more informative: price first trades above relative equal highs and later moves beneath a prior low.
The order of those events is essential to his reading. At 28:24, ICT explains that taking buy-side liquidity first is consistent with his bearish bias. Had price first broken the previous low and then rallied, he says he would not have interpreted the sequence in the same bearish way.
ICT Liquidity From Premium to Discount
ICT frames the initial rally as movement into a “premium,” followed by a decline toward a “discount.” On the 15-minute chart at 30:57, he highlights the 8:30 a.m. to 9:30 a.m. New York interval. In his account, price begins seeking the highs after 8:30 and reaches the prior reference level around the 9:30 equity-market open.
He labels the rally a “Judas swing” (his term for a deceptive move opposite the anticipated directional expansion). He then maps the session using his Power of Three vocabulary: accumulation, a rally or manipulation phase, and distribution lower. The claimed bearish sequence includes a market-structure shift, displacement and a fair value gap.
ICT Mentorship Fair Value Gaps Across Time Frames
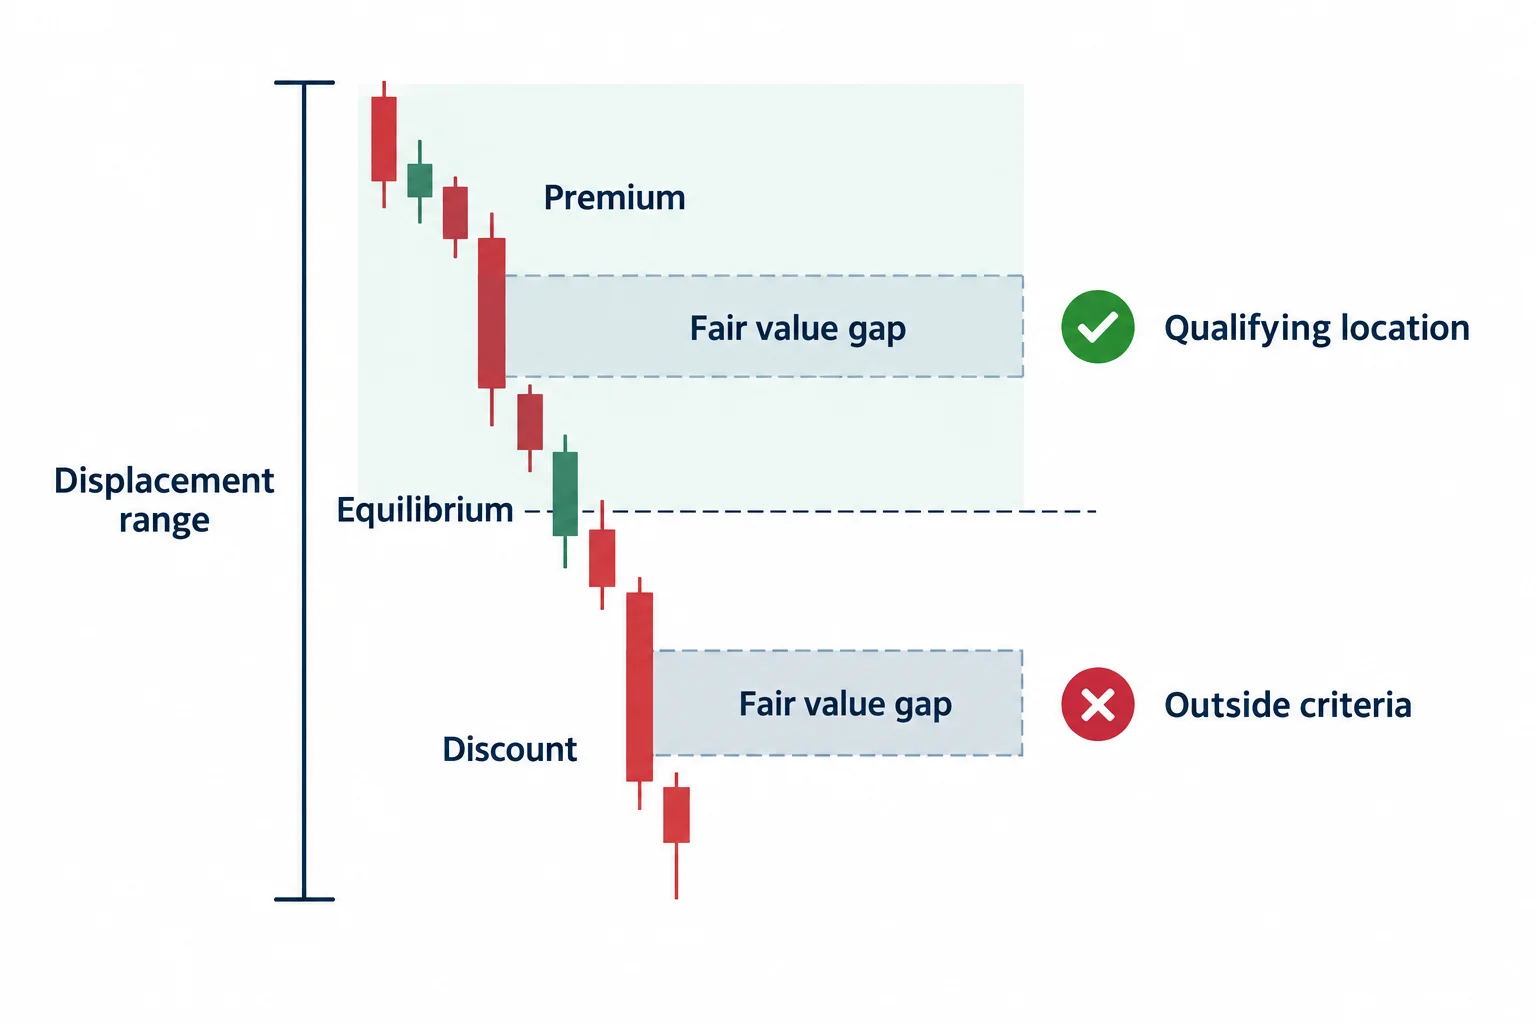
The most procedural part begins near 34:06. ICT marks a five-minute bearish displacement leg and then steps through progressively lower time frames to find an imbalance within that move.
- Identify the displacement range on the five-minute chart.
- Mark its midpoint, or equilibrium.
- Require a prospective bearish entry area to be above that midpoint, in what ICT calls premium.
- Inspect lower time frames for a fair value gap inside the marked range.
He finds no qualifying gap on the four- or three-minute chart. At 41:13, he identifies one on the two-minute chart after a short-term low has been broken. A lower gap would not qualify under the stated rules if it remains in the displacement leg’s discount half. This illustrates the episode’s broader lesson: the existence of a gap alone is insufficient; its location must agree with bias and market structure.
ICT Mentorship Stop Placement and Trade Management
From 41:48, ICT discusses a hypothetical demo trade. He places the initial protective stop above the candle that created the fair value gap, or more conservatively above a nearby swing high. He warns against tightening the stop immediately after a small favorable move because an ordinary retracement could close the position before the anticipated expansion.
His proposed condition for reducing risk is a larger structural break. Only after a more significant low is taken does he consider moving the stop behind a newer reference point. These are the speaker’s illustrative rules, not a recommendation to place a trade. Actual slippage, commissions, contract specifications and individual risk capacity are not evaluated in the transcript.
2022 ICT Mentorship Episode 25 Study Plan
Episode 25 ultimately advocates simplification: one setup studied repeatedly through time and price. A neutral way to turn that into chart study is to record the higher-time-frame bias, prior highs and lows, the order in which liquidity levels are reached, the displacement range, its midpoint and any qualifying fair value gap. Results should include failed examples rather than only clean historical illustrations.
ICT makes broader claims about algorithmic control and institutional behavior near the end of the video. Those claims are his interpretation and are not proven by the transcript. The most concrete, testable content is the chart-reading sequence itself: establish context, observe which liquidity area is reached first, require displacement, search for an appropriately located imbalance and define invalidation before evaluating the outcome.




