
Key takeaways
ICT Mentorship Episode 22 analyzes a bearish June 2022 E-mini S&P 500 session across daily, hourly, 15-minute, five-minute and one-minute charts, teaching that traders should establish a higher-time-frame destination and directional narrative before using liquidity sweeps, displacement, structural breaks, fair value gaps or order blocks as entry frameworks.
Read the full summary
ICT Mentorship Episode 22 analyzes a bearish June 2022 E-mini S&P 500 session across daily, hourly, 15-minute, five-minute and one-minute charts, teaching that traders should establish a higher-time-frame destination and directional narrative before using liquidity sweeps, displacement, structural breaks, fair value gaps or order blocks as entry frameworks. The example targets relatively equal daily lows after price sweeps short-term highs near the open, breaks a prior low, retraces into a fair value gap and resumes lower under the Power of Three model. Risk guidance includes accounting for the fair value gap creation candle, placing a more conservative stop beyond the nearby swing, avoiding excessive size and practicing on a demo account. The Nasdaq example at 20 minutes 27 seconds shows nested fractal structure and refinement of a five-minute bearish order block on a one-minute chart, while SMT divergence at 43 minutes 12 seconds compares a Nasdaq higher high with an unconfirmed E-mini S&P high as relative weakness rather than a guaranteed reversal. TradingView Fibonacci settings shown at 46 minutes 26 seconds use 0.5 as equilibrium, 0.62 through 0.79 as the optimal trade entry region, candle bodies instead of wick extremes and extension levels as standard-deviation projections. ICT presents the framework as educational commentary, warns that his readings can be wrong and does not independently substantiate predictive reliability, executions or results.
How we researched this article
BestProps used document-based research from primary firm sources, checked September 25, 2026. The complete source list, scope, limitations, and commercial-state record appear near the end of this article.
In 2022 ICT Mentorship Episode 22, ICT reviews a bearish session in the June 2022 E-mini S&P 500 contract, then moves through hourly, 15-minute, five-minute and one-minute charts to explain his reading of liquidity and market structure. The lesson also covers fair value gaps, order blocks, a Nasdaq example, intermarket divergence and Fibonacci configuration in TradingView.
The discussion reflects ICT’s own market framework and interpretations. It should be studied as educational commentary rather than proof that the concepts predict markets reliably.
Episode 22 Liquidity Targets and Market Narrative
ICT begins on the daily E-mini S&P chart. He says that a previously identified bearish order block, a seasonal tendency and what he calls a risk-off relationship with the US dollar supported his expectation for lower equity prices. His proposed destination was a pair of relatively equal daily lows, which he describes as a draw on liquidity at 1:55.
The larger teaching point is that selecting an entry candle comes after establishing a directional narrative. In ICT’s formulation, a student should first ask where price may be drawn, why that destination makes sense and whether current structure supports the idea. An order block or fair value gap is therefore not presented as a standalone signal.
At 6:32, he illustrates the target with TradingView drawing tools. A bullseye or magnet is only a visual annotation; it does not itself calculate or validate a target.
Episode 22 Liquidity and the Opening Reversal
On the hourly chart, ICT identifies an area between a candle low and a later candle’s opening as both an imbalance and an opening gap. He notes that subsequent candle bodies remained largely within that area while some wicks extended beyond it. In his reading, those wick excursions reached for nearby liquidity without invalidating the broader bearish context.
The lesson then shifts to a 15-minute view of the US stock-market open. Beginning around 9:38, ICT describes the following sequence:
- Price moves above a short-term high near the opening.
- It then breaks beneath a prior low with an energetic move, which he labels displacement.
- That decline leaves an imbalance or fair value gap.
- Price retraces into the gap before continuing toward the previously identified daily lows.
Within ICT terminology, trading above an old high is a short-term premium because price has entered an area of buy-side liquidity. Trading below an old low is correspondingly described as a discount. He cautions that neither label means price must reverse: a market can remain in a premium and continue higher, just as it can trade at a discount and continue lower.
Build the ICT Narrative Before Reading Structure
At 12:07, ICT argues that market structure helps frame an idea but is not sufficient by itself. His stated narrative incorporates the expected destination, economic-calendar context and the volatility available during that session. This is also his criticism of treating an overbought or oversold reading as an automatic entry.
He connects the session to his “Power of Three” model: an opening price, a rally or manipulation phase that forms the high, and a subsequent bearish expansion. The transcript attributes this movement to “smart money” activity and an algorithm, but it does not provide independent evidence establishing those causal claims. They are best understood as components of ICT’s explanatory model.
ICT Liquidity Refinement and Risk Management
On the five-minute and one-minute charts, ICT looks for relative equal highs above the opening price, a sweep of those highs, a bearish structural break and a return to a fair value gap. The detailed one-minute walkthrough starts near 16:58.
He says a protective stop for the example would need to account for the candle that created the fair value gap, with a more conservative placement beyond the nearby swing. More importantly, he warns against choosing excessive size merely to maximize potential gains. He explicitly recommends practicing with a demo account and characterizes disregard for risk as gambling.
For the afternoon, ICT describes waiting until after approximately 1:30 p.m., when the lunch period has passed, and then watching for a retracement in the direction opposite the session’s prevailing move. In the chart under review, he identifies retracements into imbalances and relative equal highs as possible study areas within the existing bearish narrative.
ICT Mentorship Lessons From Nasdaq Fractals
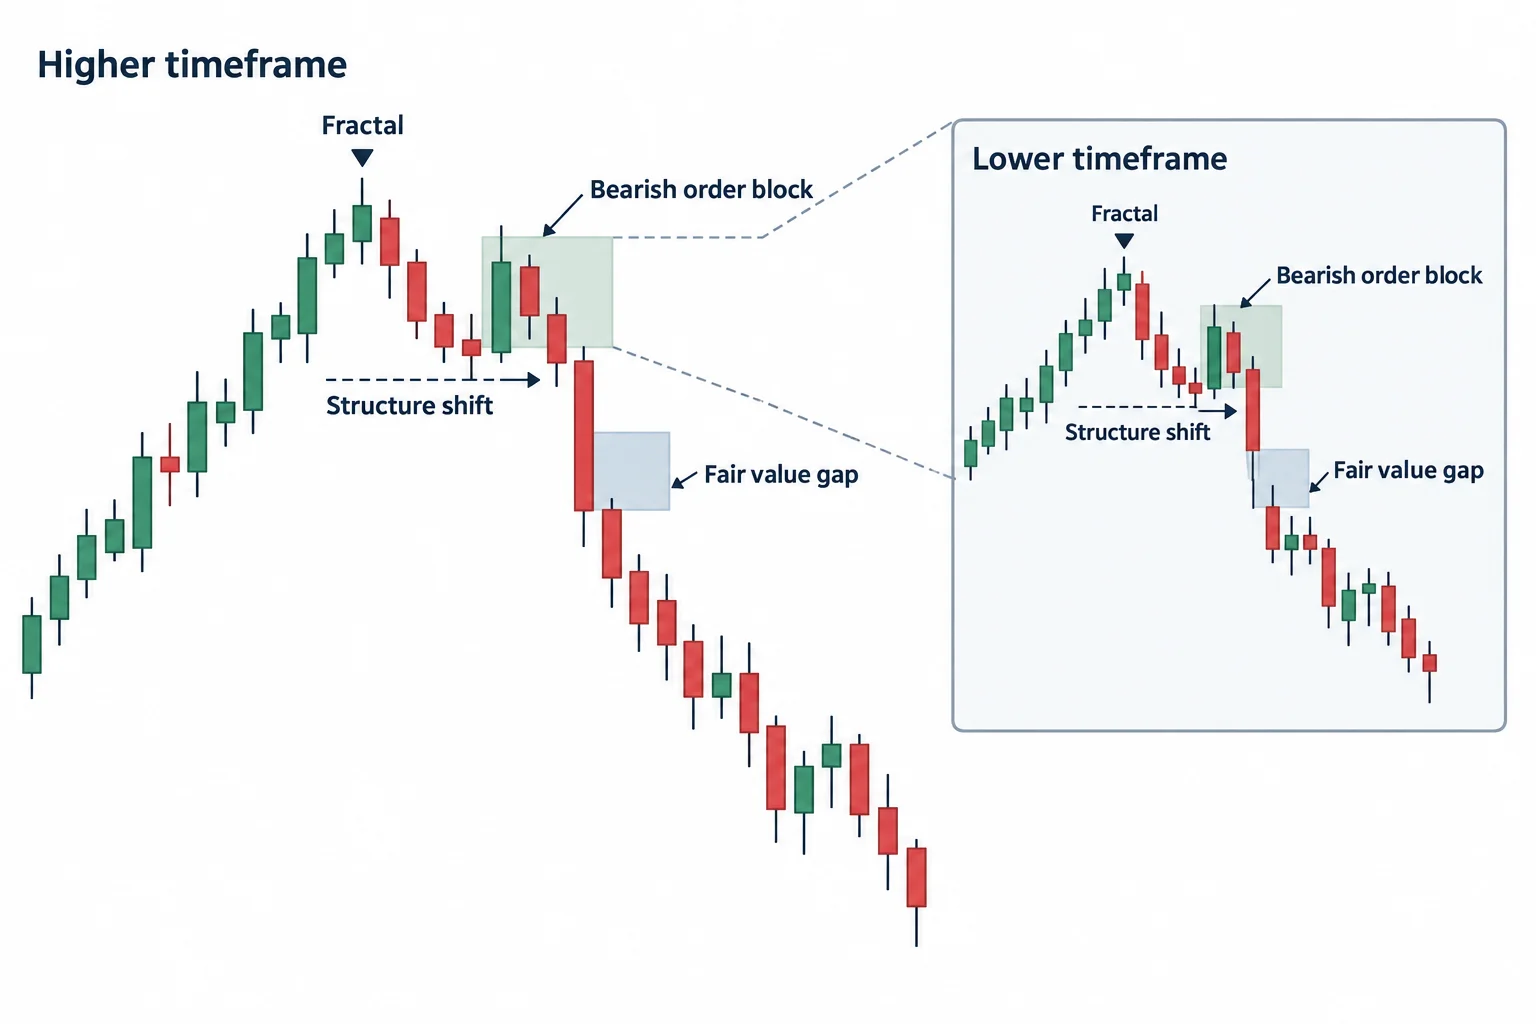
The Nasdaq segment begins around 20:27. ICT describes a five-minute sweep above a high, a bearish structural shift, displacement beneath relative equal lows and a retracement into a fair value gap. He then points to a smaller repetition of the same sequence, calling it a fractal.
His top-down process classifies nested swing highs and then refines a five-minute order block on a one-minute chart. A bullish candle in this bearish setting is labeled a bearish order block under his terminology. He looks near its midpoint for a possible entry area, while treating a seemingly bullish lower-time-frame formation as subordinate to the higher-time-frame bearish structure.
ICT also recounts his own executions and position management. Those statements are self-reported in the recording; captions and chart narration do not independently verify order records, fills, account results or later outcomes.
SMT Divergence Between Nasdaq and the S&P
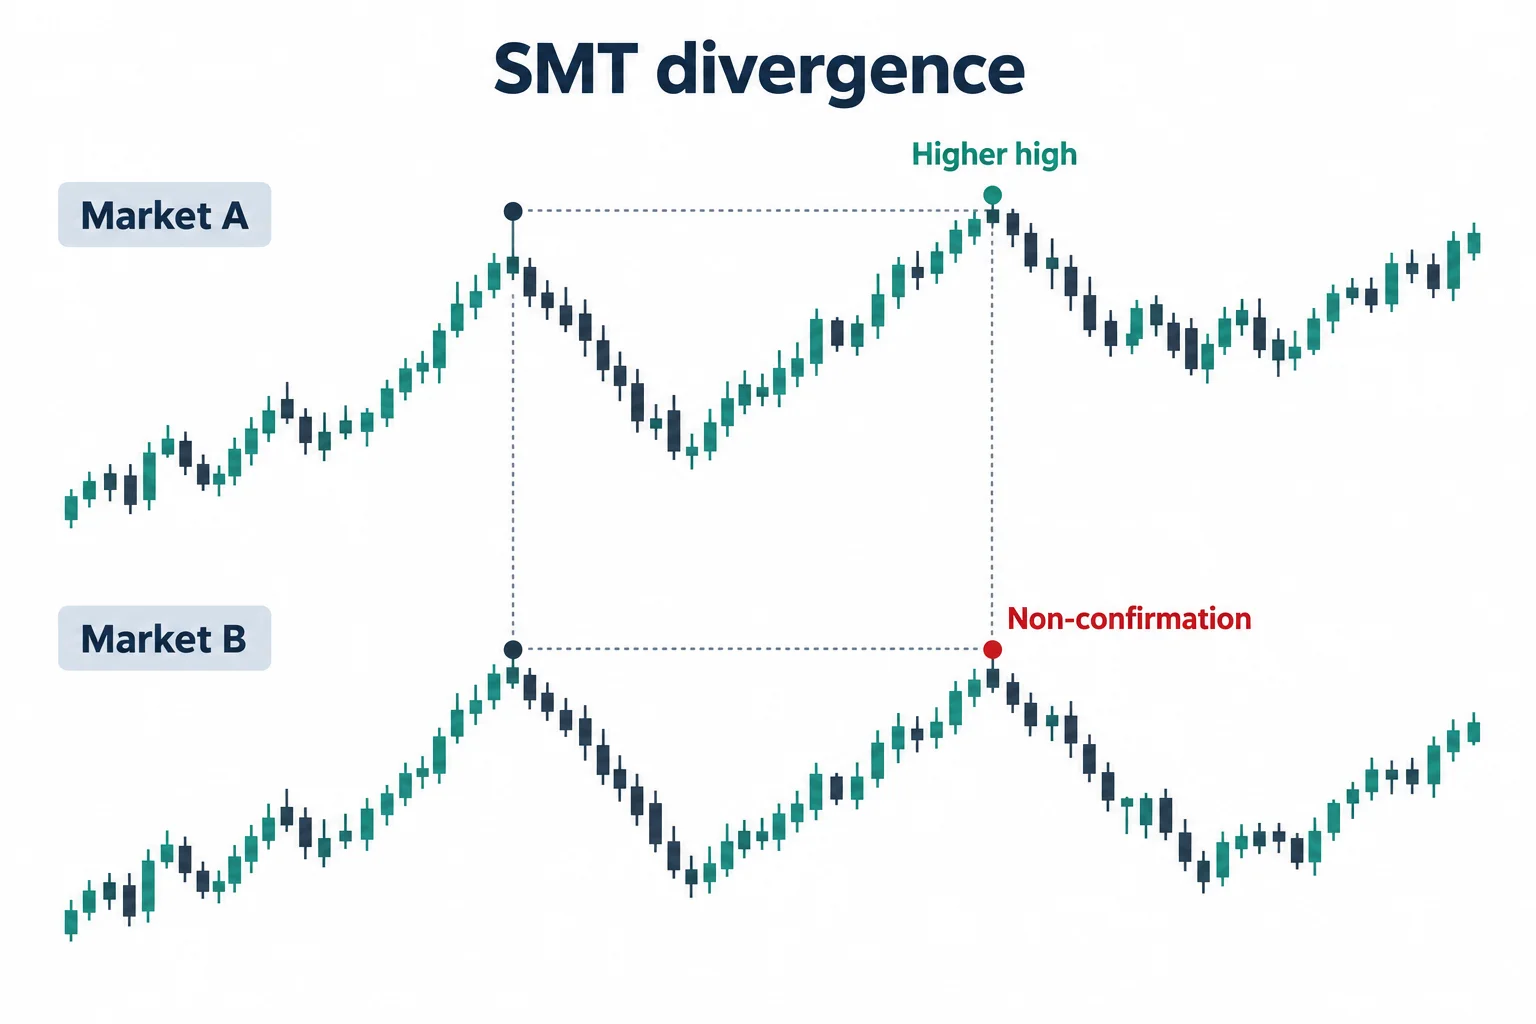
At 43:12, ICT compares Nasdaq and E-mini S&P highs. Nasdaq is described as making a higher high while the S&P fails to confirm it. He calls this SMT divergence and interprets it, given his bearish premise, as evidence that the Nasdaq move was a stop run and that the S&P was relatively weak.
This is a price-to-price comparison rather than a conventional oscillator. A general educational takeaway is that correlated markets can be compared for confirmation or disagreement, but divergence alone does not establish direction or guarantee a reversal.
ICT Mentorship TradingView and Fibonacci Settings
The final section is largely platform instruction. ICT demonstrates horizontal annotations and then shows his Fibonacci settings beginning around 46:26. He uses 0.5 as equilibrium, identifies 0.62 through 0.79 as his optimal trade entry region, and adds extension levels framed as standard-deviation projections.
For optimal trade entry measurements, he says he prefers candle bodies (the relevant opens or closes) rather than extreme wicks, which he treats as liquidity runs. These settings are conventions within his method, not independently tested findings in the transcript.
Episode 22 Liquidity Study Checklist
- Define the higher-time-frame directional premise and target before searching for an entry.
- Mark old highs, old lows and relative equal highs or lows as potential liquidity areas.
- Study whether a liquidity sweep is followed by displacement and a structural break.
- Observe retracements into fair value gaps or order blocks only in relation to the broader narrative.
- Compare correlated indices for confirmation or divergence.
- Record invalidations and risk before evaluating potential reward.
ICT repeatedly tells viewers not to treat his live commentary as trade advice and acknowledges that his readings can be wrong. This episode is most useful as a structured example of how he combines higher-time-frame targets, intraday structure and intermarket comparison, not as evidence of assured profitability.



