
Key takeaways
ICT Mentorship Episode 21 (recorded April 2022) reviews a strongly bearish E-mini S&P session using the June 2022 contract, with US Dollar Index strength as risk-off context, a daily bearish order block, relative equal lows as a liquidity target, seasonal weakness approaching May, key opening prices, displacement, and fair value gaps.
Read the full summary
ICT Mentorship Episode 21 (recorded April 2022) reviews a strongly bearish E-mini S&P session using the June 2022 contract, with US Dollar Index strength as risk-off context, a daily bearish order block, relative equal lows as a liquidity target, seasonal weakness approaching May, key opening prices, displacement, and fair value gaps. ICT expected a rally toward 4320 and a Judas swing above the midnight New York open before reversal, but neither developed, illustrating a compressed Power of Three sequence of accumulation, manipulation, and distribution. The midnight open framed the daily range and London session (approximately 2:00–5:00 a.m. New York time), the 8:30 a.m. open anchored the New York Power of Three model, and the 9:30 a.m. equity open accelerated the decline but was not itself a trade signal. Because the standard five-minute setup was absent, ICT reviewed lower-time-frame fair value gaps for potential entry and risk framing while emphasizing stop losses, limited repeat entries, no unattended positions, shorter intraday exposure, and accepting missed moves rather than forcing trades or moving stops too quickly.
How we researched this article
BestProps used document-based research from primary firm sources, checked September 25, 2026. The complete source list, scope, limitations, and commercial-state record appear near the end of this article.
In ICT Mentorship Episode 21, ICT reviews a strongly bearish E-mini S&P session and explains how he used the US Dollar Index, higher-time-frame liquidity, opening prices, and intraday imbalances to frame his bias. The lesson is also unusually candid about an imperfect forecast: ICT expected a larger rally before the decline, but that rally never developed.
The central message is not that every move can be captured. It is that a trader needs a directional framework, criteria for recognizing when an ideal setup is absent, and the discipline either to adapt or remain on the sidelines.
ICT Intermarket Bias From Dollar Strength
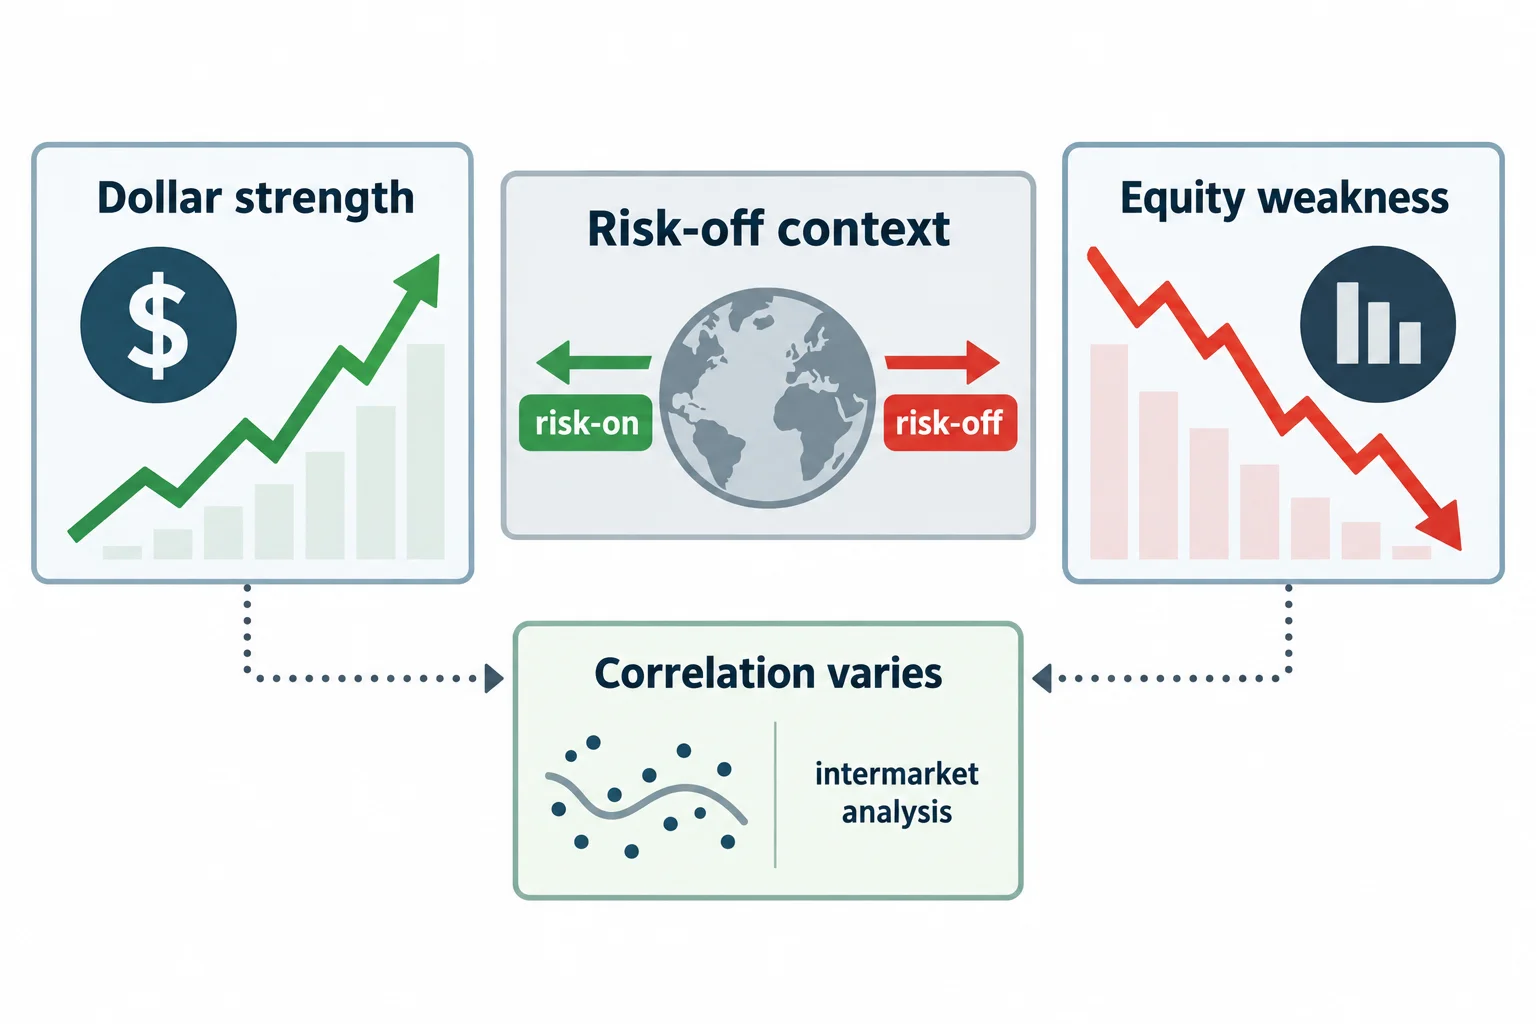
ICT begins on an hourly Dollar Index chart and introduces his interpretation of risk-on and risk-off conditions. He characterizes a rising dollar as a risk-off signal that can accompany pressure on foreign currencies and equity indices. He then compares the dollar’s advance with weakness in the June 2022 E-mini S&P contract.
At 1:50, he outlines the basic inverse relationship he watches between the dollar and foreign currencies. At 5:13, he shifts to the relationship between the dollar and the E-mini S&P.
This is ICT’s market interpretation, not a rule that must hold at all times. A useful general takeaway is that intermarket analysis may provide context, but it should not replace direct analysis of the instrument being studied. Correlations can weaken, strengthen, or temporarily reverse.
ICT Bearish Bias on the Daily Chart
On the E-mini S&P daily chart, ICT focuses on what he calls a bearish order block and relative equal lows below the market. In his framework, the lower prices represented a potential draw on liquidity. He also refers to a seasonal tendency for equity weakness approaching May, using that as supporting context rather than the sole basis for his view.
At 7:37, he revisits the daily order block and explains why he expected price to continue toward the lows. Importantly, he does not claim to know the exact path once price reaches that area. He explicitly says he cannot know in advance whether the move would accelerate downward or produce a sharp retracement.
Adapting When the ICT Bearish Rally Fails
The most instructive part of the episode begins with ICT acknowledging that his preferred scenario was wrong in one respect. He expected a rally toward the 4320 area before a reversal, but the market instead remained weak. The transcript does not provide enough visual information to independently verify chart prices or subsequent outcomes, so these levels should be understood as his chart commentary.
At 9:55, ICT discusses the missed expectation. He had wanted a more pronounced move above the midnight opening price (a pattern he calls a Judas swing) before the decline. Instead, price produced only small movements above that reference and then broke lower.
He uses this example to explain that “Power of Three” can appear in a compressed form. In his terminology, Power of Three consists of accumulation, manipulation, and distribution. On this session, the anticipated manipulation above an opening price was minimal or absent, reducing the usefulness of the textbook setup.
ICT Episode 21 New York Session Times
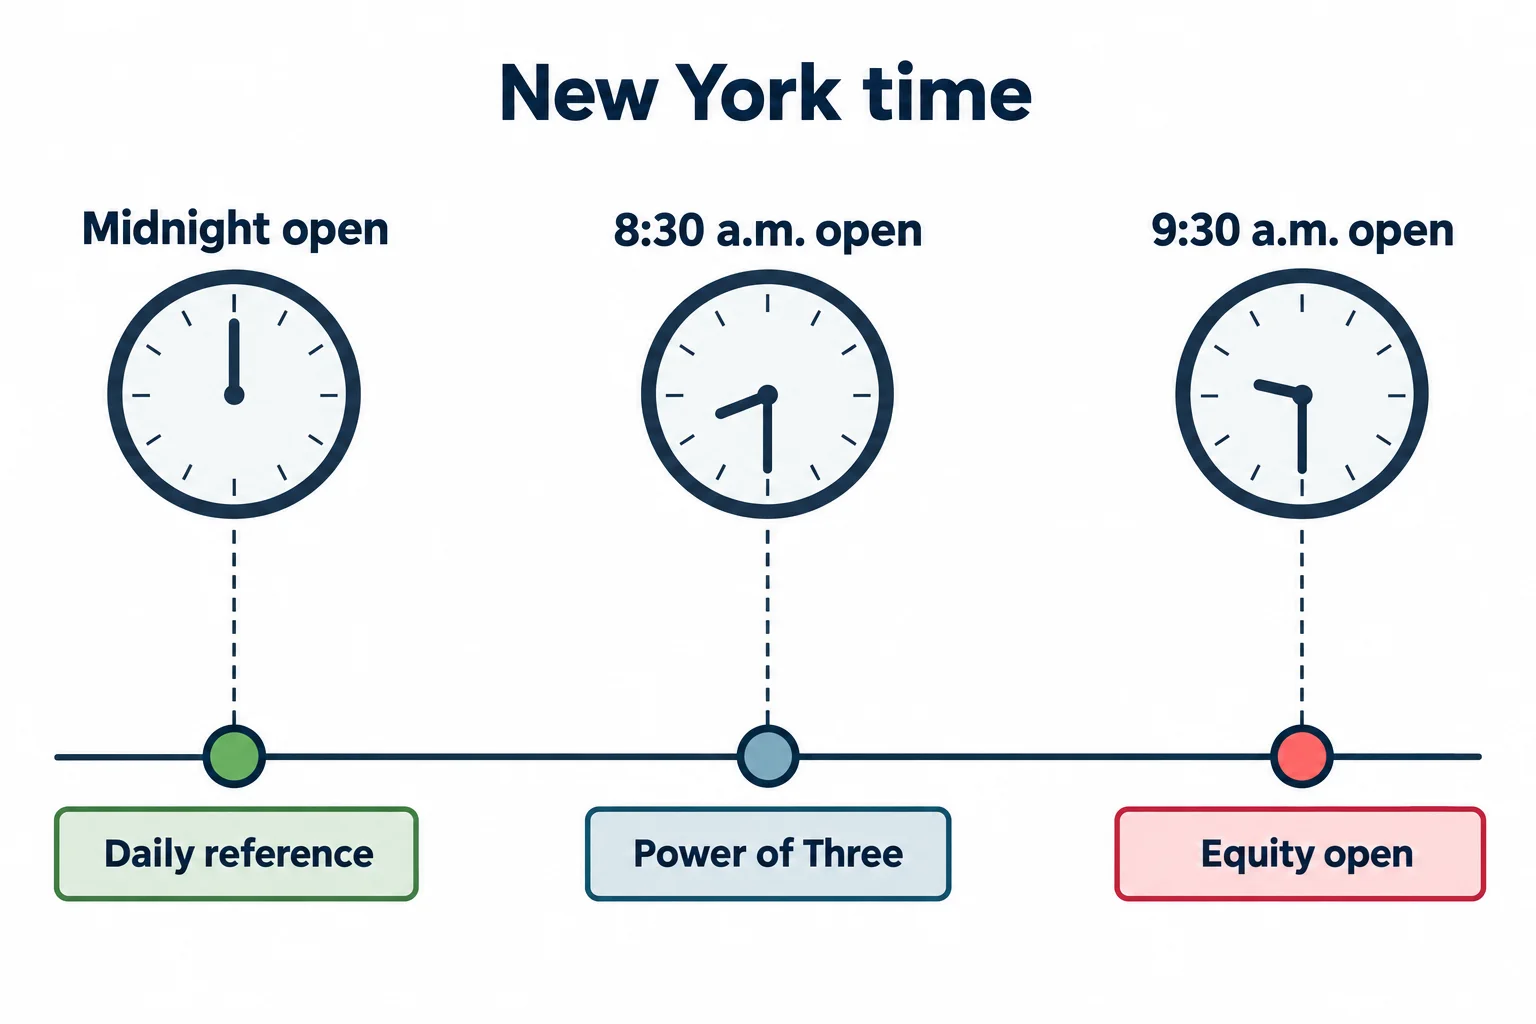
ICT distinguishes three time references:
- Midnight New York opening price: Used to frame the daily range and the London session, which he defines here as approximately 2:00–5:00 a.m. New York time.
- 8:30 a.m. opening price: Used as a reference for his New York-session Power of Three framework.
- 9:30 a.m. equity open: Treated as a period when stock-market activity can introduce volatility or accelerate a move already underway.
At 13:26, he explains how the midnight open fits a bearish daily-range model. At 16:06, he applies similar reasoning to the 8:30 open. Neither reference price received the rally he wanted. ICT interprets that failure to rally as evidence that the session was exceptionally heavy.
At the 9:30 equity open, price reportedly accelerated an existing decline rather than first producing an upward sweep. At 26:50, ICT emphasizes that 9:30 is an opening event, not automatically a trade signal.
ICT Bearish Session Fair Value Gaps
ICT says the standard five-minute model he had been teaching did not appear that day. He instead examines lower-time-frame displacement and fair value gaps as possible ways to align with the bearish move. His explanation uses one gap as a potential entry area and another as part of the risk framework.
At 19:47, he reviews what he considered the clearest London-session setup. At 21:31, he explains why the usual post-8:30 model was not present on the five-minute chart.
This section should not be read as proof that fair value gaps predict price. It documents how ICT retrospectively organized the session using his own terminology. Lower-time-frame analysis can also increase noise and execution sensitivity.
ICT Session Risk and Missed Bearish Moves
ICT repeatedly stresses that traders will misread sessions and miss major moves. He recommends using stop losses, limiting repeated entries, and avoiding unattended positions. He also says he personally had stopped holding overnight or over weekends and generally preferred shorter intraday exposure at that time.
The broader educational point is behavioral: an absent setup does not require a trade. At 32:49, ICT contrasts adapting to a non-ideal session with doing nothing and accepting the missed opportunity. Near the end, he warns against moving a stop too quickly merely because price has started moving favorably.
2022 ICT Mentorship Episode 21 Summary
Episode 21 shows how ICT combined dollar strength, a bearish daily objective, session opening prices, and intraday imbalances while acknowledging that the anticipated rally never formed and that missing part (or all) of a move is a normal outcome. These concepts are presented for education and study, not as investment advice or a promise of trading performance.



