
How we researched this article
BestProps used document-based research from primary firm sources, checked September 25, 2026. The complete source list, scope, limitations, and commercial-state record appear near the end of this article.

Watch on YouTube — 49 min • ICT Mentorship 2022
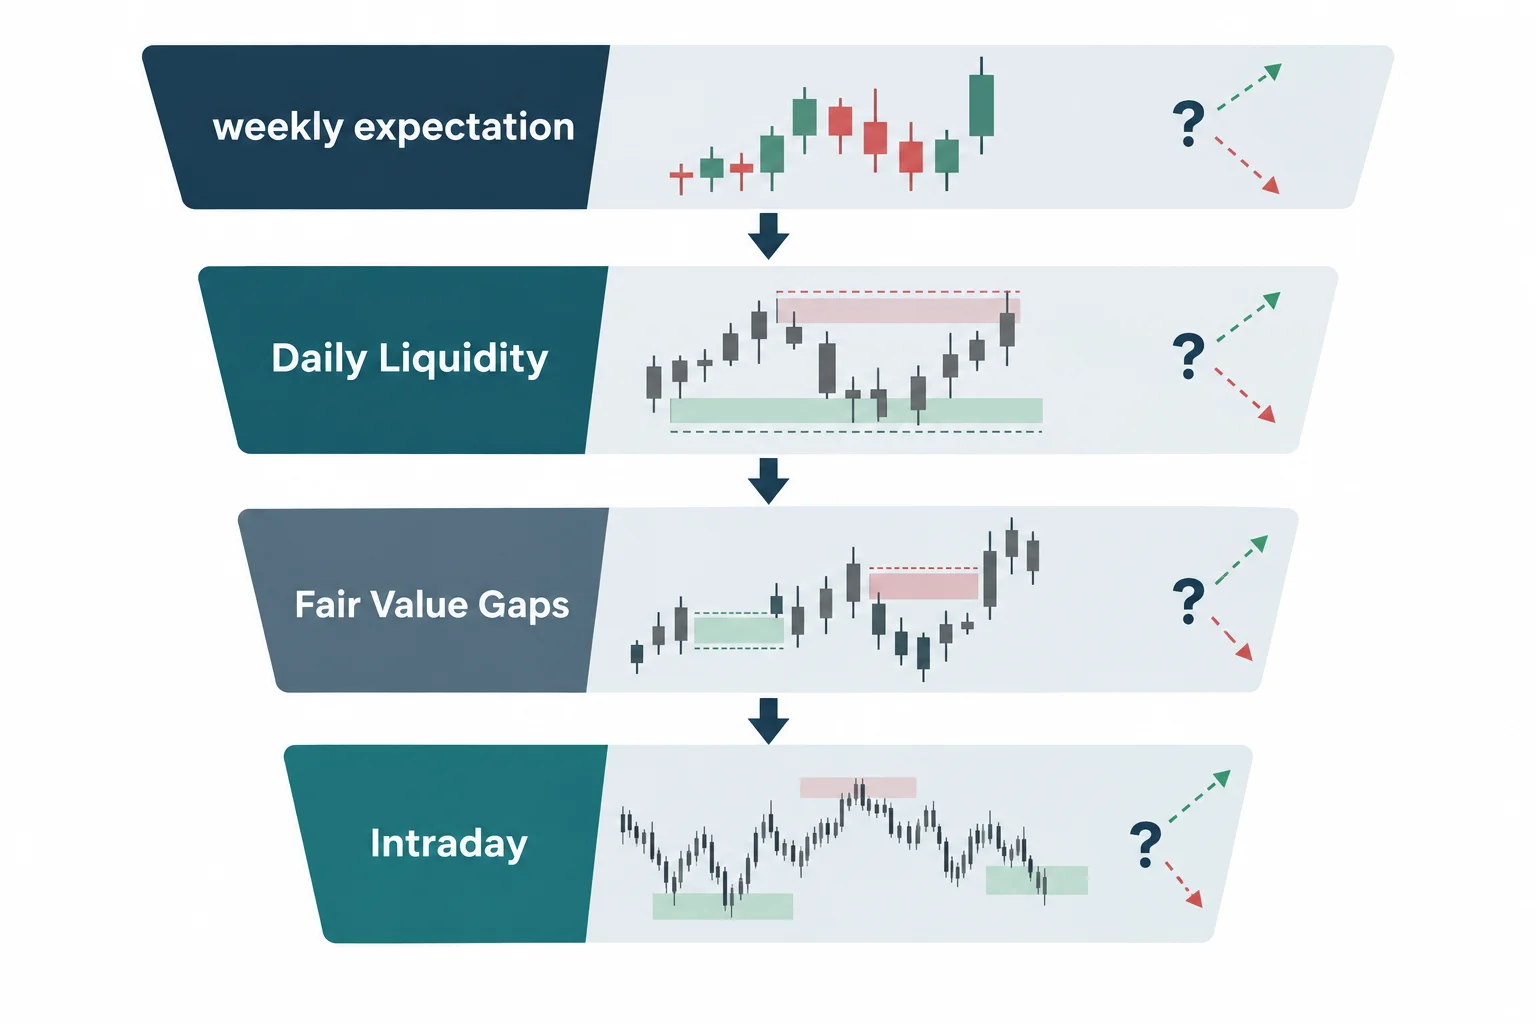
In 2022 ICT Mentorship Episode 2, ICT introduces what he calls the “elements to a trade setup.” The lesson focuses on intraday equity-index futures — primarily Nasdaq E-mini futures — and develops a top-down framework: establish a weekly directional bias, identify likely liquidity objectives on the daily chart, then look for a lower-timeframe structure break and price imbalance.
This is ICT’s interpretation of market behavior, not proof that markets follow the proposed model or that the setup has a dependable trading edge. The video repeatedly encourages practice with historical data or paper trading rather than immediately committing live funds.
2022 ICT Mentorship Lesson Goals
ICT establishes the mentorship’s focus at 1:00: futures-index trading presented largely through TradingView paper trading and hindsight study. Nasdaq is the main market, although he says the concepts may also be examined on the E-mini S&P and E-mini Dow.
Rather than teaching frequent entries for small movements, ICT says his objective is to find one comparatively substantial intraday price leg. He frames a setup as a collection of repeatable conditions rather than a signal to follow blindly. His stated educational goal is for students to analyze charts independently.
ICT Trade Setup From Weekly to Intraday
Build the ICT Weekly Trade Bias
Beginning at 12:42, ICT moves to a weekly Nasdaq futures chart. Before a new week begins, he suggests asking whether the next weekly candle is more likely to expand higher or lower. He emphasizes that this is not an attempt to forecast its exact closing price.
For the historical example shown, ICT describes a bearish expectation based on factors including seasonal tendencies, interest-rate discussion, earnings-related volatility and the broader tone he perceived in the market. Because the transcript cannot verify the displayed chart, these should be understood as his contemporaneous explanations rather than independently confirmed causes.
ICT also cautions against expecting a setup every day. His proposed objective is to capture a suitable move aligned with the weekly idea, not to force trades in every session.
Find ICT Daily Liquidity and Fair Value Gaps
At 16:34, the analysis shifts to the daily chart. ICT labels stops above prior swing highs as buy-side liquidity and stops below prior swing lows as sell-side liquidity. In his framework, price is commonly “drawn” toward either one of these pools or toward an imbalance.
He describes an imbalance as a price area where one single candle passes through without overlap from the adjacent candles — a “one single candle” move that leaves an unfilled gap. He calls this a fair value gap, a term he says he introduced in 2016. This is ICT’s terminology and analytical interpretation; the transcript does not provide comparative testing of the concept.
Refine the Trade Setup on Lower Timeframes
ICT uses the hourly chart to place daily levels into the context of the week. In the bearish example, he describes an overnight consolidation containing a short-term high and low. Price first moved below the short-term low and then above the highs.
From 20:39, ICT interprets that sequence as an initial inducement of short sellers followed by a run on buy stops. He argues that the buying generated above the highs offers counterparties for larger sellers. Claims in the lesson about algorithms, institutional intent and market manipulation are ICT’s explanations; the transcript alone cannot establish who placed the orders or why price moved.
On the 15-minute chart, he recommends marking these highs and lows while learning to keep the analyst oriented around the higher-timeframe thesis.
ICT Trade Setup Entry Model
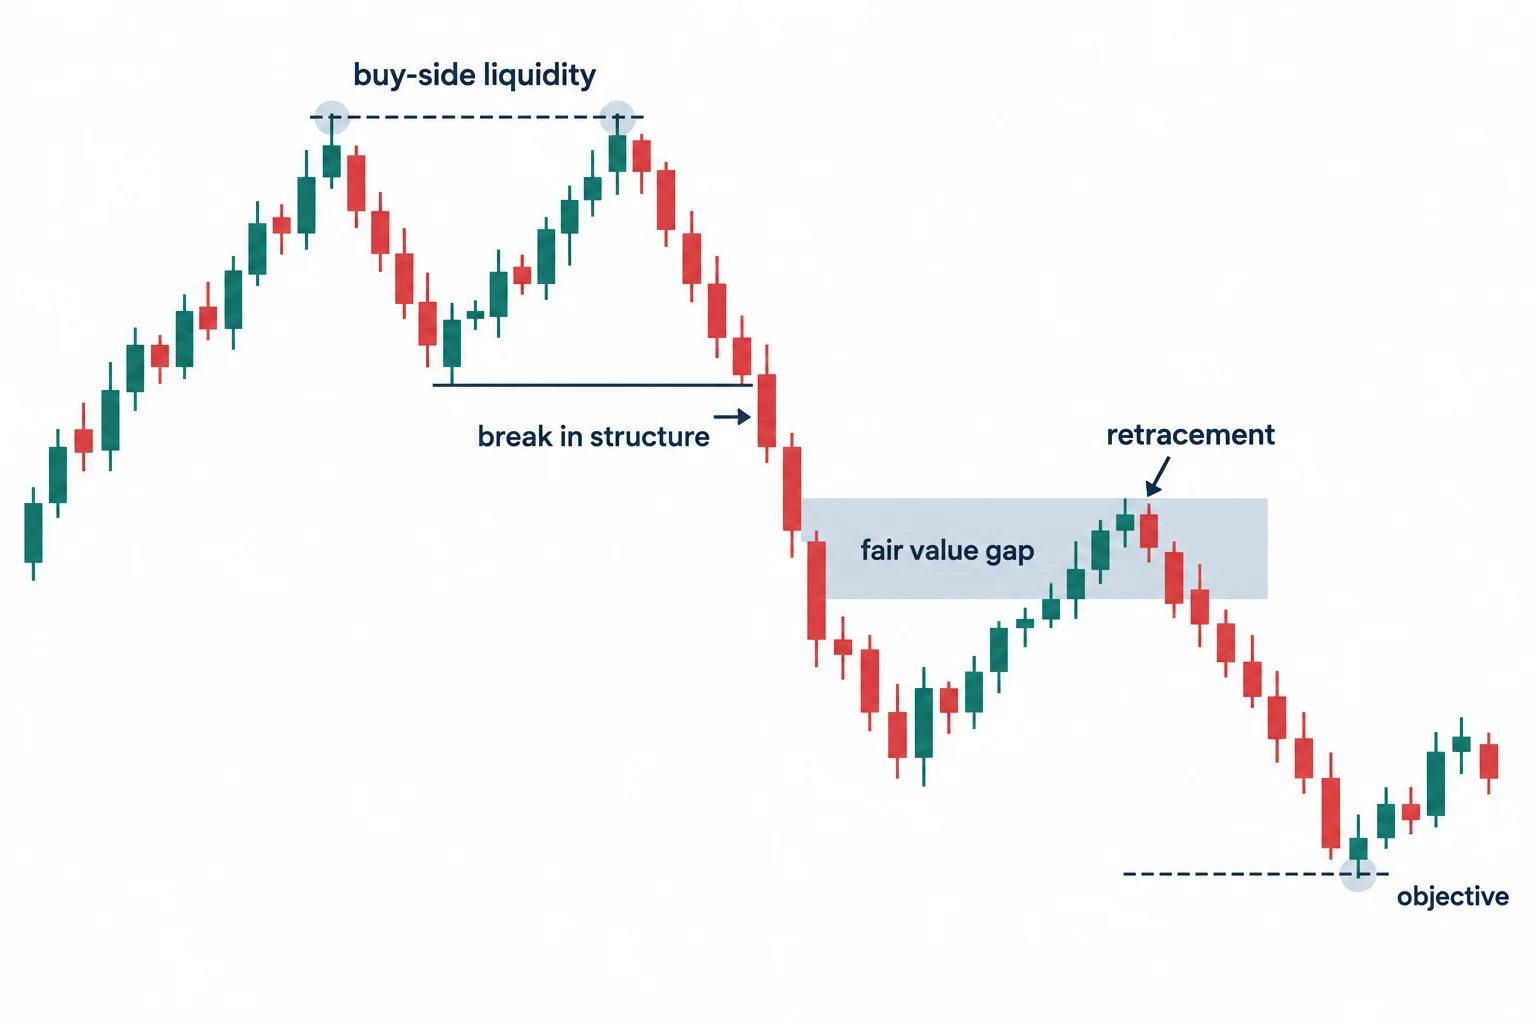
The specific setup appears on a two-minute chart at 26:36. ICT says one-, two- and three-minute charts can make small imbalances easier to identify in index futures. His bearish sequence can be summarized as follows:
- Begin with a bearish weekly expectation.
- Identify a run above a prior high or a cluster of similar highs — this takes out buy-side liquidity.
- Wait for price to break below a newly formed short-term swing low. He calls this a “break in market structure.”
- Mark the fair value gap created during that downward displacement.
- Watch for price to retrace into the fair value gap as a possible short-entry area.
- Use a nearby low, stop pool or opposing imbalance as the objective.
Importantly, he does not suggest selling merely because price moved above an old high; the lower-timeframe break and subsequent retracement into the gap are the additional conditions in his model.
At 31:56, he stresses focusing on the imbalance that forms after the market structure breaks. He discusses placing a protective stop above a nearby candle or swing high according to the trader’s risk parameters. He also warns that full-sized futures can move rapidly and cause substantial losses.
ICT Trade Objectives Using Premium and Discount
ICT introduces his “liquidity matrix” at 35:13. He divides the current high-to-low range at its 50% midpoint. In his vocabulary, prices above the midpoint are at a premium and those below are at a discount.
For a bearish setup originating in premium, he looks below the midpoint for the closest plausible objective — such as sell stops beneath an old low or a prior fair value gap. In the example shown, he says the decline both reached sell-side liquidity and filled a prior upward imbalance. The transcript reports his claimed entry and exit logic, but cannot independently verify chart prices, executions or the eventual outcome.
2022 ICT Mentorship Practice and Takeaways
The closing assignment begins at 46:22. ICT asks viewers to study historical E-mini futures charts and catalog cases where liquidity was taken in the direction opposite the weekly expectation, followed by a lower-timeframe structure break and fair value gap. He recommends recording the subsequent movement in a journal.
As a general study method, this can be treated as hypothesis logging rather than proof of profitability. Record examples that fail as well as those that appear successful, define every condition before reviewing the outcome, and avoid assuming that a visually persuasive historical example will behave similarly in live conditions. Futures trading involves meaningful risk, and this summary is educational rather than investment advice.
Resources
- 2022 ICT Mentorship Episode 2 on YouTube — Full original video (49 min)
- ICT Mentorship 2022 Playlist on YouTube — Complete series
- TradingView — Paper trading platform used throughout this lesson
- ICT Mentorship 2022: Introduction — Prerequisites video referenced at 0:26




