
Key takeaways
ICT’s 2022 Mentorship Episode 12 uses the March 2022 Nasdaq futures contract to teach advanced market structure through higher-timeframe objectives, imbalances, liquidity and invalidation rather than simple higher highs and higher lows.
Read the full summary
ICT’s 2022 Mentorship Episode 12 uses the March 2022 Nasdaq futures contract to teach advanced market structure through higher-timeframe objectives, imbalances, liquidity and invalidation rather than simple higher highs and higher lows. The daily chart defines directional context and a fair value gap, the hourly chart frames the setup and bearish order block, and the 15-minute chart supports execution. Swings are classified as short-term, intermediate-term or long-term, with a rebalanced imbalance creating a key intermediate-term swing that should remain intact while the thesis is valid. In bearish conditions, a rebalance high and subsequent short-term high should resist advances, while a violation weakens or invalidates the idea. ICT treats an intermediate swing that fails to exceed adjacent short-term highs as bearish weakness rather than a neutral triangle or pennant. His aggressive entry model uses a lower-timeframe fair value gap inside an anticipated hourly bearish order block without requiring a prior short-term-low break, while the confirmatory model waits for a break and return into the order-block area. Institutional order flow expects up-close candles to resist in bearish moves and down-close candles to support in bullish moves, though volatile delivery can exceed anticipated levels. The core process is to identify the daily objective, define the lower-timeframe swing that must hold and specify the event that invalidates the thesis. ICT ultimately remains neutral on the current Nasdaq chart because no clear one-sided view exists, emphasizing that uncertainty means no trade and that the examples provide education rather than verified results or guarantees.
How we researched this article
BestProps used document-based research from primary firm sources, checked September 25, 2026. The complete source list, scope, limitations, and commercial-state record appear near the end of this article.
In 2022 ICT Mentorship Episode 12, ICT presents an advanced interpretation of market structure using the March 2022 Nasdaq futures contract as his example. Rather than reducing structure to a sequence of higher highs and higher lows, he organizes price swings by their relationship to higher-timeframe objectives, imbalances and liquidity.
The lesson is deliberately technical. ICT cautions at the outset that viewers should not expect to absorb it in one sitting. His suggested learning process is to classify historical price action, study repeated examples and gradually develop familiarity with the terminology.
ICT Market Structure Starts With the Higher Timeframe
ICT begins the substantive explanation by asking what price is likely to seek next: liquidity above or below an established swing, or an area where a prior imbalance may be rebalanced. He introduces this framing at 5:28.
In his framework, the daily chart supplies the parent narrative. Lower-timeframe swings are subordinate to that premise. The example starts with a daily fair value gap, after which ICT moves to an hourly chart to classify the internal structure. He argues that a higher-timeframe level is useful not merely as generic support or resistance, but as a reference against which an analysis can be invalidated.
At 11:04, he explains that a high framed by the daily premise should remain intact under his bearish interpretation. If price were to break above it, he says that would be evidence his analysis was probably wrong. His response would be to seek more information, remain on the sidelines or accept a stopped trade as a risk-management event, not automatically declare the entire model invalid.
ICT Market Structure Swing Types
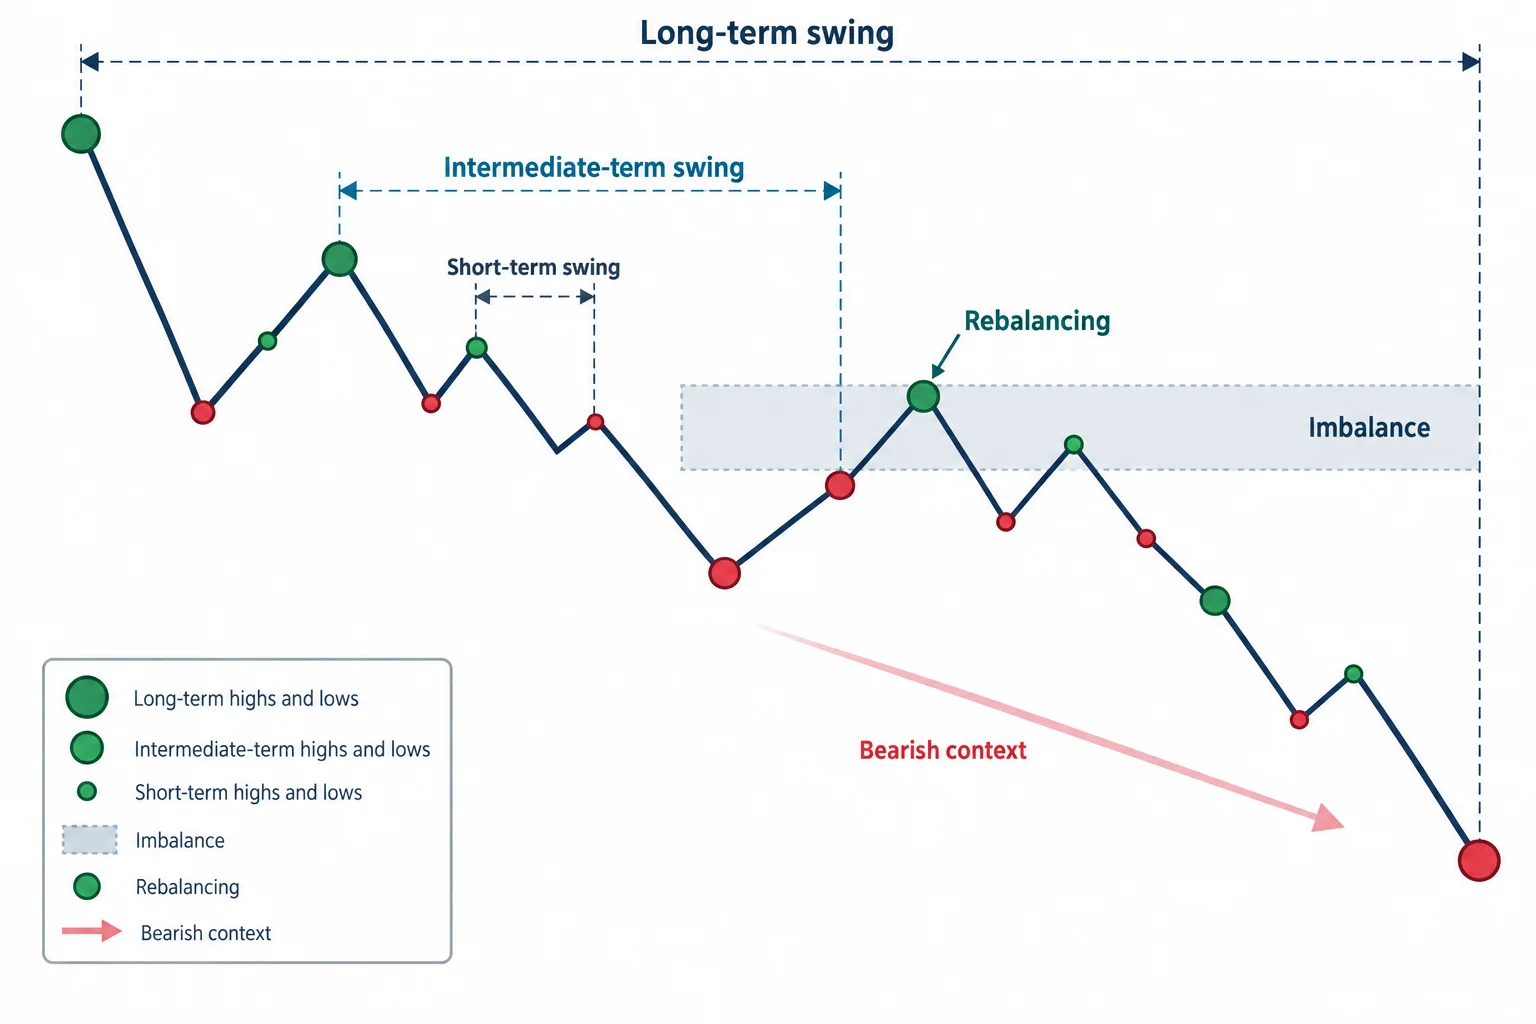
The lesson separates swings into three broad categories:
- Short-term highs and lows are the smaller local turning points.
- Intermediate-term highs and lows ordinarily sit between neighboring short-term swings, but ICT adds another classification based on the rebalancing of an imbalance.
- Long-term highs and lows frame the larger range and are linked to the higher-timeframe premise.
The central idea appears around 13:13: when price returns to rebalance an earlier imbalance, ICT mentally classifies the swing formed during that return as an intermediate-term high or low. In a bearish context, a rebalance that forms a high can become a key reference. He expects the following short-term high to remain beneath it. A move above that reference would weaken or invalidate the bearish interpretation.
ICT distinguishes this from mechanically labeling every minor pivot. The classification matters only when it is connected to the higher-timeframe narrative and the direction being evaluated.
ICT Market Structure And Unusual Intermediate Swings
A conventional intermediate-term high is higher than the short-term highs on either side. ICT focuses on a less conventional case beginning near 23:18: a swing created by rebalancing an imbalance may fail to rise above adjacent short-term highs.
Under his interpretation, that failure indicates weakness when the broader premise is bearish. Instead of treating the surrounding consolidation as a neutral triangle or pennant, he uses the failed swing and the rebalance as evidence favoring continuation lower. This is ICT’s market interpretation, not an independently established rule or guarantee about subsequent price movement.
ICT Market Structure With Top-Down Order Blocks
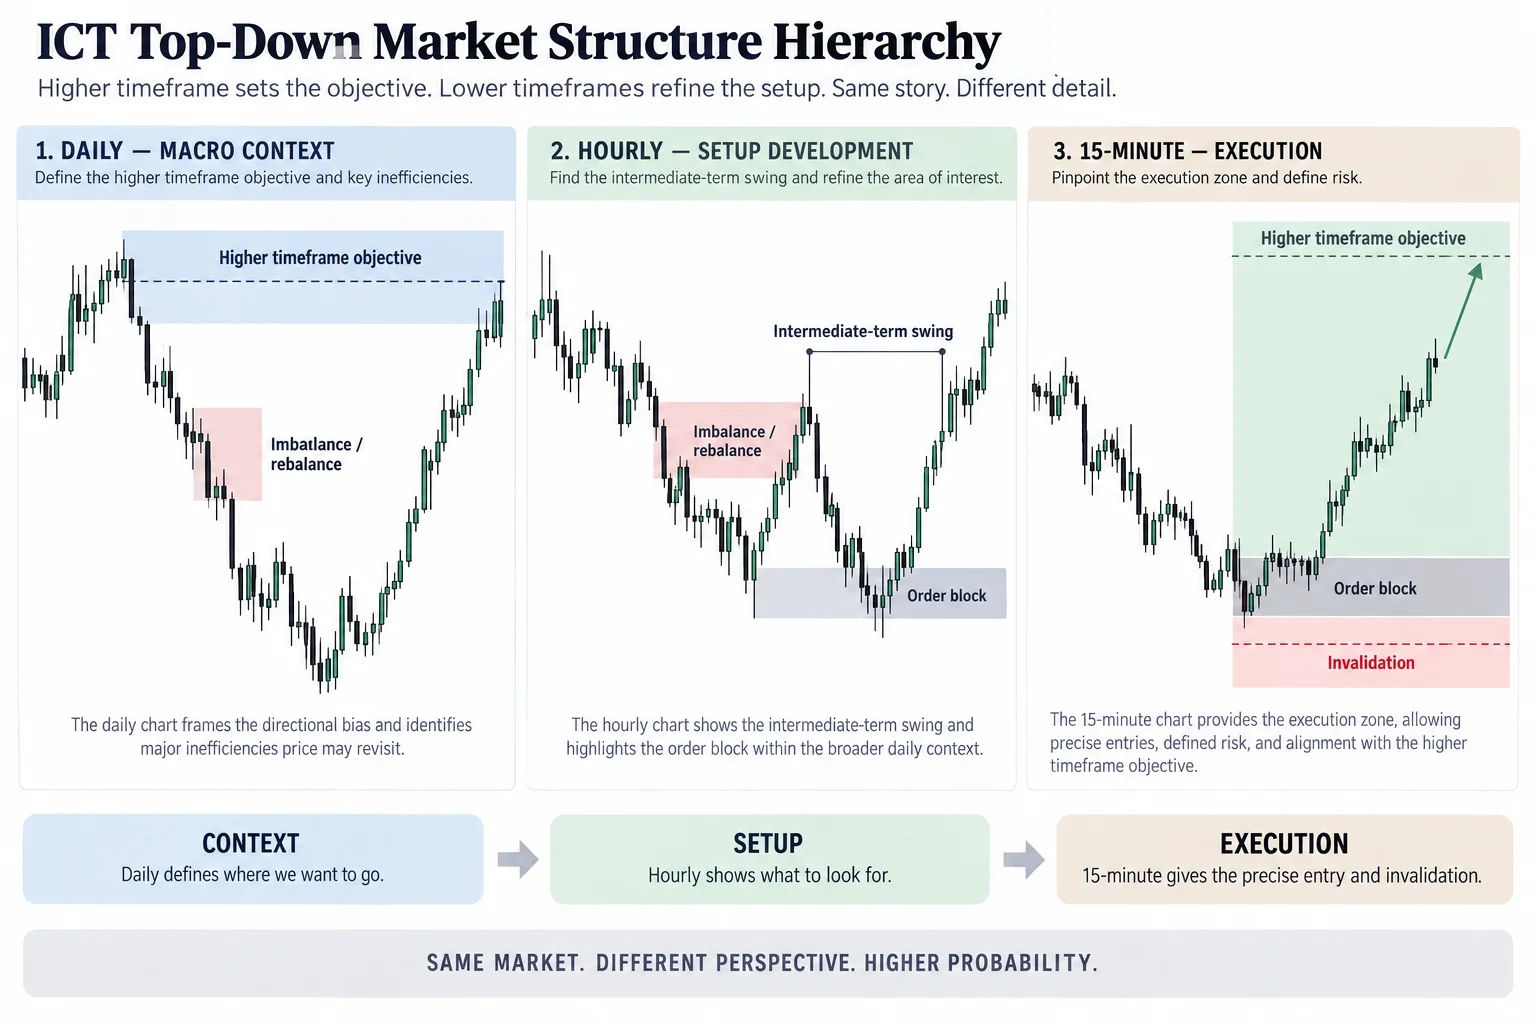
The example progresses from the daily chart to the hourly and then the 15-minute chart. ICT says the daily chart supplies directional context, the hourly chart frames the proposed setup and the 15-minute chart can be used to examine execution. He discusses this division of roles at 28:15.
He also gives a more specific definition of a bearish order block than the commonly repeated phrase “the last up-close candle before a decline.” In this lesson, he examines a consecutive series of up-close candles within an hourly range and then looks for lower-timeframe fair value gaps inside that range. Around 36:44, he describes an aggressive interpretation in which a lower-timeframe imbalance forms inside the anticipated hourly bearish order block.
Under that aggressive approach, he says a short-term low need not first be broken if the higher-timeframe structure already suggests weakness. He contrasts this with a more confirmatory approach that waits for a break and return into the order-block area. The transcript describes these as chart examples and conceptual entries; it does not document an actual fill, account statement or verified trade result.
ICT Market Structure And Institutional Order Flow
ICT uses “institutional order flow” to describe how candle groups should behave if a directional thesis remains intact. His summary begins around 48:19:
- In a bearish move, up-close candles should tend to resist later advances.
- In a bullish move, down-close candles should tend to support later declines.
- A key intermediate-term high or low created through rebalancing should remain unviolated while the thesis is valid.
These candle ranges may be revisited, but ICT distinguishes a revisit from a decisive violation. He also acknowledges that delivery will not always be exact and that volatile conditions can produce movement beyond an anticipated level.
ICT Market Structure Invalidation And No-Trade Decisions
The most broadly applicable educational point is the emphasis on invalidation. At 50:25, ICT summarizes that a rebalanced imbalance creates a key intermediate-term swing. If that swing is violated against the expected direction, the idea should be reconsidered rather than repeatedly forced.
Near the end, he applies that principle to the then-current Nasdaq chart and says he is neutral because he cannot justify a clear one-sided view. At 59:09, he explicitly says that uncertainty means doing nothing. This reinforces a recurring theme of the episode: having time available or a vague directional opinion is not, by itself, a reason to enter a market.
ICT Market Structure Learning Takeaways
A practical way to study this episode is to separate it into three questions: What is the proposed daily objective? Which lower-timeframe swing must hold for that premise to remain coherent? What observable event would invalidate the idea? That structure can make the lesson easier to review without treating ICT’s claims about algorithms, institutional behavior or market causation as independently proven facts.
This summary is educational commentary on the transcript, not investment advice. Historical chart explanations do not establish future performance, and no setup eliminates the possibility of loss.
Verified Source & Educational Resources
- Official YouTube Source: 2022 ICT Mentorship Episode 12 — Unedited lecture recording covering advanced market structure and swing classification.
- BestProps Research Library — Document-based evaluations of trading models and educational frameworks.




