
Key takeaways
In “Whats So Smart About My Concepts?” (published 12 August 2026), ICT reviews an NQ session built around an 8:30 CPI release and argues that his concepts are not “smart” because a shape appears on a chart, but because they are layered: he first decided where price was drawn to — Monday’s London-session relative equal…
Read the full summary
In “Whats So Smart About My Concepts?” (published 12 August 2026), ICT reviews an NQ session built around an 8:30 CPI release and argues that his concepts are not “smart” because a shape appears on a chart, but because they are layered: he first decided where price was drawn to — Monday’s London-session relative equal highs and lows — then selected a prominent price leg as a dealing range, graded that range with midpoint, quadrant and octant levels, waited out the release candle, and only then used an imbalance/inefficiency area, a bullish order block and later a bearish breaker as entry locations with structure-based invalidation. He states the weekly objective was met when price traded through both the equal highs and the relative equal lows, and he reports selling into the equal highs above the level he names as 29,984 on the 15-second chart. Everything about his own fills, his reported adverse excursion, his “six figures” week and his students’ earnings come from his own commentary; the transcript cannot verify charts, orders, fills or results, and the automatic transcription of specialised terms and numbers is imperfect.
How we researched this article
BestProps used document-based research from primary firm sources, checked September 14, 2026. The complete source list, scope, limitations, and commercial-state record appear near the end of this article.
Educational notice: This article explains a trading methodology for general educational purposes. ICT terminology does not guarantee predictive accuracy or profitable results, and leveraged trading around economic releases can produce rapid, substantial losses.
What the lesson actually covers
ICT opens by framing the review as a short one: NQ, one session, and the levels he had already published to his audience during the week. The whole recording is a single worked example on the one-minute and 15-second charts, not a tutorial sequence. He says he may or may not record an afternoon review, then goes straight to the levels — “Monday’s London session highs, the relative equal highs” — the area he had been describing as a likely draw since Monday’s close, and the relative equal lows on the other side of the market that he had said could also be taken. See 0:20.
He then states that because price has traded through both, “for me, the weekly range is fulfilled,” and that he does not care what PPI the next day or consumer-sentiment numbers on Friday do (0:49). That is his interpretation of the week, offered as a personal read rather than a market law.
One dating note: the watch page carries a publication date of 12 August 2026, and the recording itself does not state the calendar date of the session it reviews. It references an 8:30 CPI release that day, PPI the following day and consumer sentiment on Friday. The upload date is therefore not used here as evidence of the session date.
Why he starts with a target instead of an entry
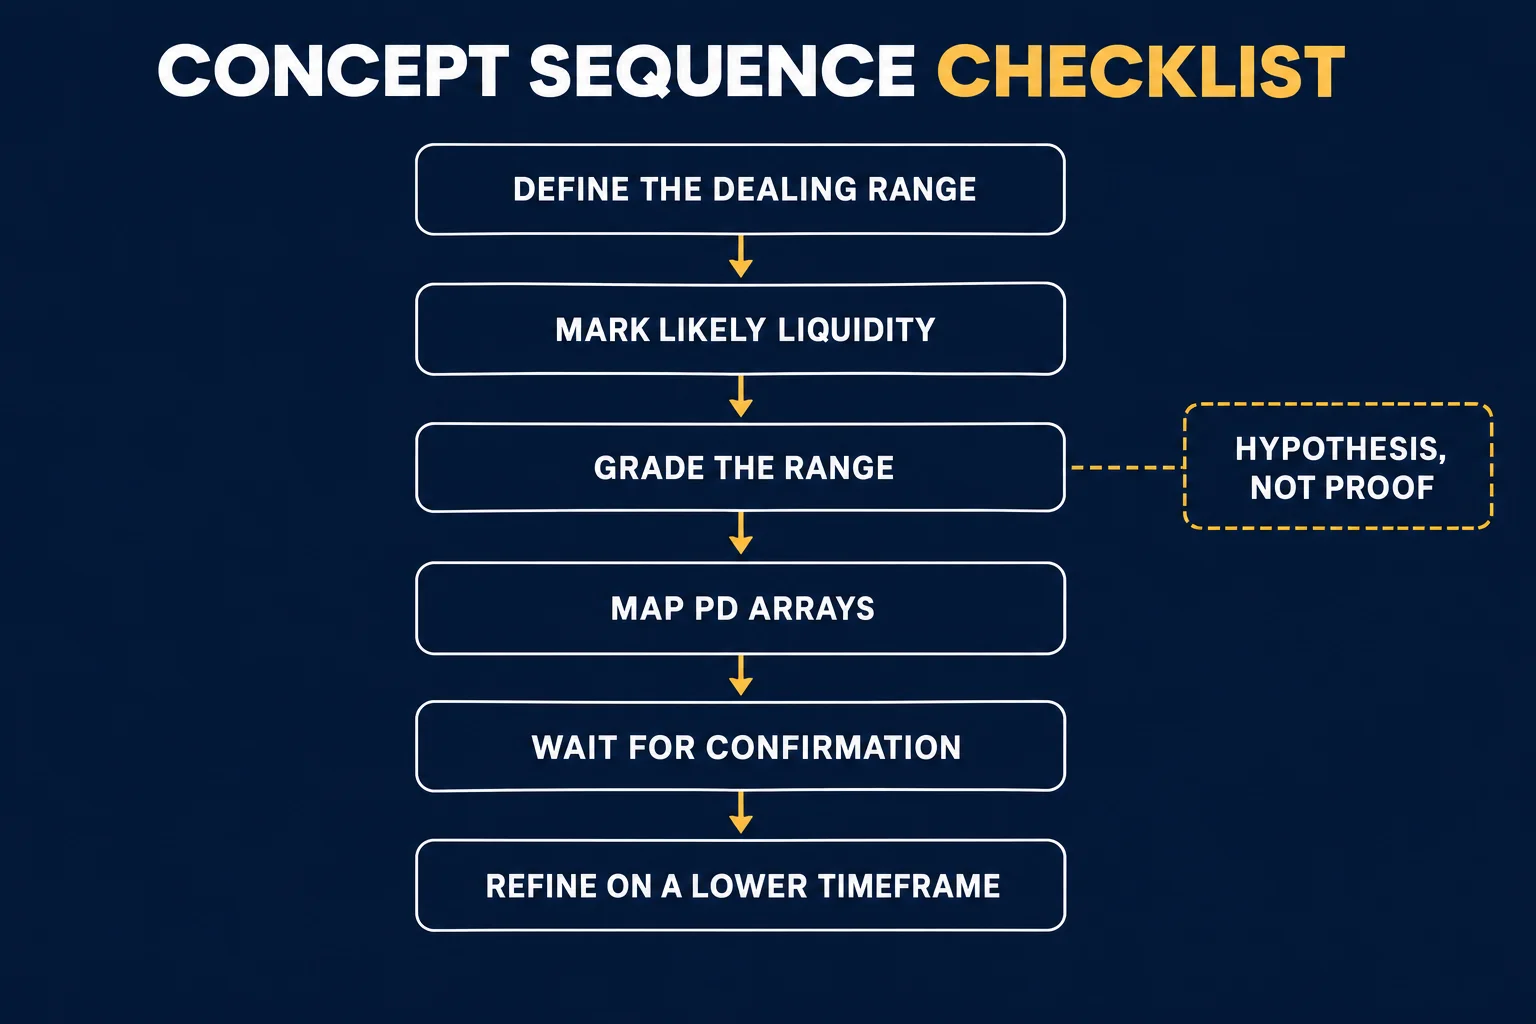
The first teaching point is about hierarchy. At 1:21 ICT picks the range he wants to trade inside — “this range here from this high down to this low” — and explains the choice by prominence: it “stands out,” it is “a very prominent price leg,” just as the leg from the low back to the high was. With a dealing-range high and low defined, he applies octants and quadrant levels to that swing, which is where he expects the price-delivery arrays (PD arrays) to form, and says a pattern forming at one of those divisions is treated as higher probability within his model (1:42).
He then separates the level from the operator. Graded levels do not remove the need to know where the market is drawn to: “the very first thing I teach is to know where the market is likely to go to or draw to… because if you don’t have that idea understood initially, everything you do afterwards is going to be incorrect” (2:14). This ordering — directional objective first, grading second, structure third — is the spine of the lesson.
Waiting out the 8:30 release candle
On the one-minute chart he shows the 8:30 candle that opened the CPI release. His instruction is blunt: you cannot participate in that candle. Anyone claiming a good fill on an 8:30 CPI or PPI candle was, in his words, “guaranteed” on a demo account, because limit orders are not respected and slippage is too large; he advises waiting a minute or two and looking around 8:32–8:33 for what the volatility left behind (4:06, 4:42).

The demo-account assertion is his categorical opinion, not something the transcript or the chart establishes. The practical content — that release-candle fills are unreliable and that a trader can choose to wait — is a statement about his own process and execution risk, not a tested rule.
The long: sell-side sweep into a discount array
He then drops to the 15-second chart “to illustrate the mechanics.” After price trades below the sell-side liquidity resting beneath nearby lows and dips into a discount array, he points to a candle he labels with his imbalance/inefficiency terminology — the area retail traders, in his words, claim does not exist (5:32, 6:04). Here the automatic transcript renders his wording unevenly (“buy side of balance sell side efficiency”), so the exact label is not reproduced as a quotation; the supported content is that he treats a specific small area left by the displacement as a bullish reference.
His reading of the sequence: sell-side liquidity taken, price inside a discount array, then the move he associates with an inverted fair value gap (7:12). He adds that what made the location credible to him was what price did not do — the deeper wick encroachment he was watching was not touched, which he reads as bullish real order flow.
He reports his own execution from there: a long flagged inside that reference area, with more added on the way (8:08, 8:51). Those are self-reported details; the transcript cannot establish his fills, size or account type. He also reports taking heat on the entry and states an adverse figure that the automatic transcript renders inconsistently (“824. About nine handles”), so the amount is not relied on here (9:03).
Why he expected two-stage delivery from CPI
The explainable part of the lesson is his argument for the target. He says CPI can deliver in two stages, “much like FOMC rate announcements”: an initial one-sided run that gets momentum traders comfortable in the wrong direction, then a reversal that returns to the higher low the move created, where their protective stops sit, followed by a push into the larger nearby liquidity pool — the Monday London-session relative equal highs (10:14, 11:02).
He then stresses what he had and had not given out: the high and low he was interested in for the week, and “nothing beyond that.” He notes he would have preferred price to trade back into an institutional order-flow entry level and that it did not, and that he was positioned anyway (11:26).
The short side: turning the run into a bearish breaker
After price trades above the level he names as 29,984 — the Monday London-session relative equal highs he says he had wanted to see run (13:26) — the second half of the lesson builds the short. Price drops back, fails to touch the new-week opening gap, fills an inefficiency, and breaks a structure he describes as high-low-high: two consecutive down-close candles taken together as one order block on the 15-second chart (12:40, 12:47).
Breaking beneath that range is what he calls validating it as a bearish breaker, and he is explicit that a breaker is, in his framework, a run on liquidity (13:48). His critique of retail practice comes here too: going short immediately at the low of the candle in a textbook break-and-retest takes unnecessary heat, because the location was never required to be entered that fast (14:01).
Instead he grades the array. The midpoint of an order block he calls mean threshold — at 14:29 the automatic transcript renders the midpoint term as “consequent encouragement” rather than encroachment — and the region between that midpoint and the low of the array is divided into octant and quadrant levels. He counts them off: mean threshold as one level, lower octant two, lower quadrant three, the next lower octant four, and the low of the bearish breaker as five (15:11). Any of those, he says, is a place to work an order rather than treating the whole pattern as an undifferentiated zone (17:00).
His stated preference is the lower half of the breaker — “VIP seating is conditioned by entering on the lower half” — and his invalidation reference is the high of the candle that created the displacement which broke the structure (17:58). That leads to the most transferable risk remark in the lesson: if the structurally correct stop is wider than the trader can tolerate, the answer is smaller size or lower leverage, “and that’s actually smart to do” — not a tighter stop invented for comfort (18:48).
He then describes price diving into the relative equal lows and back inside the new-week opening gap, and makes a point about his own terminology: these reference levels do not have a sell-by date, they are continually referred to rather than expiring after first use (19:14).
Wick grading, and what “smart” means in his usage
The final technical section grades a wick. He says he teaches grading the upper half of a wick for discount sensitivity, and points out where price was building bodies rather than running to the level a retail support definition would have used (25:23). He references one of those subdivisions as an octant on the wick; the automatic transcript renders the figure loosely (“point six to five”), so the precise fraction is not relied on here (26:19). He calls what follows a “bread-and-butter scalp on a 15-second chart,” which he says occurs many times a day (26:44).
By then the answer to the title question is explicit. What he calls smart is not a shape: it is the combination of a pre-committed directional objective, range-based location, a specific measurable level inside a PD array, a structure-based invalidation and size that fits the stop. His contrast with conventional support and resistance lands at 22:24, where he says the exercise “has nothing to do with support and resistance” — while also allowing that a trader with sound money management can make money on 30–40% win rates (22:45).
What the recording does not establish
ICT makes a series of claims that the transcript cannot support. He says people calling these concepts fake are “silly,” and that his students around the world are making money with them (20:09). He later says he has students running around 50%, “sometimes 55%” strike rates who have “made millions of real dollars, not paper trading” (23:24). At the close he says he is finished for the week and that “if you were doing the math you’d see six figures” (27:18).
None of that is audited here, and the transcript shows no account statements. Read the lesson as a narrated case study in one operator’s process, not as evidence of profitability or of a repeatable edge. The same applies to the on-chart execution markers: whether a marked arrow corresponded to a real fill, at what price and in what size, cannot be determined from the spoken audio, and no chart detail is asserted in this article as independently observed.
A second limit is the source itself. The transcript used for this article was produced by automatic speech recognition on the full original audio, not by human-verified captions: timestamps are approximate, and specialised vocabulary and numbers are exactly the kind of content such systems misrecognise. Where a term or figure was ambiguous, this article says so instead of normalising it.
Frequently asked questions
What does ICT mean by “smart” concepts? In this lesson, smart refers to the order of operations and the specificity of the level, not to the concept itself. A midpoint, breaker or imbalance is treated as useful because it was derived from a chosen range and a directional objective, and because it comes with a defined invalidation (2:14).
Why did he call the weekly range fulfilled? Because price had traded through the Monday London-session relative equal highs he had marked as a draw and through the relative equal lows on the opposite side of the market. In his words, that completed the range he was interested in for the week (0:20, 0:49).
Should you copy the reported trade? No. The entry locations, the reported adverse excursion, the outcome and the “six figures” remark are the speaker’s own account of his own session. The lesson’s transferable content is the grading and invalidation logic, and even that would need written rules and independent testing before it means anything about results.
Why is there no embedded player on this page? Because the source video’s own player reports that playback on other websites has been disabled by the video owner. That was tested from this site’s origin on 14 September 2026; the watch card below links to the recording on YouTube instead.
Related source video: Whats So Smart About My Concepts?
The mapped source for this article is Whats So Smart About My Concepts? on the channel The Inner Circle Trader. This BestProps page is independent educational commentary: it is not a transcript, not an official ICT lesson, and not evidence that any range, level or sequence described in the recording occurred as described.
Watch the original lesson on YouTube
This video cannot be played inside another website: the embedded player itself reports “Playback on other websites has been disabled by the video owner.” That response was read from the player on 14 September 2026, so no player is reserved here and no embed is left blank. The lesson is available directly on YouTube.
Sources for this lesson and for the rules that apply to a funded account
Four references support this article: the source recording, the drawdown comparison page this site maintains for funded accounts, and two platform help pages on chart intervals and chart replay.
The mapped upload Whats So Smart About My Concepts? was read directly for this article: at the time of the check the watch page was public, not unlisted, credited to The Inner Circle Trader, carried a publication date of 2026-08-12 and a length of 1,662 seconds, and the full original audio of that recording is what the transcript used here was produced from.[1] The page metadata settles the identity, duration and visibility of the upload; it does not settle the trade results discussed in the recording, and the automatic transcript cannot verify what was displayed on screen.
The BestProps page Prop Firm Drawdown Rules Explained compares static, trailing, intraday, end-of-day, daily and balance-based drawdown calculations across named programs and links the provider documents it used. Read its own disclosure: its stated sources were checked on August 1, 2026 and the page labels itself stale and asks readers to recheck before relying on it; it also states plainly that the comparison is not a universal ranking, that drawdown methods vary by firm, program, stage, account size and platform, and that the page reports no first-hand account purchase, trading or payout testing.[2] Your own dashboard and the provider’s current document are final.
Two TradingView help pages are directly relevant to studying a session like this one without hindsight. The time intervals guide explains that an interval determines how much time each bar or candle covers, how to choose and customise an interval, and how intervals relate to trading hours.[3] The Bar Replay help page documents opening the replay panel from the chart, selecting a starting point, and playing forward at an adjustable speed — which is the only way to test how much of this lesson’s structure was identifiable in real time.[4] Neither page is about ICT methodology, and replay still cannot reproduce real fills, spread, slippage or order latency.
Sources
- [1] YouTube: Whats So Smart About My Concepts? – The Inner Circle Trader (source recording; page metadata and player embedding status checked 2026-09-14)
- [2] BestProps: Prop Firm Drawdown Rules Explain Limits and Restrictions (document-based comparison; page states sources checked 2026-08-01 and labels itself stale)
- [3] TradingView Help: Time intervals – a quick introduction and tips (platform documentation for chart intervals)
- [4] TradingView Help: How do I turn Bar Replay on? (platform documentation for step-forward replay)
Timestamps cited in the body refer to the source recording; they are derived from automatic speech recognition of its audio and are approximate to within a few seconds. BestProps is not affiliated with The Inner Circle Trader or with TradingView, and no source listed here endorses this article, this site or any setup. Dealing range, liquidity, premium, discount, PD array, displacement, imbalance, inefficiency and breaker are used on this page only as descriptive study terms. Nothing here demonstrates a tested, repeatable or profitable result, and no claim is made that any level, array or sequence predicts price or was verified on a live account.





