
Key takeaways
This is lesson eight of ICT’s January 2017 mentorship, and the subject is position trade management 0:15.
Read the full summary
This is lesson eight of ICT’s January 2017 mentorship, and the subject is position trade management 0:15. He is not trying to pick an absolute high or low: he wants to be in sync with a quarterly shift that develops over roughly three to four months and to take the middle of that move 3:48. The sequence runs seasonal tendency first, then intermarket confirmation across the stock market, interest rates, commodities and currencies, where he says three of the four agreeing is enough 2:34, then monthly and weekly premium/discount arrays — his PDA, meaning order blocks and the other institutional reference points 2:51 — and finally a daily entry framed by daily order blocks, voids, gaps, rejection blocks, breakers and mitigation blocks 3:59. He then chooses between a limit and a stop order, and states a maximum account risk of one percent 5:13, taken on a large time commitment rather than a large allocation 5:17. The initial protective stop trails the extreme of the last 40 trading days, which he says comes from his IPDA data ranges and is deliberately wide so that an ordinary retracement does not remove the trade 6:00. As the move matures the lookback tightens to 20 trading days, but the two directions are described differently: the bearish walk-through keeps the 40-day extreme through the halfway point and switches at about three quarters 13:36, 13:57, while the bullish walk-through and the bullish example switch above the halfway point 7:48 and the same bullish passage also keeps 40 days at exactly 50 percent 7:12. The worked chart example quotes a bearish order block open the captions carry as 121.69, and he counts roughly eight units of a 260-pip risk to the objective 17:46, 20:51; those are retrospective teaching illustrations, not verified fills, and the recording supplies no documented results, no account loss limits, no position-sizing arithmetic beyond the one percent ceiling, and no transaction costs.
How we researched this article
BestProps used document-based research from primary firm sources, checked September 17, 2026. The complete source list, scope, limitations, and commercial-state record appear near the end of this article.
What this lesson is trying to capture
The recording opens by identifying itself as lesson eight of the January 2017 mentorship and naming its subject as position trade management 0:15. He then defines the target explicitly: he is not attempting to pick the absolute low or the absolute high, but to get in sync with what he calls a quarterly shift and to collect the largest part of the move in between 3:48. The horizon he gives for that swing is roughly three or four months, which is why the charts he works from are the monthly, the weekly and the daily rather than anything intraday 3:31.
The video published under this topic is titled ICT Mentorship Core Content – Month 05 – Position Trade Management and its watch page lists an upload date of 18 September 2022, while the speaker opens the recording as the January 2017 mentorship material. Those are two different things — a publication date and the date of the teaching being re-released — and nothing in this article should be read as placing the lecture itself in 2022.
Stage one: a seasonal tendency, then intermarket confirmation
For bullish conditions he starts from seasonal tendencies, focusing on the ones he expects to be most likely over the next three to four months 1:02. He is careful about what that means: in his own words the seasonal read is not a panacea, only a rule of thumb and a roadmap for what may unfold in price, and the fact that something has repeated for more than 40 years does not mean it will happen this year or three years from now 0:36, 0:46.
Next comes intermarket confirmation 1:21. He gives interest-rate yields particular weight, saying that rising yields are supportive of the currency being traded and that divergence between yields may suggest a shift or a pause in the market’s underlying direction 1:48. The wider check blends yields with the four major asset classes he names — the stock market, interest rates, commodities and currencies 2:11 — and he says all four should confirm the general outlook, though if three of them point the same way as the directional bias he considers that a reasonable basis for a trade idea 2:34.
The bearish half of the lesson mirrors that order: a bearish seasonal tendency first, then the same intermarket agreement across the four asset classes, and the same question about whether yields are consistent with the expected quarterly move 9:02. He notes that he could have saved the slide and simply reversed the bullish bullets, and then walks the bearish version for completeness 8:32.
Stage two: map the higher time frames, execute on the daily
With a directional case in place he moves to the monthly and weekly charts for what he abbreviates as PDA. He defines the term in the recording: PDA is the premium/discount array, which for him covers the order blocks and the other institutional reference points he uses 2:51. The higher time frames are there to show where those reference points sit, so the daily chart knows what it is working towards 3:20; the daily is then the chart that frames the actual setup.
On the bullish side the daily arrays he lists are order blocks, voids and gaps, rejection blocks, and prior highs or lows 3:59. When those align with the higher-time-frame reading, the intermarket check and ideally a seasonal tendency, he describes the result as a large set of confluences and a high-probability scenario 4:29. On the bearish side the same inventory appears with the orientation reversed: bearish order blocks, bearish liquidity voids that price may fill, old highs to sell above, rejection blocks above the bodies of old up candles, bearish breakers to trade into, and mitigation blocks to trade against 10:48. Mapping the higher-time-frame objectives first is what keeps those from being surprises later; he calls them either speed bumps or rocket fuel for the next leg 10:09.
He frames the whole exercise around a quarterly shift, an intermediate swing he expects to run two to three months and at most about four 10:28. That expectation is his, not a measured frequency, and the recording offers no sample, no backtest and no comparison of aligned quarters against unaligned ones.
Choosing between a limit and a stop order
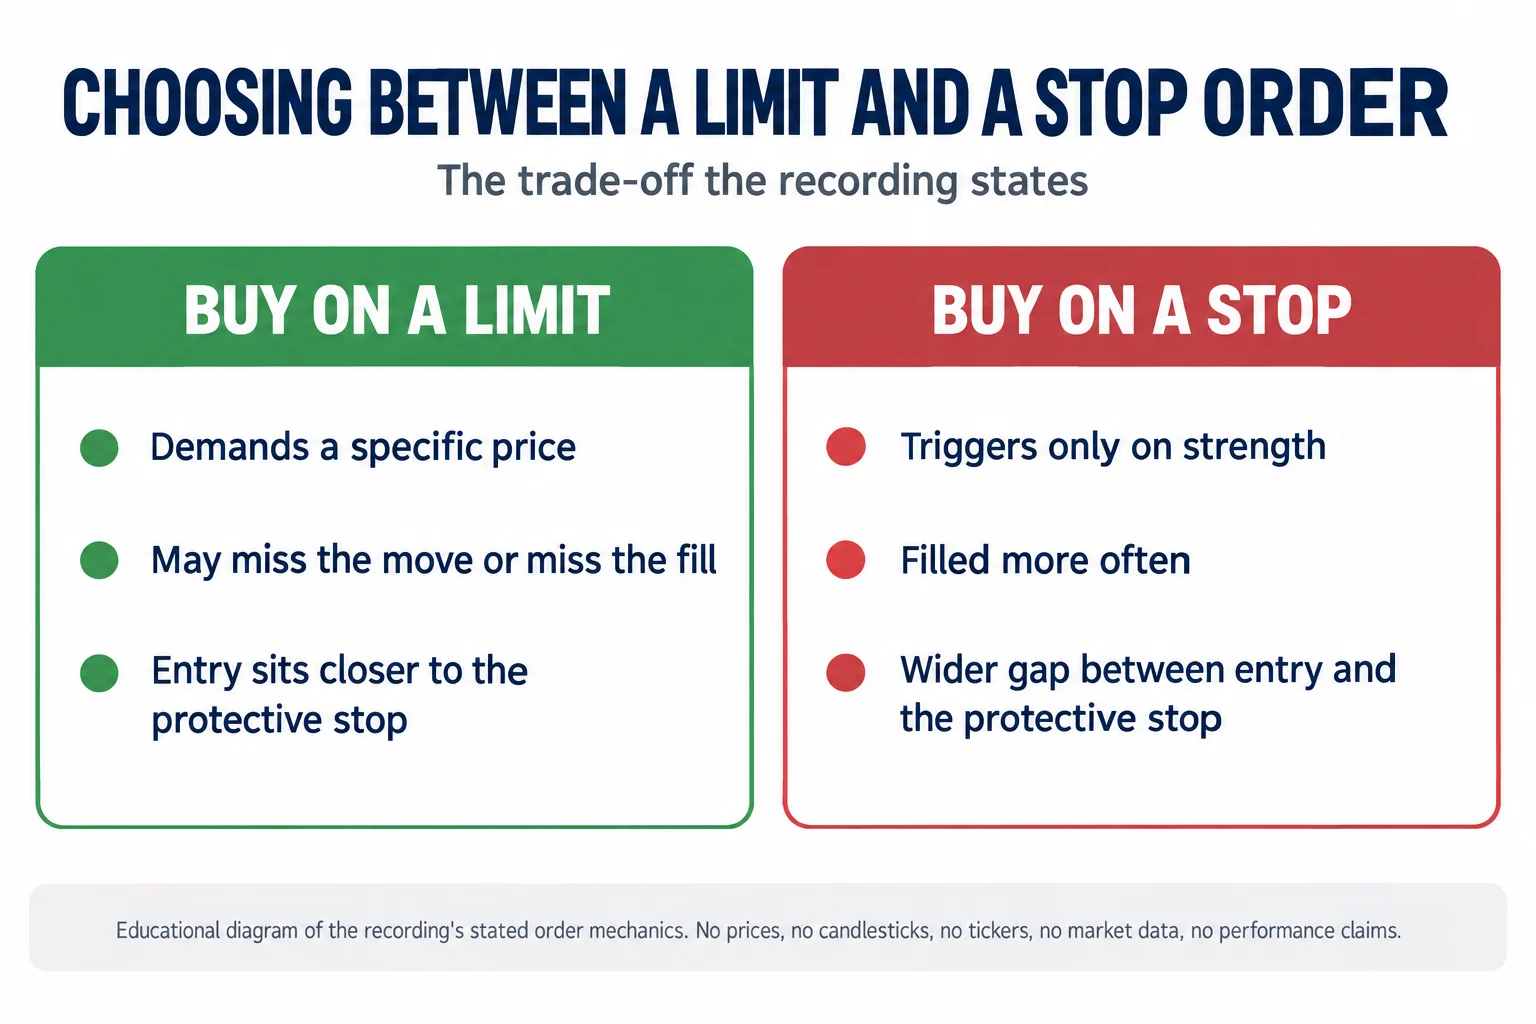
Once a setup is framed he says the next decision is personal preference: buy on a stop or buy on a limit 4:37. He is explicit about the trade-off. A limit order demands a specific price, so there is a real chance of missing the move or missing the fill 4:50; a buy stop is filled more often, but because it triggers on strength it leaves a wider gap between the entry and the protective stop 4:59. The bearish version is the same choice between selling on a limit and selling on a stop, with the same warning that a limit may go unfilled and that a stop sale on weakness widens the risk to the stop 11:26. Those are his descriptions of order mechanics; the recording does not discuss slippage, spreads or commissions.
Risk at one percent, and the 40-day initial stop
His stated risk ceiling for this approach is no more than one percent of the account 5:13, and he pairs it with a distinction he repeats: take a large position in terms of the time the trade is held, not in terms of how much of the account is allocated 5:17. The intended shape is a large move captured with a small slice of the account, so the risk stays reduced while the pip distance travelled does not have to be huge in percentage terms 5:32.
Entry triggers a deliberately wide protective stop. For a bullish position it trails below the lowest low of the last 40 trading days 5:48; for a bearish position it trails above the highest high of the last 40 trading days 12:07. He ties the number to his IPDA data ranges and explains the logic as liquidity rather than arbitrary distance: a rising market is not likely to travel 40 trading days back to find a low, so it is far more likely to be reaching for the highs inside that same window 6:00. The practical result is a stop sitting well behind the current price that requires a significant move to trigger, which is exactly the point — he does not want the position removed before the anticipated higher-time-frame swing develops 6:19.
He is equally direct that this is not a tight trailing method. Long-term trades have to be given room to gyrate and to pull back against the position, at least initially, and he says that will not suit every temperament 6:42. He also argues against rushing a long-term trade to break-even, calling that one of the worst things to do on this time frame 13:19.
As general risk arithmetic rather than something the recording works through, a wide stop and a fixed percentage ceiling are linked: the distance from entry to invalidation, multiplied by position size, is what turns that one percent into a monetary amount. The recording states the ceiling and the stop rule but never does that calculation, and it does not address gaps or overnight moves that could exceed the intended loss.
Tightening to 20 days, and where the two directions disagree
The tightening rule is where the lesson stops being symmetrical. In the bullish walk-through he says that when price has moved about 50 percent of the range he expects on the monthly or weekly chart, he is still looking at the lowest low of the last 40 trading days 7:12. Immediately after that he adds the next step: once price is above 50 percent of the range he looks to the lowest low of the last 20 trading days, and at about three quarters of the way he wants the stop below the most recent low of the last 20 trading days 7:48. His worked bullish example says the same thing in simpler form — before the halfway point the reference is 40 trading days back, above it the reference is 20 23:59.
The bearish walk-through is more conservative. At 50 percent of the expected range he says the stop is still the highest high of the last 40 trading days 13:36, and only at about three quarters does he drop the lookback to the highest high of the last 20 trading days 13:57. His reason is explicit: if the last three quarters of a move have been seen and the stop is still sitting at the 40-day extreme, a deep retracement can turn into the reversal he did not expect, and he points to optimal trade entry style moves that can reach roughly 79 percent of the expected distance and then fail 14:21. Cutting the lookback to 20 trading days — again drawn from his IPDA data ranges 14:44 — pulls the stop closer only after the move is mature enough to justify locking some of it in 14:58.
Put plainly, the recording describes the bullish switch at or just above the halfway point and the bearish switch at about three quarters, so it does not support one universal threshold for both directions. It also contains a smaller internal wrinkle in the bullish passage itself, where the same explanation keeps the 40-day reference at 50 percent and moves to 20 days above it. This article states both as the speaker’s instructions rather than resolving them into a single rule, and a reader following the method should expect to decide which of his two bullish thresholds they are applying.
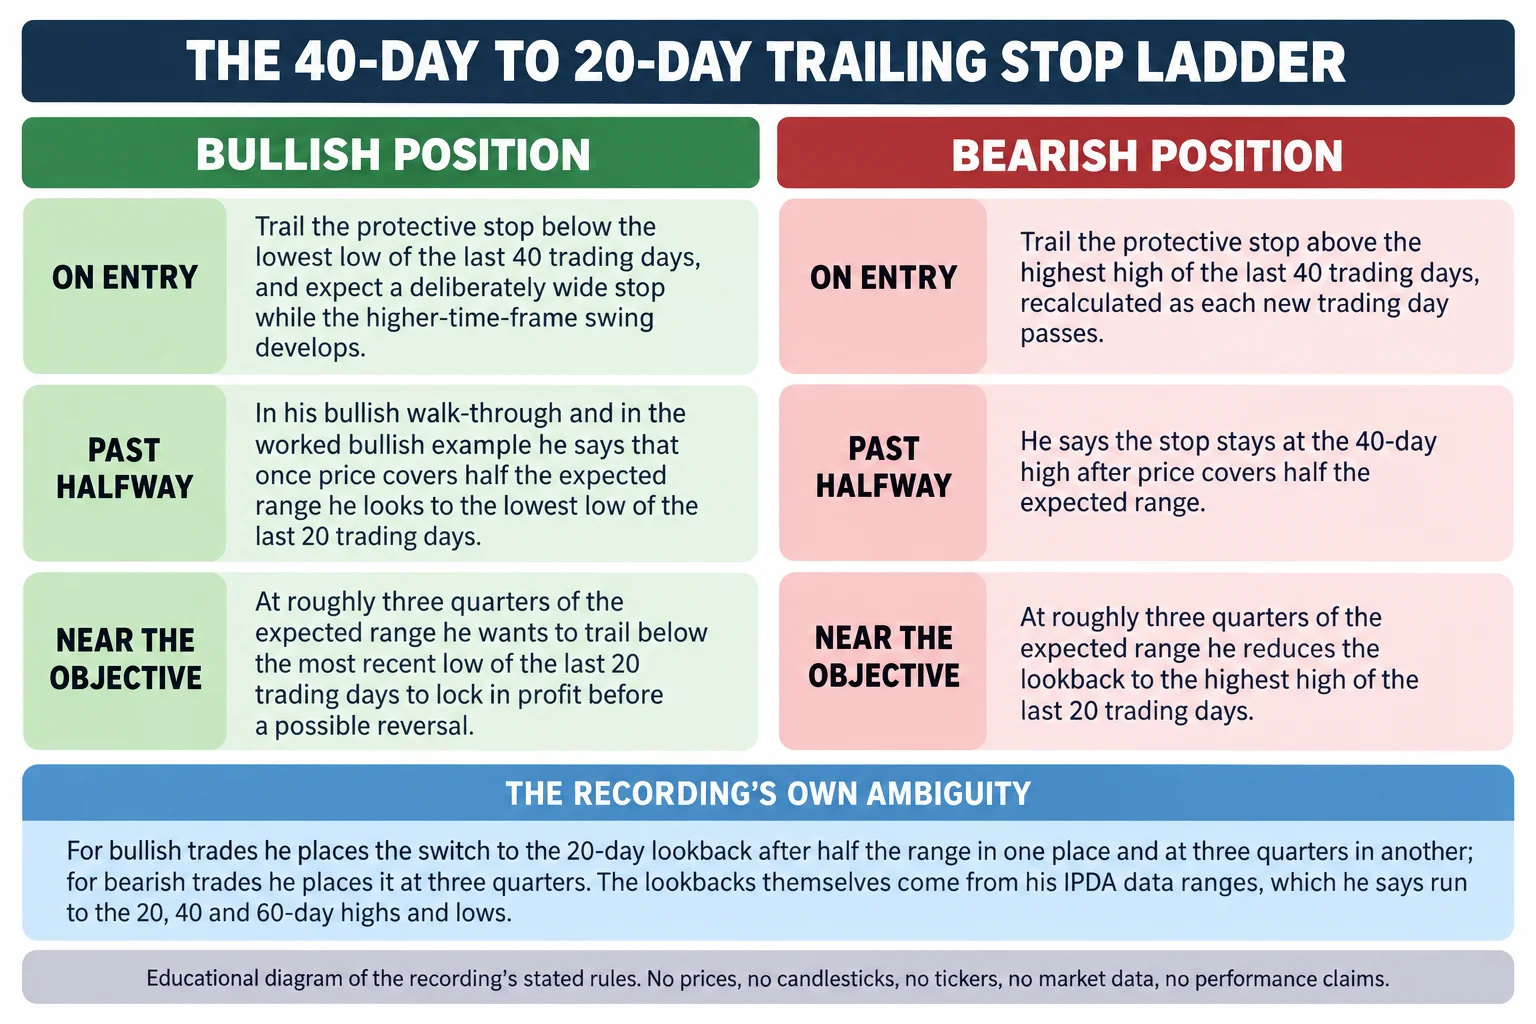
He also notes that the 20, 40 and 60-day highs and lows are the data-range lengths he works from, and that above the 40-day highs and the 20-day highs the next liquidity reference is the 60-day high 25:21.
The worked examples, and what they do not establish
The demonstration begins on a weekly chart the automatic captions render as “the Japanese Genesis”, with equal lows he says were discussed in the live mentorship sessions and a bullish order block sitting beneath them 16:04. He adds a Fibonacci to grade the scale of the whole range from its high to its low, which gives him a range floor, a range ceiling and an equilibrium level in between 16:22. Because the caption track garbles the instrument name and the recording’s charts are not visible in a transcript, the specific market should be checked against the video; the price levels he speaks aloud are quoted below exactly as the captions carry them.
He starts with the sell side. After a break in market structure and a rally, he marks the last up candle as a weekly and daily premium array and a bearish order block, and notes that price traded into the body of that candle, whose open he reads as 121.69, with the candle’s high only about three pips above it 17:44, 17:48. He then weighs selling on a limit above the close against selling on a stop lower down 18:09, and either way the protective stop is placed above the highest high of the last 40 trading days measured back from the trade day 18:25. He illustrates a 250-pip stop sitting about 260 pips above, acknowledges that will look alarming on a long-term trade, and then counts roughly eight units of that risk as price works down to his objective, calling eight times 260 pips a huge move and noting the count falls short of nine 19:00, 20:25. As the trade progresses he re-reads the highest high of the previous 40 trading days each day and keeps the stop above it, including through the deep retracement he points out on the way to the objective 21:08.
The buy side uses the same chart: the weekly bullish order block below price, the weekly bearish order block as the upside objective, and a protective sell stop beneath the prior lows 22:19. He notes a buy illustration that ran into the wild whipsaw around the election, and says that with the stop under the 40-day low the position would not have been knocked out through it 22:43. He cites a low the captions carry as 109.19 at that point, then repeats that the reference stays at the lowest low of the last 40 trading days until price covers half the range, at which point he switches to a 20-day lookback and, at the objective, reaches the weekly bearish order block 23:42.
Every figure in that walk-through — the 121.69 open, the three-pip distance to the high, the 260-pip stop, the eight-unit count, the 109.19 low — comes from what the speaker says while pointing at his own charts. The captions cannot confirm the chart plots, the fills, or the outcome, and this review did not view the recording’s visuals. They are teaching illustrations, so they should not be read as documented trades or as evidence the method is profitable.
How the process reads, and what it leaves out
Stripped of his labels, the structure is: decide a higher-time-frame objective, cap the money at risk, enter on a pullback into a mapped area rather than into the impulse, and hold a wide stop that only tightens once the move has proved itself. A mechanical lookback has the virtue of removing day-to-day discretion from stop placement, and the recording is consistent that premature exits are the failure mode it is designed to avoid.
The gaps are worth stating as plainly as the rules. There are no documented fills, no verified results, no stop-placement detail beyond the two lookbacks, no worked position-sizing arithmetic under the one percent ceiling, no account loss limits, no transaction costs, no maximum number of attempts, and no comparison between trades taken with the intermarket confirmation he asks for and trades taken without it. His own risk statement is a ceiling, not an expectancy, and his eight-unit count is a chart-side estimate rather than a performance figure. Nothing here is investment advice, and the one percent ceiling is his rule for this method rather than a limit that makes any single trade safe.
Watch the original recording
ICT Mentorship Core Content – Month 05 – Position Trade Management
The Inner Circle Trader · watch page lists upload 18 September 2022 · about 25 minutes 45 seconds. The speaker opens the recording as lesson eight of the January 2017 mentorship. This recording is the primary source for every timestamp link above.
The recording is not embedded here because this upload cannot be played inside a third-party embed. That was tested directly on 15 September 2026 from a BestProps page origin: the embedded player loads and then stops at a surface reading “Video player configuration error” with error code 153, offering a prompt to watch the video on YouTube instead, with no duration and no playback progress, while the video itself plays normally on YouTube. No half-working player is left on this page.
The watch page was read on 15 September 2026 and is publicly listed as ICT Mentorship Core Content – Month 05 – Position Trade Management by The Inner Circle Trader, upload date 18 September 2022, not private and not unlisted, with a listed duration of 1,544 seconds — about 25 minutes 45 seconds, which agrees with the caption track used here to within a second.
A note on the captions
This article was written from the automatic YouTube caption track, which is machine generated and mishears several terms in this recording. The topic itself is rendered once as “possession trade management” before the word position appears correctly 0:22, and the phrase he uses for a cure-all is rendered as “a Beyond” before “not a Panacea” appears in the same passage 0:36. The data-range framework he calls IPDA appears as “the ifta data range” and once as “ipta procedures” 6:00, 14:44. “Pip” comes through as “pit” and once as “foot” 7:30. “Order block” is sometimes “ore block”, “old lows” appear as “hold lows”, and “bearish order block” is rendered “bear shorter block” 3:59, 10:48, 25:07. The instrument on the worked example is captioned as “the Japanese Genesis”, which is plainly wrong, and the precise market has been left for a reader to check against the video rather than being guessed at here 16:04. Where phrasing was ambiguous the reading has been taken from surrounding context and is flagged in the text rather than presented as the speaker’s exact wording. Nothing here comes from anywhere other than the spoken content of this recording, and this review did not view the recording’s charts.
Resources
These are the sources checked while preparing this article. The regulator and investor-education pages are general material about how trading systems offered to the public should be assessed and about the risks of highly active trading; neither evaluates this speaker, verifies the array inventory, the seasonal claim, the order-choice discussion, the one percent ceiling or the 40-day and 20-day lookbacks described above, nor endorses anything said in the recording. Any ICT, smart-money or third-party indicator, script, note set, chart annotation, transcript pack or re-upload circulating outside the publishing channel’s own page is unofficial and has not been tested here.
- [1] ICT Mentorship Core Content – Month 05 – Position Trade Management — The Inner Circle Trader (primary source; watch page read 15 September 2026, listed duration 1,544 seconds).
- [2] The Inner Circle Trader — official YouTube channel (read 15 September 2026) — the publishing channel for the 2017 mentorship series used here.
- [3] CFTC — Fraud Advisory: Commodity Trading Systems Sold on the Internet (read 15 September 2026) — explains that hypothetical trading results are typically simulations calculated over historical price data, with results that calculate what purported trades would have achieved had they been placed.
- [4] Investor.gov (SEC) — Glossary: Day Trading (read 15 September 2026) — investor education stating that day trading is extremely risky and can result in substantial financial losses in a very short period of time.
BestProps’ own trading-day requirement calculator is a site tool for counting and checking trading-day windows; it is unrelated to this speaker, applies no part of his method, and is listed here only because the 40-day and 20-day lookbacks above are measured in trading days rather than calendar days.
Source: ICT, ICT Mentorship Core Content – Month 05 – Position Trade Management, The Inner Circle Trader, watch page upload date 18 September 2022; the recording identifies itself as lesson eight of the January 2017 mentorship. Automatic YouTube captions were the transcript used for this article, and the terms the track mishears are noted above. This commentary is educational and is not investment advice.





