
Key takeaways
In Predicting Session Low & High With Executions, the Inner Circle Trader (ICT) reviews one session and sets out how he framed a daily-chart discount area around $27,665.5 before the week began, read a one-minute market maker buy model into the session low, described a staged entry around the midpoint of a reference wick, and…
Read the full summary
In Predicting Session Low & High With Executions, the Inner Circle Trader (ICT) reviews one session and sets out how he framed a daily-chart discount area around $27,665.5 before the week began, read a one-minute market maker buy model into the session low, described a staged entry around the midpoint of a reference wick, and planned partial exits up to a 9:30 a.m. New York open that he says became the regular-trading-hours high. The recording runs about 10 minutes 41 seconds and is built on automatic speech recognition rather than YouTube captions, so his spoken numbers, terminology and chart annotations are reported as transcribed rather than verified. The transcript cannot verify order fills, contract prices, position size or account results, and one narrated session does not establish that session highs and lows can be predicted.
How we researched this article
BestProps used document-based research from primary firm sources, checked September 14, 2026. The complete source list, scope, limitations, and commercial-state record appear near the end of this article.
In Predicting Session Low & High With Executions, the Inner Circle Trader (ICT) reviews one session: how he framed a daily-chart discount area before the week began, how he read the one-minute chart into the session low, where he says he entered, and where he expected the high to form. The recording runs about 10 minutes 41 seconds. It is a walk-through of his own interpretation rather than independent evidence that session extremes can be predicted, and a transcript can document what was said but cannot verify chart annotations, order fills, contract prices or account results.
The source used for this article is automatic speech recognition of the full original audio, not YouTube captions. Terms are normalized only where the surrounding context supports it — the transcript’s “consequent encouragement” is read here as consequent encroachment, and “market maker by model” as market maker buy model — and spoken numbers are reported as transcribed rather than treated as verified fills. Everything below is attributed to the speaker.
The daily premise: a bullish array in deep discount
At 0:27 he identifies a down-close daily candle sitting beside a gap and says the area had already been used to set up a bullish order block, positioned in what he calls a deep discount relative to where price had traded. At 0:50 he adds that price usually digs beneath such an area instead of stopping at its edge, and he describes the same region as a “suspension block” whose midpoint, or consequent encroachment, can produce a reaction even if the wider decline continues (1:06).
The specific vicinity he names is around $27,665.5 “or less” (1:30), with the qualification that time-of-day agreement matters for whether anything comes of it (1:45). That figure is a spoken number captured by automatic transcription: it is reported here as he stated it, not confirmed against the chart. The teaching point is about context rather than certainty — the daily array marks where a bullish reaction is worth hunting, and price may still keep rolling lower.
One-minute framing and the market maker buy model
On the one-minute chart (2:10) he says the market opened at 9:30, made a small move up that left relative equal highs, and then traded down into the daily area (2:36). What he says was forming at that point is, in his terms, a market maker buy model (2:42), and he locates the move inside an octant — the lower quadrant beneath the daily block (2:49).
His reading of the probes lower is deliberate: they were there to make traders chase, while minor buy-side liquidity was left sitting above (3:22). He then expects the sell-side liquidity beneath price to be accumulated before a wick is laid down — the print he wants to enter around (3:32). A pattern resembling a conventional bear flag does not disturb him at this stage; he says it would add to the probability of the bullish idea rather than contradict it (3:49). These labels are his classifications and are presented as such.
Where he says he entered
He frames the intended sequence as a smart-money reversal and a low-risk buy, followed by first-stage accumulation and second-stage reaccumulation running to a target he calls his terminus for the regular-trading-hours session (3:58, 4:07, 4:16). Pointing at the midpoint of the reference wick he says anything at or below that line is, in his words, a “perfect entry” (5:56).
He also explains why the review is clipped. He says he had to leave for a family medical situation, could not watch or manage the position, and recorded the whole session so it could be published later (4:43, 5:20). That interruption is his stated reason for keeping the position small.
At the execution display he points to an entry below the wick and says he built the position to three contracts, describing the first one as an aggressive starter (7:41, 7:46). He says the prices were on screen, but the transcript does not enumerate them, so no fill price is repeated here and nothing in this article should be read as a verified execution record.
Confirmation at the inversion fair value gap
After price rallied and pulled back into what he calls an inversion fair value gap, he says he had already typed the annotation because he knew the published clip would carry no audio (8:14). He points to a small wick — “a mohawk,” in his words — and to candle bodies that could not close outside the gap, and reads both as bullish for continuation (8:21).
This is the part of the review that a transcript cannot date: the annotation is visible in the video, but the recording alone cannot establish when it was written, so advance framing and retrospective narration cannot be fully separated from the transcript.
Planned partials and the 9:30 opening price
He says he added the 9:30 opening price for the regular trading hours session to the chart (8:44) and planned his exits in stages: a first partial near a nearby feature, then another around minor buy-side liquidity, with the later objective left higher (8:53, 9:17, 9:25). At 9:45 he says the 9:30 price was reached, and at 9:55 he states that this level became the regular trading hours high shown in his review.

His summary claim at 10:00 is the one the title is built on: a trader buying the low while expecting where the high would be. He says he applies the same reading to weekly ranges, daily charts and session extremes (10:13). Whether the method identifies future session highs and lows consistently is not established by the recording; the video documents one session and his interpretation of it.
Turning a session reading into a written plan
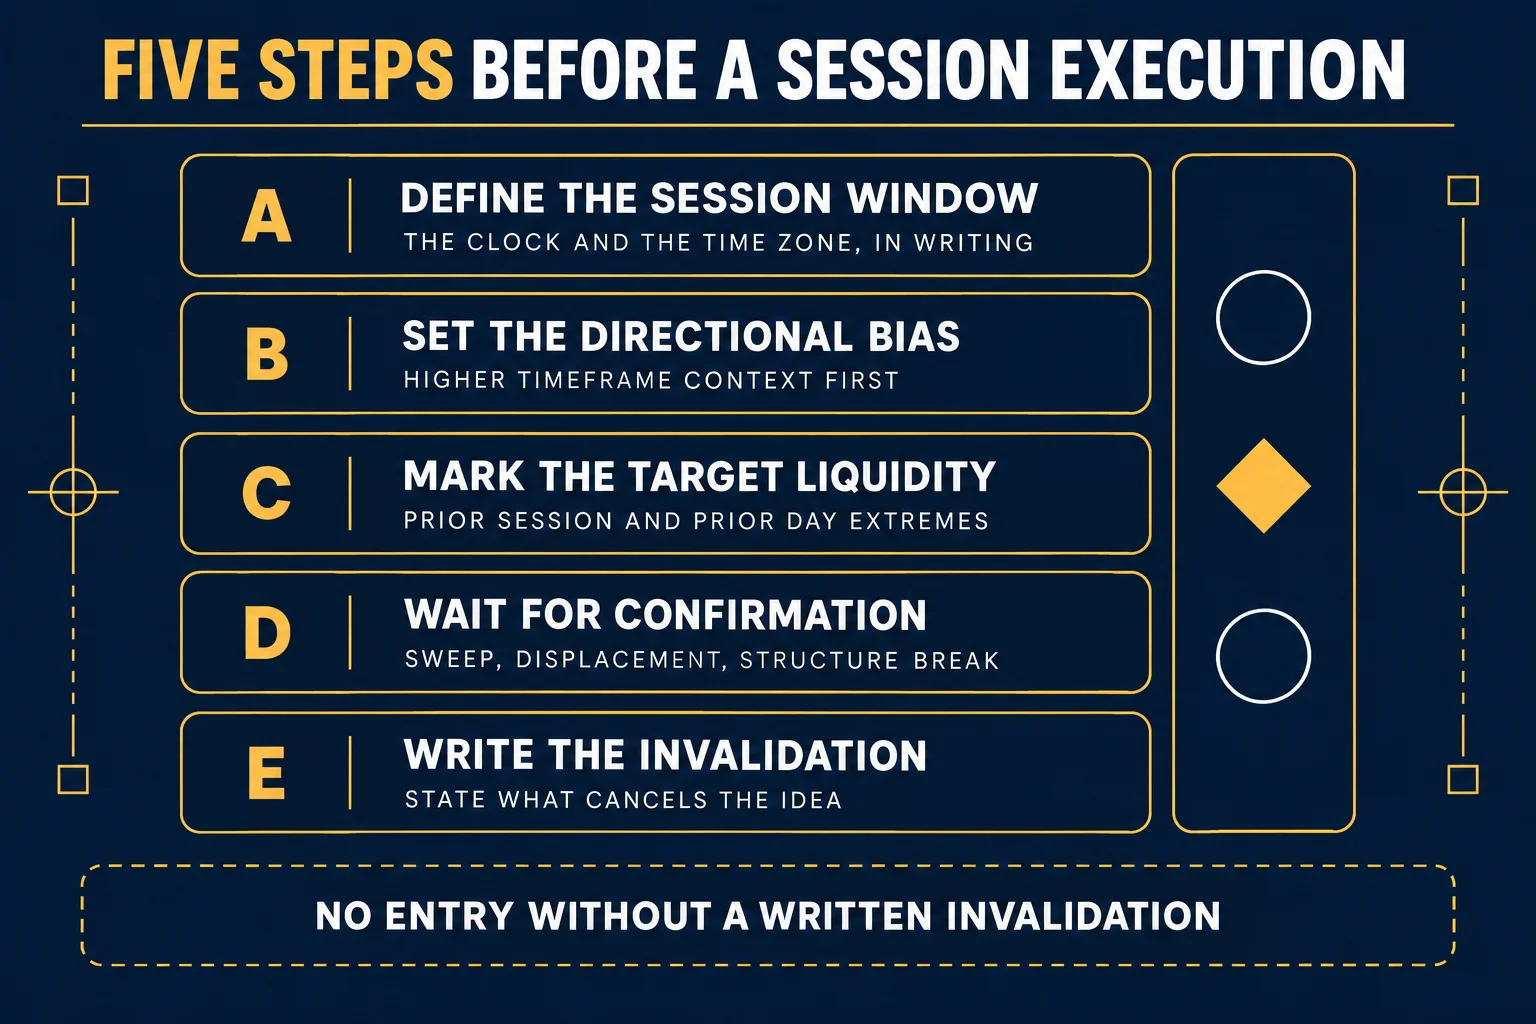
The session-specific details are not transferable, but the order he describes is: higher-timeframe context first, then a location where a reaction is plausible, then the liquidity being targeted, then the trigger, then the exits. The checklist below is this page’s own generic scaffolding for writing that order down before an execution. It is an AI-generated schematic; it is not a chart from the recording, and the recording does not present these as a numbered sequence.
Why he also uploaded the long version
At 6:32 he says he uploaded a slow, real-time recording of the session — unedited time, about an hour long — and argues that sped-up reviews invite the accusation of hiding something. At 6:45 he predicts most viewers will not watch the long version and says the short cuts coddle a short attention span. Whatever one makes of the delivery, the practical study habit is the same: watch the unsped portion and compare each annotation with what price did, rather than treating the edited cut as the complete record.
Key takeaway
The lesson is a worked example of pre-planning rather than a prediction engine. A daily area is marked as a discount, the intraday chart is read for a sweep into that area, an entry is defined around a wick, and exits are staged in advance. The claimed result — an entry near the session low and a high that landed on the 9:30 opening price — is the speaker’s own account of one session, presented with his own annotations, and the transcript provides no brokerage record, fill list or risk data. Treat it as one trader’s framework for study, not a validated system.
Watch the original lesson
Watch the original lesson on YouTube
This recording cannot be played inside another website. When its embedded player was opened from a BestProps origin on 13 September 2026, the player itself reported “Playback on other websites has been disabled by the video owner.” and settled on a “Watch on YouTube” prompt. A control video on the same channel returned normal oEmbed metadata in the same check window, so that response is specific to this recording rather than a general outage. No player is reserved or left blank here; the lesson is available directly on YouTube.
Watch Predicting Session Low & High With Executions on YouTube ↗
Primary source and further reading
- The original Inner Circle Trader lesson: use the timestamp links above to compare each description with what was said. The watch page was read on 13 September 2026 and reported a public video, not unlisted, published 29 July 2026 and listed at 641 seconds. This article is independent commentary and is not affiliated with the channel.
- TradingView: Pine Script documentation, Sessions: the platform’s own description of how a session window resolves to a time zone —
time()andtime_close()use the exchange time zone unless a timezone argument is given, which can differ from the chart time zone — and how a bar outside the window returnsna. Relevant when a written session definition is expected to match what a chart actually draws. Vendor documentation about platform behaviour, not evidence about trading results. - CME Group: Holiday and Trading Hours: the exchange’s own schedule source, which states the schedule “is subject to change” and that trading hours are usually finalized about two weeks before a holiday. Use it to confirm the hours that apply to your own instrument and week. The page returns HTTP 403 to direct automated requests from this host; its text was read through a page-extraction tool on 13 September 2026.
- BestProps: Prop Firm Drawdown Rules by Calculation Method: a document-based comparison of static, trailing and end-of-day drawdown rules. The page states it reports no first-hand account purchase, trading, support, identity-check or payout testing, so it is a reference for how rules differ, not a record of results.
This is independent educational commentary on a public recording, not a transcript of it and not official ICT material. The session described here is the speaker’s own interpretation of one day’s price action; no level, sweep, entry or partial exit described above has been independently verified, and none of it is a recommendation to copy a trade. Futures are leveraged and can produce rapid losses. Nothing on this page demonstrates a tested, repeatable or profitable result.





