
Key takeaways
In How To Frame Sessions In High Resistance Liquiidity Run Conditions (published 10 August 2026), ICT walks through the levels he was working from on a week where CPI and PPI sat on Wednesday and Thursday.
Read the full summary
In How To Frame Sessions In High Resistance Liquiidity Run Conditions (published 10 August 2026), ICT walks through the levels he was working from on a week where CPI and PPI sat on Wednesday and Thursday. He grades two reference ranges — Friday’s final-hour regular-trading-hours range, and the first 30 minutes of the pre-market 7:00–7:30 a.m. New York window — and then carries those gradient and octant levels forward into Monday’s session, watching the midnight New York opening price, the new-week opening gap, and an imbalance area that became an inversion fair value gap. His stated reasoning is that with the week’s volatility likely to be held for the CPI and PPI releases, electronic trading hours are the likelier trending window while regular trading hours tend towards range-bound, high-resistance conditions. He also reports that one idea got messy and was stopped out, and describes a second short he says he would have taken had he been at the charts. Everything about his levels, his fills and his results is his own commentary on the session; the transcript cannot verify chart details or execution, and the automatic transcription of specialised terms and numbers is imperfect.
How we researched this article
BestProps used document-based research from primary firm sources, checked September 14, 2026. The complete source list, scope, limitations, and commercial-state record appear near the end of this article.
Educational notice: This article explains a trading methodology for general educational purposes. ICT terminology does not guarantee predictive accuracy or profitable results, and leveraged trading around economic releases can produce rapid, substantial losses.
What the recording is
ICT opens by describing the video as “an amplification of what I was visualizing today in price, where some of the levels were derived from, why I trusted certain things versus other things” (0:00). It is a walkthrough of a completed Monday session rather than a live trade, and the instructive part is the reasoning he gives for choosing some levels and discarding others.
Two calibration notes on the source. First, the watch page carries a publication date of 10 August 2026 and the recording treats the session it reviews as that same week, referring to CPI on Wednesday and PPI on Thursday; the recording does not state the session’s calendar date in full. Second, the transcript used for this article comes from automatic speech recognition on the full original audio, not human-verified captions, so specialised vocabulary and price figures are the least reliable content in it. Ambiguous items are flagged below rather than smoothed over.
The first reference range: Friday’s final hour
He starts with Friday’s last hour of regular trading hours. From its lowest low he measures to its highest high and draws the fib from the low up to the high, pointing out that a candlestick lay directly on the lower quadrant level he calls 0.75 (0:19, 0:43). The term he uses for the level at 1:03 is rendered by the transcript as “suspension block,” which is most likely a recognition artefact of one of his standard structure names; it is not reproduced here as a quotation because the label cannot be established from the audio.
He then defines the final-hour range itself as a dealing range and says those two reference points matter “for liquidity purposes, also for grading” and for where turning points may or may not form in Monday’s trading (1:20, 1:35).
The calendar comes before the levels
The frame for the week is economic. He notes CPI on Wednesday, PPI on Thursday and medium-impact releases on Friday, and draws the inference that Monday and Tuesday are “more likely that it’s going to be reserved” — no big blast-off run or sustained price movement, because the volatility is being held for the CPI and PPI numbers (1:53).

His one-line method statement for that kind of week is worth separating from the forecast: “when we’re checking trades, we have to look for the best case scenario, but don’t demand it” (2:35). That is a discipline rule applied to a conditional expectation, and it is the sentence the rest of the video illustrates.
Why electronic hours trend and regular hours resist
His session distinction is explicit. Electronic trading hours “tends to trend,” and once regular trading hours begin the market “tends to go into like range bound and potentially high resistance liquidity run conditions” — the HRLR condition of the title (2:45).
He extends that to the pre-market: during electronic trading hours — “London session, the pre-market session leading up to the 9.30 opening bell” — those are the trending environments when CPI and PPI fall in the middle and back end of the week (3:51). He also allows that one session of the day, the morning or the afternoon regular session, may still be permitted to trend, and that this is preparation rather than a prohibition on trading (5:32).
On the psychology of that setting, he says the difficulty is managing the urge to force something to happen because you want to make a little money, and that the place to build that discipline is backtesting, forward testing and demo trading: “if you can’t do it there, you’re not going to do it with real money” (5:53).
The second reference range: the first 30 minutes of pre-market
For this session he highlights the first 30 minutes of the pre-market session — he says “7.30 a.m.” and then anchors to 7 a.m. — and explains why he wants only that slice: to see whether a range forms in it (6:27, 6:45). He describes price making a high, trading down to the lowest low since 7 a.m., and then trading back up to almost three quarters — if not 80% — of that range (7:02).
From there he grades the swing from that low to the highest high of the 7:00–7:30 window, anchors to both extremes, and carries the resulting gradient and octant levels forward (7:20, 7:48). He treats the range as valid for the first hour of the pre-market session (8:11).
Near the end he addresses the obvious objection to using 30 minutes instead of 60. On a day without the same CPI/PPI context he says he could use the entirety of the first hour; the first 30 minutes functions as a dealing range in the same way the 9:30–10:00 Eastern opening range does, and he is emphatic about the length: “It’s not five minutes. It’s not 15 minutes. It’s 30 minutes” (14:42, 15:05).
What he carries forward into the session
Three reference points do the work in the walkthrough. The first is the midnight New York opening price, which he says came in “again at 29,878.25” and around which the market gyrated and consolidated overnight before drifting lower (4:53). He is emphatic that this level belongs on any chart regardless of instrument: “I don’t care what you’re trading… midnight opening price, you got to know what that is,” because the market gravitates back to it (9:14). The figure itself carries the caveat that it comes from automatic transcription of the audio and could not be confirmed against a chart.
The second is the new-week opening gap. He shows price trading into it, hitting an upper quadrant level, closing, and then selling off into the gap again before rallying back to the midnight opening price and into the imbalance area he had already marked (8:26, 8:48). His stated rule is that the gap is valid because it sits on the graded level, and that when price is below a gap it can act as an inversion fair value gap instead (8:55).
The third is the macro window he calls 7:50 to 8:10, where he points out the last minute of the macro, the sell-off that follows, and price working its way down into the session low of Friday’s final regular-trading-hours hour (9:28, 9:41). That Friday final-hour low is what he calls “key liquidity,” and it is the destination for the move he is explaining (9:59).
How he justifies which lows matter
The lesson’s answer to “why this low and not that one?” is a list. He says the lows he favours are based on session highs and lows, daily highs and lows, the London lunch range high and low, previous-week highs and lows, and the highest high and lowest low of the last three days (10:06, 10:17).
He frames that list as existing teaching rather than a new tool, and laments that viewers ask him to act as “ICT ChatGPT” instead of working through the channel’s material in the order he authored it (10:27, 10:50). Whatever one makes of the complaint, the methodological point stands as the transferable one: the level selection rule is meant to be a written list, not a judgement made after seeing the reaction.
What he says went wrong
Most of the value in this recording is that it includes a losing sequence. He says the idea got messy, that price broke lower and that he “ended up getting stopped out and that’s fine” (13:14).
He then describes a short he says he would have taken had he been watching: selling on a candle as it tried to get up into the middle of a wick, which he says would have become an inversion fair value gap, with partials below the relative equal lows and a trailing stop after that (13:19, 13:51). He adds the rule he applies to the result: a close below halfway of that wick makes it likely the low gets taken, “which it did” (14:05). That sequence is retrospective and was not an executed trade on camera — the transcript shows no fill, and no fill is claimed here.
He is also candid about the downside of the setup: at 14:11 he says price had moved into an area where he would not be that inclined to participate, and that forcing a breakout or a trending model in this kind of tape is what gets new traders into trouble when they do not know where the liquidity and key inefficiencies are.
Why he trades these conditions on camera at all
The closing rationale is pedagogical and worth stating plainly, because it explains the video’s shape. He says he wanted to participate in high-resistance conditions “because you learn more from me doing those things,” that viewers otherwise would not know when conditions are resistant, and that after the easy part of a week he deliberately shows what his own hands look like when it gets harder: “sometimes you’re going to see me getting stopped out” (15:32, 16:03).
What the recording does not establish
Three limits matter before anything here is reused. First, the transcript cannot verify the chart: every alignment, level and reaction described is the speaker’s account of what he was looking at, and no chart detail is asserted in this article as independently observed. Second, two passages are recognisably mis-transcribed — the structure name rendered as “suspension block” near 1:03 and the imbalance wording near 8:01 — so neither is quoted as terminology. Third, the numeric levels quoted above, including the midnight opening price, come from automatic transcriptions of speech and should be checked against the recording before being used for anything.
There is also no audited performance claim in this video to evaluate. What he reports is process: which references he graded, where he expected price to go, and that one attempt did not work out. That is a narrated case study, not evidence of an edge.
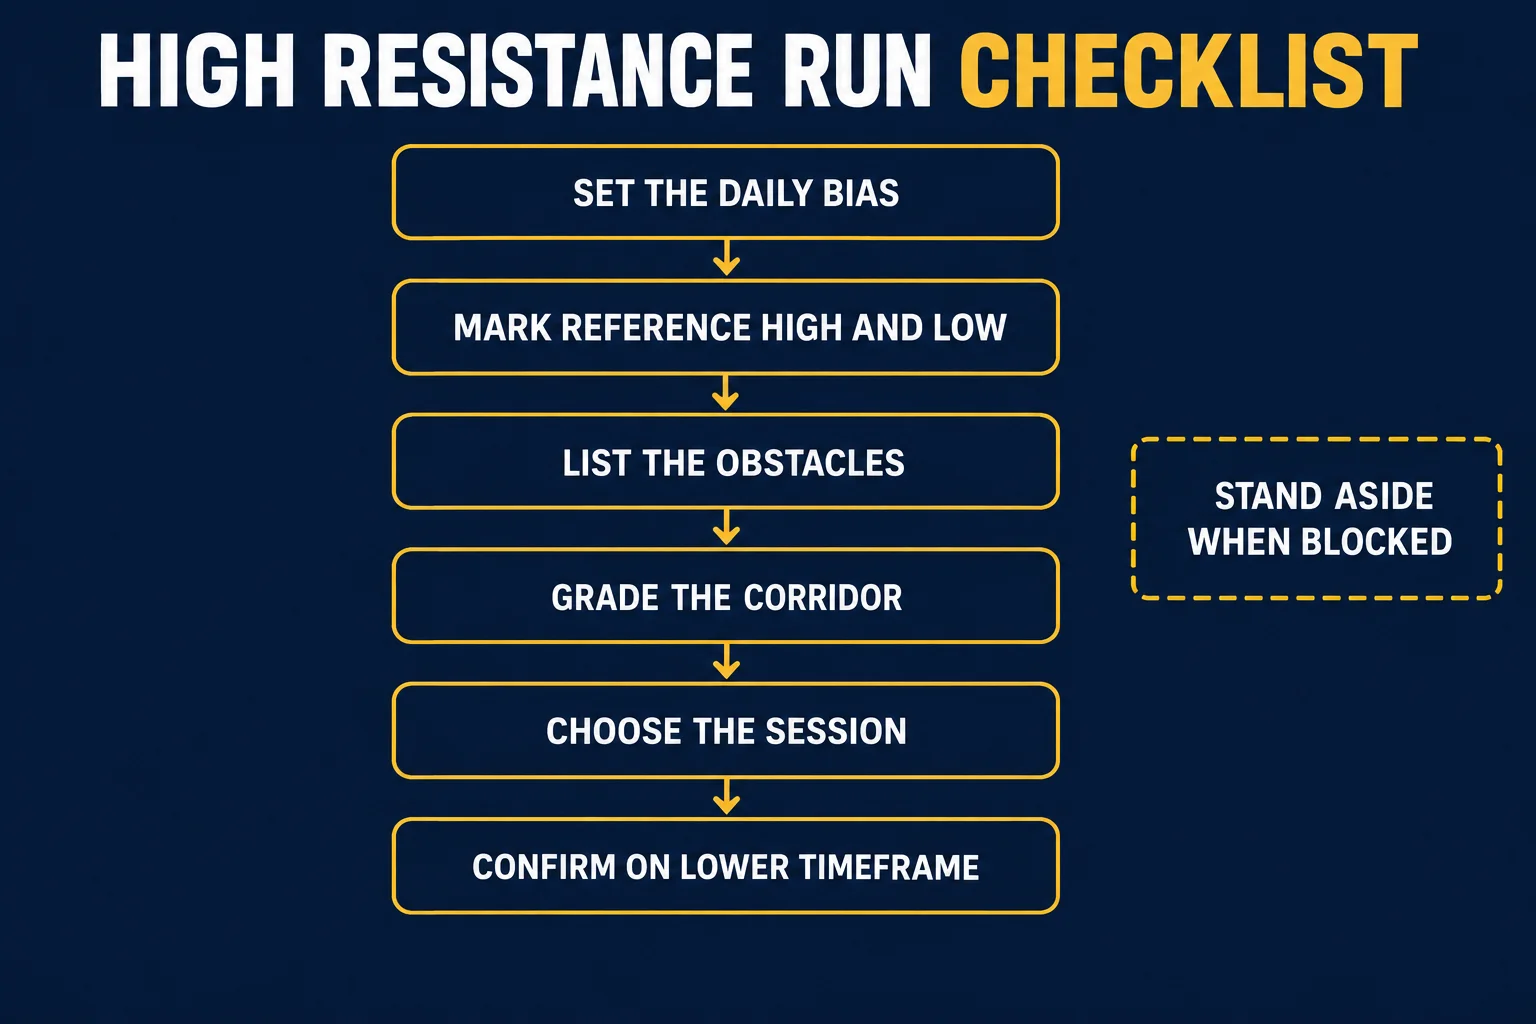
Frequently asked questions
What is a high-resistance liquidity run condition? In this lesson it is the state of the tape when the week’s volatility is expected to be held for high-impact releases later in the week: electronic hours are the likelier trending window, while regular trading hours tend towards range-bound behaviour, which he says makes forcing a trending model problematic (2:45).
Why does he grade only the first 30 minutes of the pre-market session? Because he wants a defined range to grade from and to carry forward, and he treats 30 minutes as the dealing range for the session, analogous to the 9:30–10:00 Eastern opening range. He says that on a day without the same CPI/PPI context he could instead use the entire first hour (6:27, 14:42).
Did the lesson end in a winning trade? No — he reports an attempt that got messy and was stopped out, and separately describes a short he says he would have taken if he had been at the charts. Nothing in the audio verifies a fill, a price or a result in either case.
Why is there no embedded player on this page? Because the source video’s own player reports that playback on other websites has been disabled by the video owner. That was tested from this site’s origin on 14 September 2026; the watch card below links to the recording on YouTube instead.
Related source video: How To Frame Sessions In High Resistance Liquiidity Run Conditions
The mapped source for this article is How To Frame Sessions In High Resistance Liquiidity Run Conditions on the channel The Inner Circle Trader. This BestProps page is independent educational commentary: it is not a transcript, not an official ICT lesson, and not evidence that any range, level or sequence described in the recording occurred as described.
Watch the original lesson on YouTube
This video cannot be played inside another website: the embedded player itself reports “Playback on other websites has been disabled by the video owner.” That response was read from the player on 14 September 2026, so no player is reserved here and no embed is left blank. The lesson is available directly on YouTube.
Watch How To Frame Sessions In High Resistance Liquiidity Run Conditions on YouTube ↗
Sources for session framing and the rules that apply to a funded account
Four references support this article: the source recording, this site’s drawdown comparison page, a platform help page on chart intervals, and the exchange’s own product page for the futures market he is trading.
The mapped upload How To Frame Sessions In High Resistance Liquiidity Run Conditions was read directly for this article: at the time of the check the watch page was public, not unlisted, credited to The Inner Circle Trader, carried a publication date of 2026-08-10 and a length of 1,007 seconds, and the full original audio of that recording is what the transcript used here was produced from.[1] The page metadata settles the identity, duration and visibility of the upload; it does not settle the levels, chart alignments or results discussed in the recording.
The BestProps page Prop Firm Drawdown Rules Explained compares static, trailing, intraday, end-of-day, daily and balance-based drawdown calculations across named programs and links the provider documents it used. Read its own disclosure: its stated sources were checked on August 1, 2026 and the page labels itself stale and asks readers to recheck before relying on it; it also states plainly that the comparison is not a universal ranking, that drawdown methods vary by firm, program, stage, account size and platform, and that the page reports no first-hand account purchase, trading or payout testing.[2] Whether a session like the one in this video is tradable in your account also depends on rules that page does not cover, including daily loss limits, consistency and restricted-period terms. Your own dashboard and the provider’s current document are final.
The TradingView help page Time intervals: a quick introduction and tips explains that an interval sets the amount of time or trading activity a bar covers and that intervals are tied to the instrument’s trading hours, with separate sections on choosing and customising an interval.[3] That matters here: a fifteen-second or one-minute bar drawn on a different session schedule will not line up with the 7:00–7:30 pre-market window or the midnight opening reference described above. The page documents the platform, not ICT methodology or anyone’s record.
The CME Group product page E-mini Nasdaq-100 Overview is the exchange’s own description of the NQ contract — contract size, minimum tick and trading hours — and it was the instrument reference for this session when the resource was first read on 13 September 2026. Automated retrieval of that page was blocked from this environment on 14 September 2026, so its contract specifics are not restated here and should be confirmed on the exchange page itself.[4] Session labels such as “London,” “pre-market” and “regular trading hours” are conventions layered onto that near-continuous schedule; they are not exchange-defined guarantees about where price will turn, and contract specifications, margins and hours can change.
Sources
- [1] YouTube: How To Frame Sessions In High Resistance Liquiidity Run Conditions – The Inner Circle Trader (source recording; page metadata and player embedding status checked 2026-09-14)
- [2] BestProps: Prop Firm Drawdown Rules Explain Limits and Restrictions (document-based comparison; page states sources checked 2026-08-01 and labels itself stale)
- [3] TradingView Help: Time intervals – a quick introduction and tips (platform documentation for chart intervals and trading hours)
- [4] CME Group: E-mini Nasdaq-100 Overview (exchange product page for the NQ contract; read 2026-09-13, automated retrieval blocked on the 2026-09-14 recheck)
Timestamps cited in the body refer to the source recording; they are derived from automatic speech recognition of its audio and are approximate to within a few seconds. BestProps is not affiliated with The Inner Circle Trader, TradingView or CME Group, and no source listed here endorses this article, this site or any setup. Dealing range, liquidity, premium, discount, PD array, displacement, order block, fair value gap and high resistance liquidity run are used on this page only as descriptive study terms. Nothing here demonstrates a tested, repeatable or profitable result, and no claim is made that any level, session or sequence predicts price or was verified on a live account.





