
Key takeaways
In ICT Obsidian Teaching, ICT defines Obsidian as a PD array formed by two opposing candlestick wicks, read inside a directional narrative that he says must already be established on the daily chart.
Read the full summary
In ICT Obsidian Teaching, ICT defines Obsidian as a PD array formed by two opposing candlestick wicks, read inside a directional narrative that he says must already be established on the daily chart. Each wick is split at its midpoint, or consequent encroachment, and he grades how candle bodies behave between those two levels. For the session he reviews, the narrative is bearish and rests on a 7:00–9:00 a.m. Eastern pre-market dealing range, a daily sell-side imbalance, a new-week opening gap and a 30,137.50 objective he says he called publicly in advance. Every entry, partial and fill described in the recording is his own narration; the transcript cannot verify chart annotations, executions or results.
How we researched this article
BestProps used document-based research from primary firm sources, checked September 14, 2026. The complete source list, scope, limitations, and commercial-state record appear near the end of this article.
This article is a companion to the recording, not a transcript of it and not an ICT publication. It summarises what the lecture actually says, marks where the speaker is reporting his own actions, and separates those reports from anything independently checkable.
The higher-timeframe premise comes first
ICT opens by revisiting daily-chart premium and discount arrays from the previous week and insisting they be taken one at a time. His stated objection is to building a whole idea out of what price could eventually do, and at 0:42 he compares that habit to a gold miner who keeps digging because of a few flakes.
The rule he repeats is that institutional order flow can be read from candle bodies. In his framing at 1:47 and 2:40:
- Bearish price action keeps bodies in the lower half of a premium array and out of its upper half.
- Bullish order flow should be willing to place bodies in the upper half.
- At an array below market price, the upper half should show discount sensitivity and little willingness to accept bodies in the lower half.
He is explicit that a rectangle on a chart is not automatically a supply-and-demand zone, and that his arrays do not expire the way he says conventional zones go stale (3:40).
The bearish case in the reviewed session is built from what he describes as an early warning: a Friday close below the low of a daily sell-side imbalance/buy-side inefficiency, the term he abbreviates “SIBI.” He reads the value of that level from the related candlestick high and notes the close finished a few handles below it (6:23 and 6:32). On the following session, he says price rallied into the high of that inefficiency, overshot it by roughly five handles, which he calls permissible on a daily chart, and then failed to hold the move (7:23). That combination of a close below a key level and no follow-through higher is what he calls the warning sign behind expecting softer prices (8:42), and from there he says he looked for a run back to the new-week opening gap (9:19).
From the daily chart to the morning dealing range
ICT then drops to a one-minute chart and marks a pre-market dealing range between 7:00 a.m. and 9:00 a.m. Eastern Time, treating that high and low as the two bookends of the range he grades (11:10). He divides the range into halves, quadrants and octants and anchors projections from its low to the high that forms after the 9:30 a.m. open.
He adds a condition that he says he gave in the weekend roundup: when the pre-market is itself trending, the morning session should not be expected to deliver a clean directional run, but rather initial consolidation and range-bound behaviour (12:05). He then describes why he was looking lower despite that chop, and where his posted intraday level came from: a projection from the dealing-range low, offset to give the $30,137.50 reference he says he published the previous day (13:07).
The sequencing he teaches is deliberately hierarchical:
- Establish the directional narrative on the daily chart.
- Mark the pre-market high and low between 7:00 and 9:00 a.m. Eastern.
- Carry that range’s divisions forward into the regular session.
- Expect an initial push higher after the open, the move he calls a Judas swing, that draws in buyers before the intended direction resumes (16:23).
- Treat lower-timeframe features as valid only when they agree with the daily premise, a point he returns to at 33:08.
He also flags, for that session, that regular trading hours contained a large gap below the market that he says had never been traded to, and tells viewers to stay aware of it (20:11). That is his observed chart context, offered as a scenario, not a forecast with established odds.
What ICT calls Obsidian
The definition arrives at 23:27, while he is still expecting an eventual turn lower: Obsidian is a PD array formed by opposing wicks, one pointing above the candle bodies and one pointing below.

Two conditions are stated. First, direction: the second wick has to sit higher than the first when the bias is bearish (27:08). Second, context: he insists he must already be right about market direction and the narrative, otherwise, in his words, the structure will not work in your hands (27:16).
Each wick is then split at its 50% level. The area between the two consequent-encroachment levels becomes the zone he watches, and what he grades is whether candle bodies accept that area or respect it as price returns to it. His closing summary at 33:44 reduces the idea to two opposing wicks inside a narrative, the midpoints of those wicks, and the price behaviour observed between them. He adds that he intends to detail the concept further later.
How the reviewed trade is described
ICT says he built a short position as price revisited the Obsidian area and an older pool of buy-side liquidity, that he would have added at the upper quadrant of the dealing range had price reached it, and that he was looking for the move to fail below that level (23:14). He describes taking partials at successive downside references, including a prior low, relative equal lows and the new-week opening gap, lowering his stop, and holding a limit order just above 137.50 because he says he had called the level publicly before the move (31:52 and 32:16). He frames the whole exercise as intraday trading with a market-maker sell model, from a smart-money reversal entry through staged distribution.

None of that is independently checkable here. The transcript records what he says about his orders and fills; it cannot confirm that they occurred, that the annotations were drawn in real time, or that the outcome matched the description. Reported executions are not evidence of profitability and are not a suggestion to copy the trade.
Transcript provenance and what this review cannot settle
The source used for this article is a timestamped transcript produced by automatic speech recognition of the full recording, not the uploader’s caption file, because no caption track was available for this video. That has consequences worth stating plainly:
- ICT’s specialised labels, such as SIBI, consequent encroachment, new-week opening gap and Obsidian, are reproduced as the transcript renders them; recognition errors in unusual terms are possible.
- Several spoken price figures are internally inconsistent in the transcript, including the handles around the daily array and the overshoot above it. Only the 30,137.50 objective he repeats and attributes to a public post is used here, and even that should be checked against the video.
- The reviewer read spoken words, not charts. Wick positions, gap boundaries, range divisions, order markers and any annotation timing described above are the speaker’s account, not first-hand chart observation.
- ICT states that the idea came to him through what he describes as a personal spiritual experience rather than from published literature (28:32). That is an autobiographical claim, not something a transcript can verify, and it is unrelated to whether the pattern has any predictive value.
General educational interpretation
Stripped of proprietary labels, the lecture describes a multi-timeframe routine: form a directional view on a higher timeframe, define a time-bounded intraday range, then observe whether lower-timeframe candle bodies accept or reject a specific retracement area. The wick structure is presented as subordinate to that context, which is why ICT resists treating it as a standalone two-candle signal.
Two cautions follow from the source itself. The concept is defined by a narrative that the same person supplies, so it cannot be evaluated from charts alone without those conditions restated in advance. And the transcript contains a repeated complaint that the method failed for people who tried to automate or staff it, which is an argument about their implementation, not evidence that the pattern works.
It is also worth separating this lesson from a same-name search result: most pages about “Obsidian” in an educational context discuss the Obsidian note-taking application. That software is unrelated to this trading lecture.
Watch the original lesson
Watch the original lesson on YouTube
The player itself reports “Playback on other websites has been disabled by the video owner,” so this page does not embed it. That response came from the player, and the recording is public and credited to The Inner Circle Trader, published 2026-08-18.
Sources for the lecture and the study workflow
Three references support this article beyond the recording itself: one documents replay testing so recognition can be checked without hindsight, and two are BestProps rule pages that summarise official funded-account terms the lecture does not override.
The recording
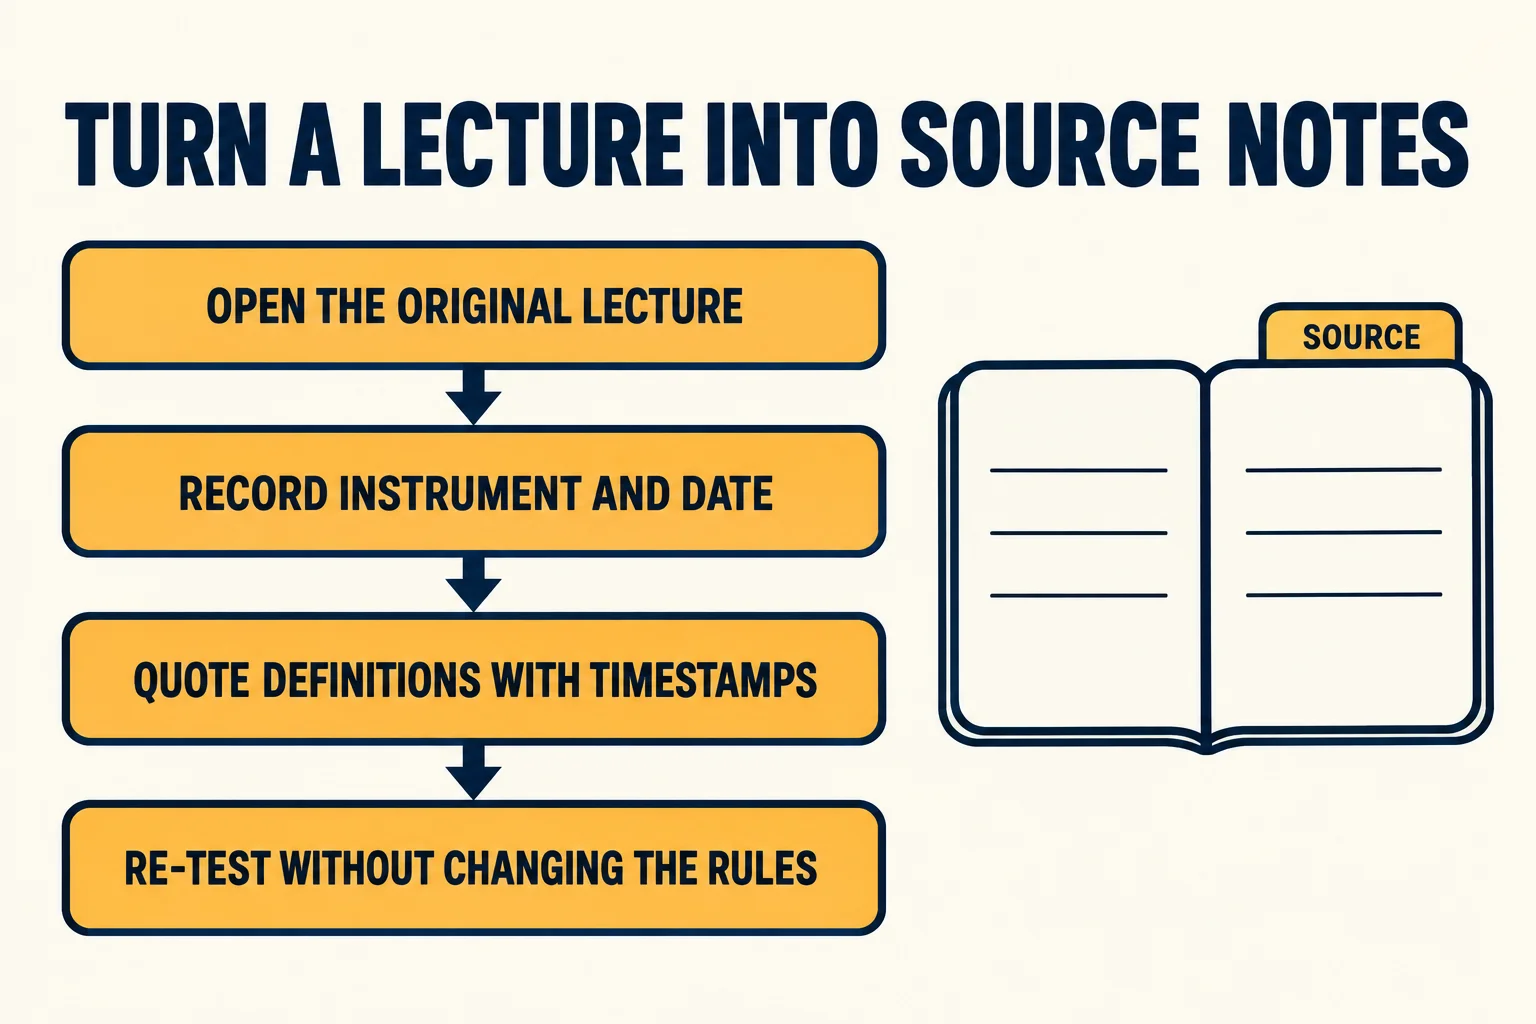
ICT Obsidian Teaching is public, credited to The Inner Circle Trader and published 2026-08-18.[1] The definitional passages cited above, particularly 23:27 and 33:44, are the passages to check first.
Re-testing recognition without the completed chart
TradingView’s help page How do I turn Bar Replay on? documents opening the replay panel, choosing a start point and advancing bar by bar.[2] TradingView is a third-party platform, is not affiliated with ICT or with BestProps, and is cited only as tooling.
Funded-account rules the lecture does not override
The BestProps page Prop Firm Drawdown Rules Explained compares static, trailing, intraday and end-of-day drawdown calculations and links the official firm documents it summarises, with a checked date recorded on the page.[3] The Prop Firm News Trading Rules page covers news-window restrictions in the same documented way.[4] Both are internal BestProps references, not independent audits of any firm’s terms.
Sources
- [1] YouTube: ICT Obsidian Teaching — The Inner Circle Trader (source recording, published 2026-08-18; checked 2026-09-14)
- [2] TradingView Help: How do I turn Bar Replay on? (third-party platform documentation; checked 2026-09-14)
- [3] BestProps: Prop Firm Drawdown Rules Explained (documented rule comparison; checked 2026-09-14)
- [4] BestProps: Prop Firm News Trading Rules (documented rule comparison; checked 2026-09-14)
BestProps is not affiliated with the Inner Circle Trader or TradingView, and nothing listed here endorses this article. Price behaviour around opposing wicks is ICT’s interpretation, reproduced and attributed as such; this page makes no claim of a tested, repeatable or profitable result, and it is educational commentary rather than investment advice. Funded traders remain subject to the current official rules of their own firm or provider.





