
Key takeaways
“Case Study With NonFarm Payroll & NQ Futures August 07, 2026” is an ICT recording built around the 8:30 a.m.
Read the full summary
“Case Study With NonFarm Payroll & NQ Futures August 07, 2026” is an ICT recording built around the 8:30 a.m. Eastern nonfarm payroll release. He defines a 7:00–8:30 a.m. premarket dealing range, points to 29,780 as a level he had tweeted earlier in the week, describes price rallying through it after the release and later turning lower during an 8:50–9:10 “macro” window, and discloses that the position reviewed was taken in a demo or paper-trading account — three NQ contracts with one taken off above the halfway point of the move. Everything below is taken from a timestamped transcript of what is actually said in the recording. It reports ICT’s interpretation of an unseen chart; it does not verify fills, chart coordinates, real-money execution or profitability, and nothing here is a recommendation to trade a news release.
How we researched this article
BestProps used document-based research from primary firm sources, checked September 14, 2026. The complete source list, scope, limitations, and commercial-state record appear near the end of this article.
In “Case Study With NonFarm Payroll & NQ Futures August 07, 2026”, the upload reviewed here by its public title, ICT reviews Nasdaq futures price action surrounding the day’s 8:30 a.m. Eastern nonfarm payroll release. His presentation focuses on defining the pre-news range, interpreting the initial expansion, and studying a later turn back through concepts from his own framework.
This page is an independent educational review of that narration. The example shown in the recording is, in ICT’s own words, a demo or paper trade, so the recording does not establish real-money fills, account results or profitability, and this article does not claim otherwise.
How this review was sourced
The mapped upload is Case Study With NonFarm Payroll & NQ Futures August 07, 2026, credited to the channel The Inner Circle Trader and published 2026-08-07. This review was written against a timestamped transcript of the recording’s original audio, produced by automatic speech recognition of the full download rather than from YouTube’s own caption track, and the times cited below are the timestamps of that transcript. The recording runs about 57 minutes in total; speech occupies roughly the first fourteen of them and ends with a sign-off, after which the remaining audio contains no spoken content. That later portion is therefore not described here, because no narration from it exists to ground a description.
The recording’s own statements agree with the published date. He opens by calling it “Nonfarm Payroll Friday,” and near the end, at 13:56, he says he will be celebrating his birthday “tomorrow, August 8th.” A session recorded on August 7, 2026 is consistent with both remarks.
Two limits on accuracy should be stated plainly. First, automatic speech recognition can misrender specialist terms and numbers, so where a value is unclear it is either flagged or left out rather than guessed. Second, the lecture depends on a chart that the transcript cannot show: candle positions, exact prices and prior posts on social media are reported as he describes them, not independently confirmed from the recording.
Why ICT treats nonfarm payroll sessions cautiously
ICT opens with a risk warning. At 0:00 he says the material is not an invitation to gamble or risk real money on, and he discourages inexperienced traders from participating on the Thursday and Friday of the first week of the month. His stated reason is the difficulty and volatility usually attached to major scheduled news. He identifies that day’s nonfarm payroll release as an 8:30 a.m. Eastern high-impact event and says its presence forces an adjustment in how the premarket range is handled.

Defining the 7:00–8:30 a.m. pre-news range
The exercise itself begins at 1:21. He first frames a broader 7:00 to 9:00 a.m. premarket window, then isolates 7:00 to 8:30 a.m. — the span before the release — and marks the highest high and the lowest low printed inside it. He calls the resulting boundaries the premarket “dealing range,” and around 2:54 says a range determination has to be in place before 8:30 precisely because an economic-calendar event is about to create movement.
That range is then used as the reference for reading the post-release move. In general educational terms, the sequence he demonstrates is:
- Fix the 7:00 a.m. Eastern starting point of the window.
- Measure the highest high and lowest low formed before 8:30 a.m.
- Treat those boundaries and the internal levels between them as contextual reference points.
- Watch whether the news-driven move expands beyond the range and whether it later works back inside it.
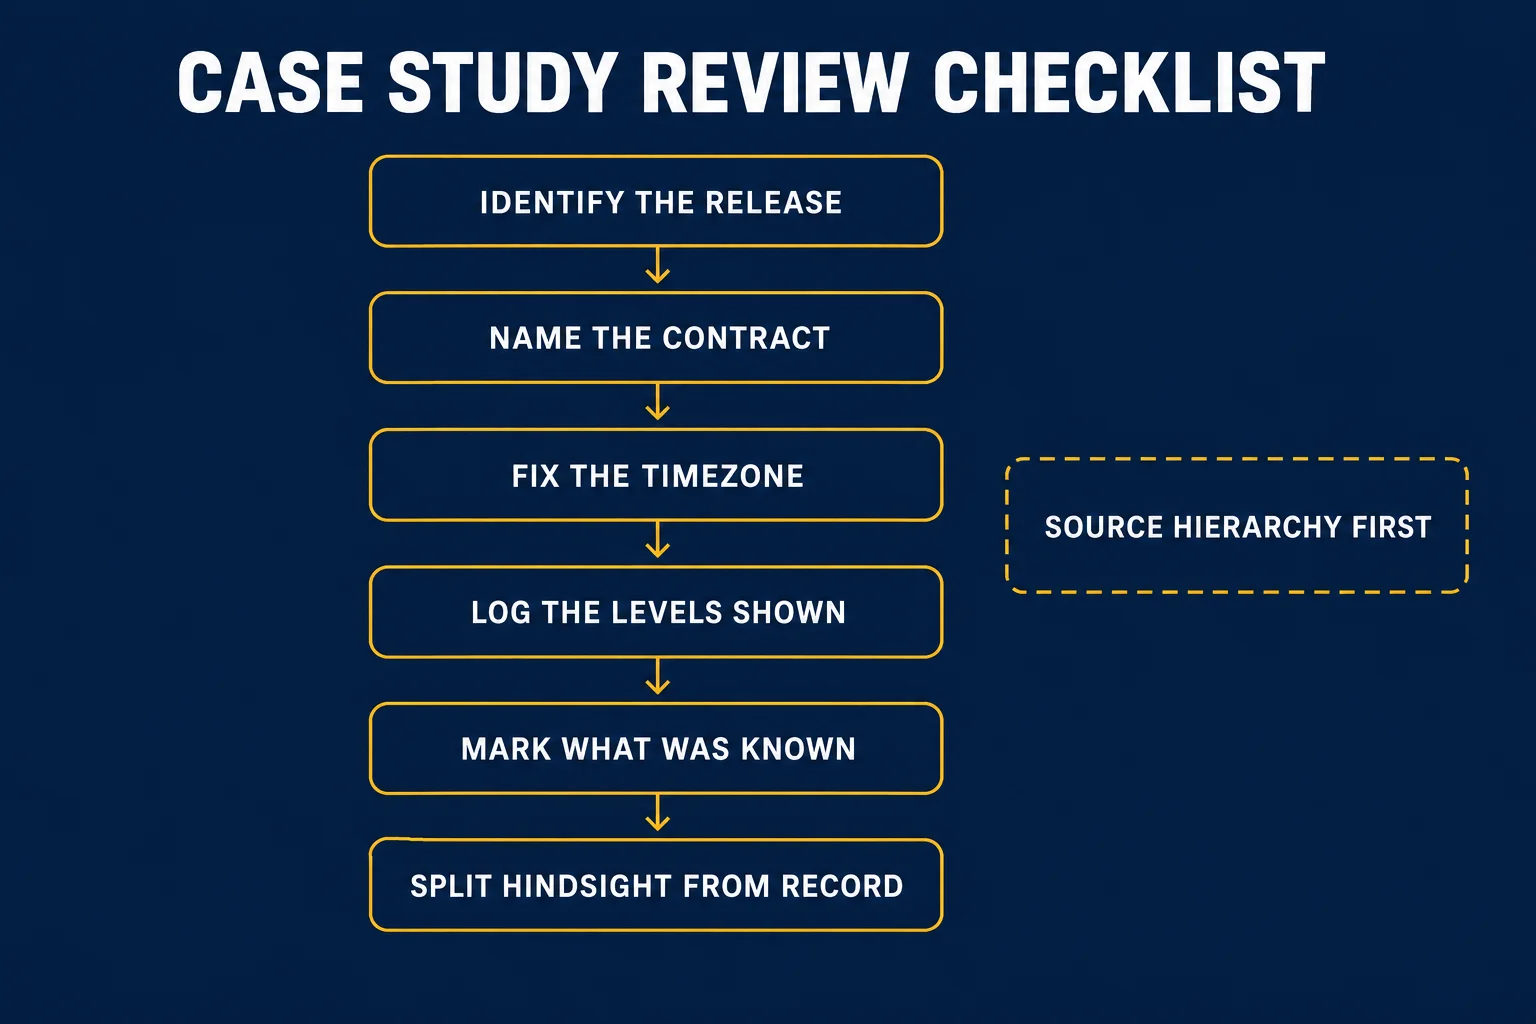
Because the underlying chart is not visible to a transcript reader, the specific candles and internal boundaries he points to cannot be verified from the narration alone. What can be checked is the order of the steps he describes and the times at which he describes them.
His bullish read before the expansion
From about 3:08 he walks through price moving into and out of the internal areas he names — the transcript renders these as “buy-side imbalance, sell-side inefficiency” and, later in the same passage, “buy-side balance, sell-side efficiency.” He allows what he calls minor excursions outside those areas, comparing them to a child colouring slightly outside the lines, and puts more weight on candle bodies not closing decisively at or beyond a referenced low. Reading those body closes together with reactions at internal levels, he concludes the balance of evidence points higher.
He ties that read to 29,780, describing it at 0:45 as the “last level of interest” he had posted to X on the Wednesday before the recording. The level is repeated consistently several times across the lecture, including where he walks price reaching it after the release; the earlier social-media post itself is not reproduced here and was not read first-hand for this page.
The 8:30 release and the later reversal idea
At 4:56 he narrates the action across 8:29 and 8:30. In his account price flirts with movement, quickly clears the nearby lows while leaving a sell-side area intact, rallies, stalls briefly, and then trades above the 29,780 level he was watching, extending further afterwards.
He then introduces an 8:50 to 9:10 “macro” window and, near 5:23, an “algorithmic projection” reached as that window opens. His point is conditional rather than certain: with price extended and the clock inside a period he considers significant, a reversal back into the earlier range becomes plausible enough to justify reducing exposure, which is what he says he did. After that turn he reads the decline through further named concepts, including an inversion fair value gap and a balanced price range formed by overlapping opposing inefficiencies that share the same high-to-low interval, before price works lower and clears sell-side liquidity beneath the earlier lows.
What the demo execution illustrates
At 6:50 he switches to reviewing executions. He states without prompting that “this is a demo trade… that’s a paper trading account,” and describes a log entry on three contracts. Around 7:41 he says he is taking one contract off, and from 7:47 he measures from the low where he went long up to his 29,780 objective to show that the exit sits just above the halfway point of that distance — explicitly because nonfarm payroll volatility can produce a wrong outcome. His stated rationale is exposure management during an announcement, not confidence that the full objective had to be reached.
The recording does not supply a complete order ledger, exact fill prices, final exit details or a verified profit-and-loss figure, and the transcript cannot confirm what the chart showed at those moments. The demo disclosure is the important part: this is a walkthrough of method and risk handling, not a documented real-money result.
Standard deviations and the two-stage delivery thesis
From about 8:21 he returns to the pre-8:30 range and applies standard-deviation projections to it, asking how far an expansion beyond his objective could run. He describes the rally as reaching an extension he measures at a standard-deviation reading of about 2.05 against that range, and notes that the reading lands as the macro window opens. That multiple applies to his own measurement of the pre-release range; the transcript cannot show the candles, so no reader-side confirmation of it is offered here.
At 10:16 he sets out the idea behind that expectation: nonfarm payroll, in his description, often delivers in two stages, similar to how he characterises an FOMC session — an initial move in one direction, then a move back the other way that catches participants positioned with the first leg. Applied to this session, his reading is that the first stage was the rally and the second was the decline toward liquidity below the earlier lows.
That is his market model as stated in the recording, not a rule the recording establishes. A single retrospective example cannot show how often such a two-stage sequence occurs, and it cannot establish expectancy for anyone copying it.
What this case study does not establish
Two things are worth separating. The first is the record: a transcript-grounded account of what was said, when, and with what level of confidence. The second is any claim about results. The recording is a narrated review of an unseen chart, delivered after the fact, on a demo account; captions and speech cannot prove real-money fills, and they cannot prove why the market moved as it did. ICT also flags a measurement he cares about himself — the low of the pre-8:30 range — where the automatic transcript renders two slightly different values for adjacent candles, a difference he describes as a couple of ticks. Because that reading is ambiguous in the source, no price is quoted for it here.
Practical use of a session like this one is procedural rather than predictive: define the pre-event window, write down the objective in advance, expect volatility around the release, and decide beforehand how much exposure is acceptable if the idea is wrong. The recording’s own warning against trading the first week’s Thursday and Friday without experience is part of the lesson, not a footnote to it.
Related source video: Case Study With NonFarm Payroll & NQ Futures August 07, 2026
The mapped source for this article is Case Study With NonFarm Payroll & NQ Futures August 07, 2026 on the channel The Inner Circle Trader, published 2026-08-07.
The player above was opened from a BestProps page origin and playback was confirmed to start, so the recording is embedded rather than linked out; if the owner later disables embedding for the upload, this block should be replaced with a direct watch link.
Sources used for this review
The primary source is the recording itself, which was transcribed in full before anything on this page was written. The remaining references are the issuing bodies’ own pages, provided so you can confirm release timing, contract specifications and account rules from the original material rather than from this summary.
Read the recording first
Case Study With NonFarm Payroll & NQ Futures August 07, 2026 — the upload this article is mapped to. Its watch page is public, credited to The Inner Circle Trader and dated 2026-08-07, and its player was tested from a BestProps page origin with playback confirmed. Every timestamp link on this page points into this recording.[1]
Confirm the release timing at the source
The Schedule of Releases for the Employment Situation is the U.S. Bureau of Labor Statistics’ own calendar of release dates and times by reference month — the authority for saying that the Employment Situation report for a given month is published at 8:30 a.m. Eastern. Use it to fix the timestamp rather than relying on any secondary account. It documents schedule only: it is not a forecast and says nothing about how any instrument will react. The agency blocks automated retrieval from this environment, so this page is linked for you to read directly rather than quoted from here.[2]
Identify the contract before logging anything
The CME Group product page for the E-mini Nasdaq-100 futures contract is where the multiplier, minimum tick and trading hours are published. Those details matter because the recording’s measurements are expressed in ticks and in index points, and specifications can change; confirm them on the exchange page before sizing anything. The exchange also blocks automated retrieval, so the link is given unquoted for direct reading.[3]
Keep the account limit beside the trade idea
The BestProps page Prop Firm Drawdown Rules Explained compares static, trailing, intraday, end-of-day, daily and balance-based drawdown calculations across named programs and links the provider documents it used. Read its own disclosure: its stated sources were checked on 2026-08-01, the page labels itself stale, and drawdown methods vary by firm, program, stage, account size and platform. A news-release case study is only usable on a funded account once the daily loss, trailing and news-trading rules are quoted from your own provider.[4]
Sources
- [1] YouTube: Case Study With NonFarm Payroll & NQ Futures August 07, 2026 — The Inner Circle Trader (source recording; transcribed in full and player tested from a BestProps origin)
- [2] U.S. Bureau of Labor Statistics: Schedule of Releases for the Employment Situation (official release dates and times by reference month)
- [3] CME Group: E-mini Nasdaq-100 Overview (exchange product page for contract size, tick and hours)
- [4] BestProps: Prop Firm Drawdown Rules Explained (document-based comparison; page states sources checked 2026-08-01 and labels itself stale)
BestProps is not affiliated with The Inner Circle Trader, the U.S. Bureau of Labor Statistics or CME Group, and nothing listed here endorses this page. Nonfarm payroll, NQ, dealing range, liquidity, fair value gap, order block and displacement appear only as descriptive study terms taken from the recording. Nothing on this page demonstrates a tested, repeatable or profitable result, and no claim is made that any level, entry or outcome described in the recording was verified on a live account.
This material is educational and general in nature. It is not individualised financial advice, a recommendation to trade NQ futures or a promise of trading results. Futures involve substantial risk, and participating during major economic releases can increase execution uncertainty.





