
Key takeaways
In ICT Price Action Chronicles – MOC Crushing The Buying & Selling Pressure Myth, ICT reviews the 4 August 2026 New York afternoon session on a one-minute E-mini S&P 500 chart and argues that a late reversal is better described by predefined ranges, liquidity resting above old highs and a fixed 3:50–4:00 p.m.
Read the full summary
In ICT Price Action Chronicles – MOC Crushing The Buying & Selling Pressure Myth, ICT reviews the 4 August 2026 New York afternoon session on a one-minute E-mini S&P 500 chart and argues that a late reversal is better described by predefined ranges, liquidity resting above old highs and a fixed 3:50–4:00 p.m. window than by the claim that “selling pressure” suddenly overwhelmed “buying pressure”. The recording sets out his reasoning, the levels he reports (7,786.00 and 7,761.75 against a 7,761.25 low) and a short entry he says he took. Speech alone does not verify the chart, the fills or the outcome. Read it as one trader’s case study: recorded explanation and reported execution, not verified performance and not a recommendation to copy.
How we researched this article
BestProps used document-based research from primary firm sources, checked September 14, 2026. The complete source list, scope, limitations, and commercial-state record appear near the end of this article.
Source note: This article is built from the lesson’s own timestamped captions, which were produced by automatic speech recognition. Specialised terms may be mistranscribed: the speaker’s “Fairbanks” is read here as “fair value gap” where the context supports it, and phrasing such as “buy-side imbalance, sell-side inefficiency” is reproduced as spoken rather than corrected. Nothing below was verified against a video frame, the trader’s own account records or a broker statement.
The lesson reviews a one-minute E-mini S&P 500 chart from the 4 August 2026 New York afternoon session. Its purpose is narrower than the title suggests: ICT shows how he journals a Market on Close setup, and why he describes the closing-hour reversal through time-of-day windows, liquidity and dealing-range measurements instead of the familiar after-the-fact story that selling pressure simply arrived.
Two things are worth keeping apart from the outset. The captions record what the speaker says, including his reported levels and his report of a short entry taken inside a gap. They cannot confirm that any candle, level or fill looked the way he describes. The article therefore attributes every number and every execution claim to the speaker rather than reporting it as a market fact.
The session and the ranges under review
ICT identifies the example as the Tuesday New York PM session for 4 August 2026, with the recording made the following day, 5 August. From 4:07 he begins with the regular-trading-hours range, measuring the 9:30 a.m. New York low against the session’s highest high before the 4:00 p.m. close. He then narrows the frame to the closing hour, which he shades from 3:00 to 4:00 p.m. Eastern at 11:11.
He also marks 1:30 p.m. as the start of what he calls the PM pre-market segment, with a 30-minute opening range from 1:30 to 2:00 p.m. Eastern at 8:52, the same structure he applies to the 9:30–10:00 a.m. equity opening range. In his session map, the morning session ends at 11:30 a.m., a two-hour lunch follows and the afternoon session resumes at 1:30 p.m. The dealing range he actually uses is defined at 13:44 as the 1:30 p.m. low paired with the highest high of the day.
The window that matters most is the final ten minutes. ICT calls it the Market on Close macro and defines it as 3:50–4:00 p.m. Eastern at 21:27. His stated sequence is top-down:
- Establish the regular-session high and low.
- Identify the range formed from the 1:30 p.m. reference low to the session high.
- Mark the nearby relative highs and lows he classifies as liquidity.
- Wait for price to interact with that liquidity as the 3:50 p.m. window approaches.
- Use candle behaviour to judge whether the anticipated reversal is developing.
Why the lesson expected a sweep first and a reversal second
At 11:03 ICT notes that price had been climbing all day and was sitting just under a group of highs as the closing hour began. He calls that kind of extended advance “long in the tooth” at 11:45, meaning it has run for long enough that consolidation or a retracement looks reasonable to him.

He is explicit that this is not a reason to sell merely because the market has risen. His stated expectation is that price should first rally through the nearby relative highs — the buy-side liquidity — and then reject. He summarises that Market on Close script at 15:47: clear the buy side, then reverse and move lower.
He also states his own uncertainty at 16:04, saying he does not know the reversal is happening until price starts running into the referenced high, and that he does not want to be short before that happens. Whatever a viewer makes of the setup, the recording does not present it as foreknowledge.
What “crushing the pressure myth” means in this lesson
The argument behind the title arrives at 12:47. ICT asks why selling pressure would appear at one exact high, to the tick, and where all the buying pressure went at that same instant. His alternative is that the turning point can be studied through predefined ranges, liquidity above old highs, time-of-day behaviour and mathematically derived levels rather than through pressure language.
Read carefully, that is a claim about explanation, not about mechanics. Every transaction still has a buyer and a seller. What he rejects is “pressure” as a precise description of why a turn happened at a particular place and time: saying that sellers took control after the fact does not locate the level in advance.
The measurement he applies instead is a Fibonacci grade of the dealing range. From 16:20 he describes dragging the tool from low to high with the negative 0.5 setting enabled, then anchoring a second measurement to the previous intraday high to derive a midpoint. At 17:59 he reports the resulting level as 7,786.00 and states that the relevant candle high printed there. That match is his reported reading of an unseen chart.
Candlestick confirmation inside ICT’s model
After the old high is taken, the lesson looks for bearish confirmation in candle structure. Around 19:49 ICT describes price breaking through and closing below a fair value gap, and treats that close as validation of a bearish bias under the order-flow rules he teaches. He then narrates the 3:50 p.m. candle opening, trading up into an inverted gap and breaking lower, with several lows to the left acting as the sell-side objectives he is watching.
He also states the condition on which those labels depend at 20:37: if the directional bias is wrong, the same imbalance reading fails in the operator’s hands. That is a rule-level caveat, not proof that the bias was right on this occasion.
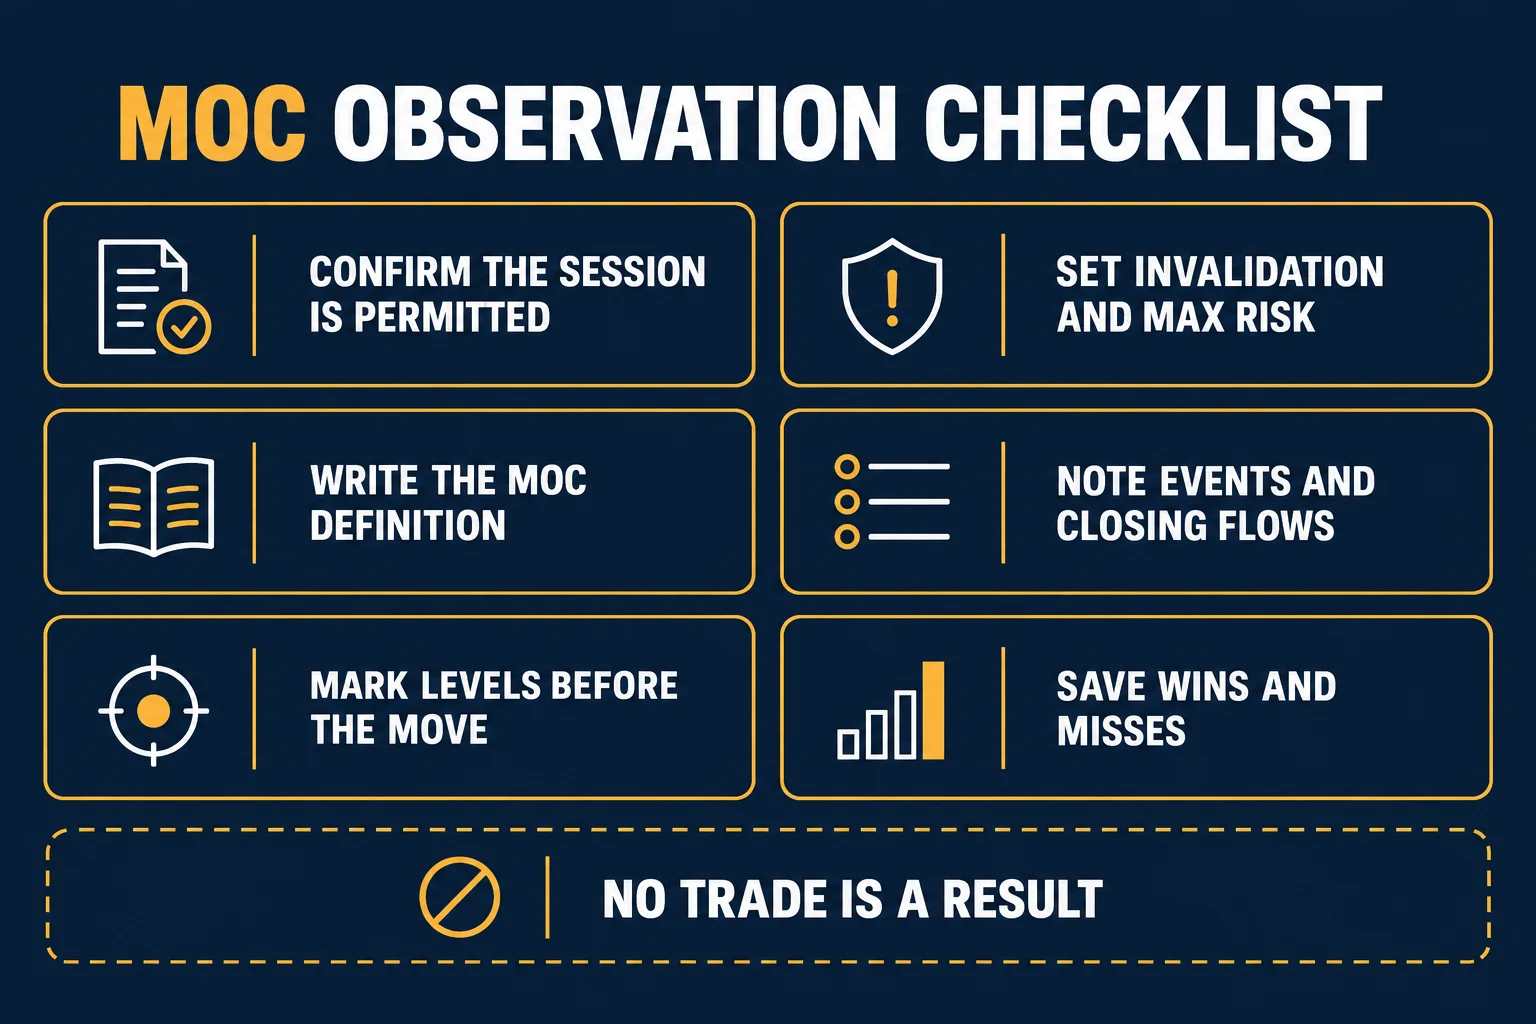
A study routine that follows the presentation without inheriting its conclusions would look like this:
- Write the range and time-window definitions down before looking at the result.
- Record the expected liquidity sequence in advance.
- Specify the candle behaviour that would support or invalidate the scenario.
- Compare many archived sessions instead of one selected example.
- Keep chart observations separate from claims about fills or profitability.
Range subdivisions and the reported objective
From 25:05 the lesson returns to the full daily range and divides it into halves, quadrants, octants and sixteenths. He reports a projected level of 7,761.75 at 26:35 and then a low of 7,761.25 at 26:42, calling the two-tick difference out at 26:53. It is presented as another instance of the precision he attributes to range subdivision; the numbers are his, and independent chart data was not available to check them.
He also describes partial exits, an adjusted stop and a fill that he interprets as possible manual intervention at 31:36, where he says buying pressure appeared two ticks above his stop. That interpretation rests on his own order records and assumptions about counterparties; the captions cannot establish it, and a spread widening or an ordinary stop run would look the same on a chart. The transferable content is the workflow — define the time and the range, form a conditional scenario, wait for confirmation, then journal what happened.
Journaling, discipline and the price-action distinction
Throughout, the lesson frames itself as journaling practice rather than a research paper. At 1:55 ICT says the point of the playlist examples is to show how to journal, and at 2:29 he recommends revisiting saved observations weekly or monthly, or when market behaviour looks disorderly.
He draws a firm line between studying price action and taking trades at 33:57, describing price action as the study of repeating phenomena and timed measurements without monetary risk or reward, and stating that he does not give trade advice or run a live signal service. The lesson is promoted as a recording rather than a call: the accompanying post on X, checked for this article on 13 September 2026, dates from 5 August 2026 and links this same recording.
That framing is the useful takeaway. The measurements and the reported fill are one trader’s worked example of a documented process; they are not evidence of a repeatable edge, and the captions contain no account statement, no verified P&L and no frame-by-frame chart confirmation.
The source recording
Watch the original lesson on YouTube
This lesson cannot be played inside another website: the embedded player itself reports “Playback on other websites has been disabled by the video owner.” That response was read from the player on 13 September 2026, so no player is reserved here and no embed is left blank. The lecture runs about 53 minutes and is available directly on YouTube.
Watch ICT Price Action Chronicles – MOC Crushing The Buying & Selling Pressure Myth on YouTube ↗
Sources for checking an explanation instead of a story about intent
Four references support this article: the recording itself, the exchange operator’s description of its on-close mechanism, the platform documentation for how one candle is built, and this site’s drawdown comparison page.
1. The recording and its own metadata. The mapped upload was checked directly for this article on 13 September 2026: the watch page reports the channel as The Inner Circle Trader, lists the video as public rather than unlisted, and carries an upload date of 5 August 2026 with a listed length of 3,162 seconds — about 53 minutes, matching the captions used here. That is what the page settles. The upload day is also one calendar day after the 4 August session the speaker says he is reviewing.
2. What an on-close mechanism actually publishes. The Nasdaq page Closing Cross: Price Discovery Facility states that the cross executes orders at a single price in the final moments of the trading day, sets the official closing price for Nasdaq-listed securities, launched in April 2004, and describes itself as publishing continuous information on order imbalances in the final minutes; it reports an average of 330 million shares representing $25.6B traded per day, sourced to the Consolidated Tape from January to December 2025. Scope matters here: that is the Nasdaq equities market, not the futures venue whose chart the lesson uses. It is evidence that closing auctions are documented, data-publishing mechanisms — not evidence that a candle at the close reveals who was buying or selling.
3. What a candle can and cannot show. The TradingView help page Time intervals: a quick introduction and tips explains that each candle carries four prices — opening, high, low and closing — for the selected interval, that the interval determines how much time forms one candle, and that available intervals run from ticks and seconds to months. A candle therefore aggregates trades. Its body and wick show the result of that activity, not the identity or intent of the participants behind it, which is the practical limit on any pressure story read from one bar.
4. The account rules that decide whether any of it is usable. The BestProps page Prop Firm Drawdown Rules by Calculation Method compares trailing, end-of-day, static and balance-based drawdown rules from provider documents, and discloses its own limits: it is document-based research, its sources were checked on 1 August 2026, it labels itself stale and asks readers to recheck before relying on it, and it states that no first-hand account purchase, trading or payout testing was performed for the report. Daily loss limits, consistency terms and restricted periods are outside its scope. Your own dashboard and the provider’s current document remain final.
Sources
[1] YouTube: ICT Price Action Chronicles – MOC Crushing The Buying & Selling Pressure Myth — The Inner Circle Trader (source recording; watch page checked 2026-09-13: public, not unlisted, uploaded 2026-08-05, length 3,162 s; timestamped automatic captions are the article’s primary evidence)
[2] Nasdaq: Closing Cross: Price Discovery Facility (exchange operator page on the on-close auction, the official closing price and published imbalance information; page read 2026-09-13)
[3] TradingView Help: Time intervals — a quick introduction and tips (platform documentation for how an interval builds each candle; page read 2026-09-13)
[4] BestProps: Prop Firm Drawdown Rules by Calculation Method (document-based comparison; page states sources checked 2026-08-01 and labels itself stale; page read 2026-09-13)
BestProps is not affiliated with The Inner Circle Trader, Nasdaq, TradingView or CME Group, and none of these sources endorses this article, this site or any setup. MOC, market on close, liquidity, fair value gap, premium, discount and PD array are used here only as descriptive study terms. Nothing on this page demonstrates a tested, repeatable or profitable result, and no claim is made that any level, window or sequence predicts price or repaints less. The lesson is a recording of one trader explaining his own process, including reported executions that this article does not verify.





