
Key takeaways
ICT’s Market Review & NQ Futures Trade Recap 07/08/2026 is a 28-minute session review built on a daily bearish order block he had flagged the previous day, reported in the transcript as 29,282.50.
Read the full summary
ICT’s Market Review & NQ Futures Trade Recap 07/08/2026 is a 28-minute session review built on a daily bearish order block he had flagged the previous day, reported in the transcript as 29,282.50. Working from the episode’s own automatic transcript, this article sets out how he grades a wick, how he defines the new day opening gap and the regular-hours opening range gap, how he labels the session a market maker sell model, and what he says about the short he took inside a breaker during his 10:50–11:10 a.m. Eastern macro window, the partial exit at his halfway “event horizon” measurement, and the final exit he describes near the regular-hours low. One probability figure he states (70% for a move to half the opening range gap between 9:30 and 10:00 a.m.) comes with no test or dataset in the recording. The transcript is machine-generated, the instrument is named only in the title, no chart was viewed for this review, and no fill, order or result is verified here.
How we researched this article
BestProps used document-based research from primary firm sources, checked September 14, 2026. The complete source list, scope, limitations, and commercial-state record appear near the end of this article.
The keyword phrase ICT market review and NQ futures trade recap 07/08/2026 points at one recording: Market Review & NQ Futures Trade Recap 07/08/2026 on The Inner Circle Trader, YouTube video ID JmAJfuSkY1g. This page is an independent, transcript-based review of that recording. It is not a transcript of the episode, not an official lesson, and not a claim about the channel’s or anyone else’s results.
What the recording is
- Title: Market Review & NQ Futures Trade Recap 07/08/2026
- Channel: The Inner Circle Trader
- Length: about 28 minutes (27:54 on the watch page; 1,674 seconds of audio in this review’s cached source, 328 timestamped segments)
- Market: NQ appears in the title only. The transcript never names the instrument or contract month, so the symbol, expiry and chart feed are treated here as unestablished.
- Watch page read: 2026-09-14, returning that exact title, a stated 2.22M subscribers, 52K views and a listed age of about two months
Timing. The recording reviews “yesterday’s commentary” at the outset (0:05) and then walks through the current session from the 9:30 a.m. open, so the title date is consistent with the session being discussed. The transcript does not independently fix the date of every charted session, and the gap definitions below depend on the speaker’s own chart time zone.
Source basis. The episode was transcribed from its full original audio by local automatic speech recognition (whisper-large-v3-turbo) on 2026-09-14: complete audio, no low-confidence spans flagged, and visibly garbled specialist terms and prices. That is machine transcription, not human-verified captions.
The framework carried in from the previous day
He opens by revisiting the order-block lesson from the prior session: the open of a particular candlestick is the bearish order block (0:10), and he restates his rule that the order block is the last up-closed candle when that candle is the largest, with consecutive candles treated as one block (0:35). He adds a conditional: that opening price is not pertinent to what price may do unless price gets below it, at which point he treats it as a change in the state of delivery (0:52).
The wick rule follows at 1:38: if there is a wick, it has to be graded. He identifies the midpoint of that wick as what he calls the consequent encroachment, and states the conditional plainly at 2:02: a close below it would warrant continuation lower, while a failure to close below it leaves room for retracement, consolidation or reversal.
The daily reference arrives at 5:44, where he identifies a red line as the 29,282.50 bearish order block on the daily chart, and says it was already utilised while he slept. That level is machine-transcribed from speech; it should be checked against the original chart, and this review did not see the chart. His reading of the wick above it, at 6:36, is that price neither closed nor touched the full wick, which in his framework is “exceedingly bearish” while price is trading at the daily bearish order block.
The two gaps he defines
Two definitions matter for everything that follows. At 7:38 he marks the pink box as a new day opening gap: the difference between where price settled at 4:59 p.m. Eastern and where the session restarted at 6:00 p.m. At 8:03 he draws the opening range gap as the reference between the prior settlement and the 9:30 a.m. regular-hours opening price, and at 16:41 he applies a Fibonacci measurement to that range, identifying its midpoint as consequent encroachment and noting that the new day opening gap sits inside the regular-hours opening range gap (17:36).
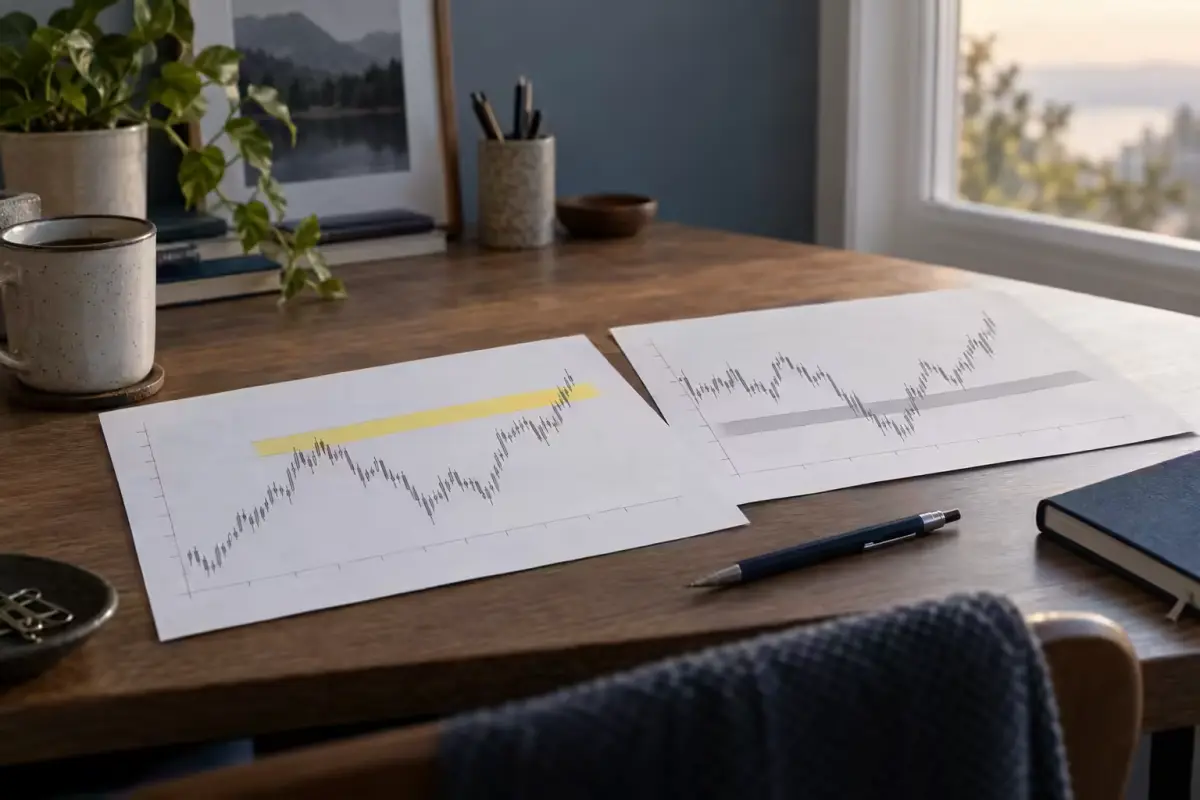
The one statistic in the recording is his claim at 17:08 that between 9:30 and 10:00 a.m. Eastern there is a 70% likelihood price trades to half of the opening range gap. He qualifies it with “not always, but 70% is pretty good odds” and supplies no data, sample or test. Treat it as the speaker’s stated claim about his own framework, not as a measured base rate, and note that a conditional “trades to” statement says nothing about how such a trade would be entered, sized or stopped.
The market maker sell model, and where it stops
From 3:17 he narrates the session as a market maker sell model: original consolidation, a test of that consolidation, two reaccumulation stages, a smart money reversal and a low-risk sell, then two distribution stages and redistribution. He also revisits a caveat he says he has always taught: sometimes the model does not take out the original consolidation (3:59), and he says the context here was one of those cases.
He walks the bearish reading in steps. Price traded up into the new day opening gap at the open but did not leave a candle body at or above its consequent encroachment, which he calls bearish against a rally that started exactly at 9:30 and went straight up (9:40). He then identifies a buy-side imbalance and sell-side inefficiency that becomes a bearish inversion fair value gap when the market breaks lower (10:13). At 10:41 he points to a small volume imbalance that the transcript renders as an open of 252.75 against a close of 29,252.50, describing the open as one tick higher. Those numbers are partially garbled by transcription and are not reusable as levels without checking the audio and chart.
His sequence continues with an unwillingness by price to lay a body at or below the consequent encroachment of that inefficiency (11:16), a break lower, a rally that fails to reach the gap’s low, another close below the imbalance, and a role reversal in which the gap stops supporting price and wilts through it (12:15 and 12:28). He defines the bearish breaker from a short-term high and a higher high at 12:51, explaining that he uses the candle body that goes lowest rather than a wick-bearing candle, and at 14:05 he lists what he sees converging: the macro window, the daily bearish order block, a purged high, and second-stage redistribution of the model.
The “macro” he keeps referring to is a time window he puts at 10:50 to 11:10 a.m. Eastern (13:34). Whether such time windows carry the significance he assigns them is his claim; the transcript contains no test of it.
The short he reports, and how he says it ended
The trade section begins with a candid admission. At 19:46 he says a lower area was swept during a move he missed while sleeping, calls it an easy trade in hindsight, and says he would definitely have shorted it. He then explains why he aimed at relative equal lows instead of the model’s original consolidation: that lower area had already been swept during the London session, so he expected a deep discount without a full clearance (19:34 and 21:04).
What he reports doing:
- He measured from one low to an older low and used the halfway point as his target, a measurement he labels an “event horizon” (22:56), and says price traded straight into it and he took a partial there (23:52).
- He says he got short inside the breaker, finessing the entry off a run that keyed off the bearish order block (24:04).
- He says the market worked around the 9:30 opening price and then broke lower to take sell-side liquidity (24:57), and that his exit reacted off the event-horizon level before failing to reach consequent encroachment (25:11).
- He describes a final limit-order exit collapsing near the regular-hours low of the day (25:34).
He also mentions an execution clip he posted on X (25:00). No direct link to that clip is cited here: social posts of this kind returned only a logged-out shell when checked in this campaign, so nothing from it is quoted or relied on.
Everything in this section is the speaker’s own account of his actions. There are no fills, order tickets, account records or verified entry and exit prices anywhere in the transcript, and this review saw no chart, so no result should be inferred from it. Note also that he narrates a move he did not take and a move he says he did take in the same session; the second is not independent confirmation of the first.
What he says happened afterwards
The last minutes describe the session turning back up: a rally out of the lows, an inefficiency that had acted as a bearish gap now lending itself to the bullish side (26:52), the 9:30 opening price used as a discount PD array, sell-side liquidity taken, buy-side liquidity taken and a full gap closure (26:46), then price spending a long stretch inside the new day opening gap and trading up to the consequent encroachment of an older inefficiency (27:18). He closes by describing the current position as “no man’s land” while price meanders sideways through the electronic session’s hourly break (27:35).
Read as a whole, the recap is internally consistent with his framework and does not establish that the framework predicted the session. The same chart is used to explain both a bearish break and a bullish reversal after the fact, which is a reason to study the method rather than score it from this video alone.
How to read a reported recap
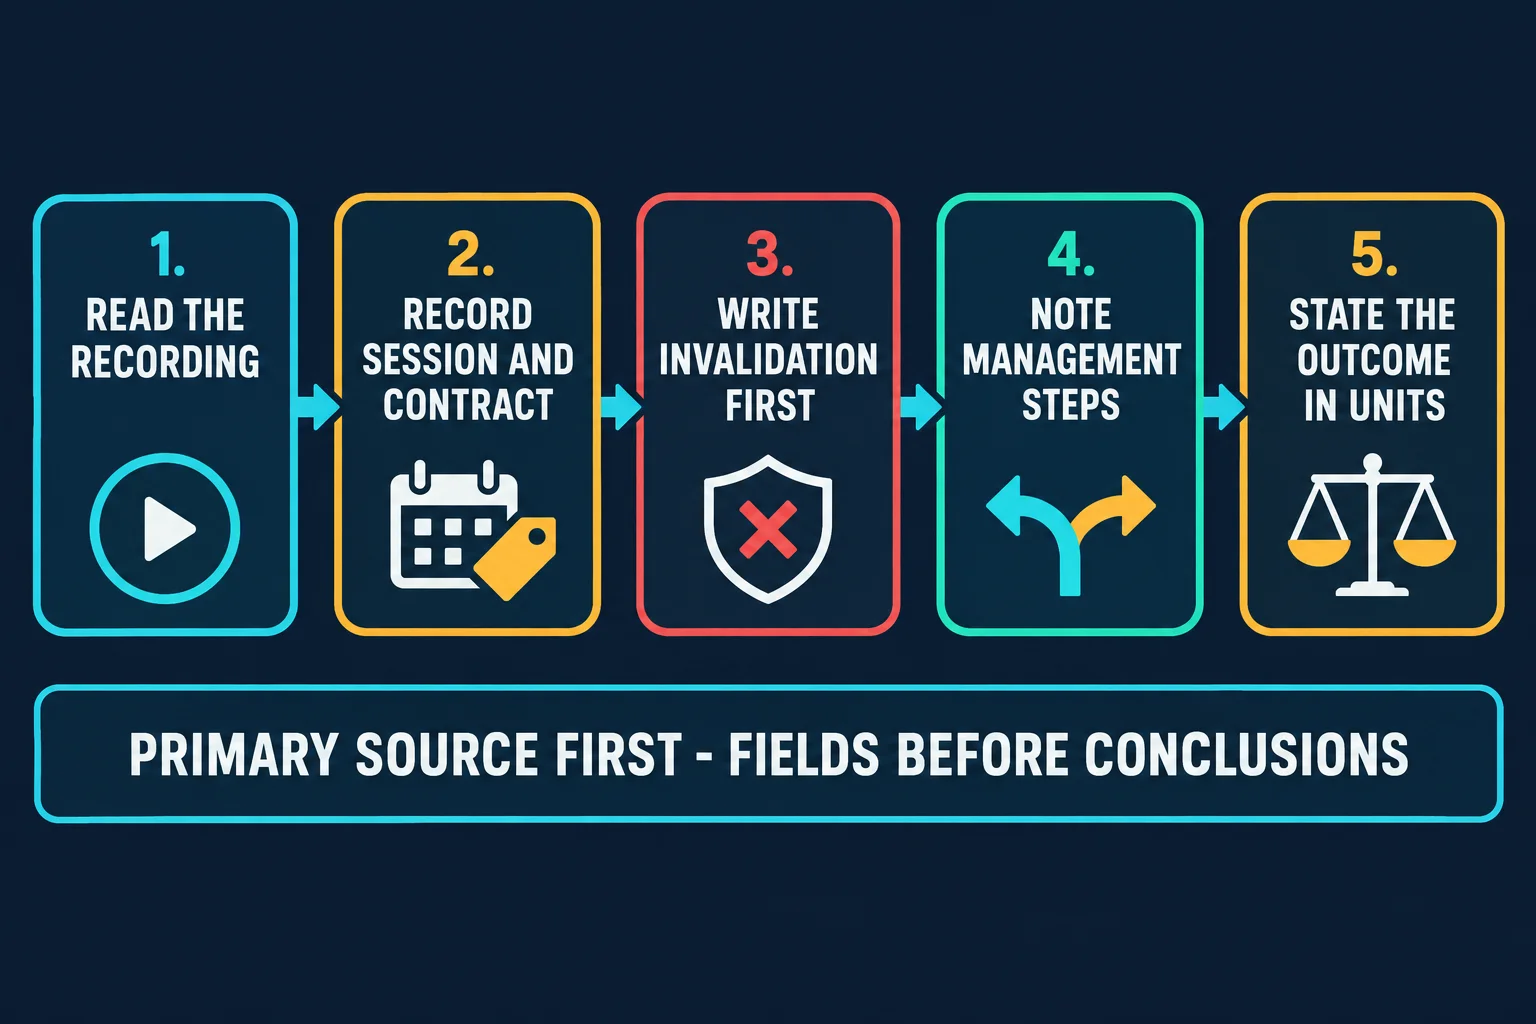
- Fix the session and the contract before the story. The title says NQ; the transcript never names an instrument or expiry, so any comparison with your own chart has to start by identifying what was actually being charted and in which time zone.
- Write the invalidation first. Most of this lesson is conditional: closes below a level support continuation, a failure to close leaves the alternative open. That structure is more useful than the levels themselves.
- Treat stated probabilities as unverified. The 70% figure has no dataset behind it in the recording.
- Keep reported trades reported. A partial, a finessed entry and a collapsing limit order are descriptions, not records.
- Watch the coaching, not just the chart. At 17:36 he tells viewers to slow down and rebuild the markings on their own charts, and at 17:57 that observing is not the same as learning. That part of the recording requires nothing from the viewer in the way of trust.
- Check your own constraints. Funded traders should confirm current news-trading, maximum-loss, trailing-drawdown and position-size rules, since the session discussed is a single day and the drawdown method in your programme may be calculated on unrealised profit.
Watch the original recording on YouTube
This recording cannot be played inside another website. A playback test of the embed markup used on this page, run on 2026-09-13 from a BestProps page origin, returned the player’s own message “Playback on other websites has been disabled by the video owner”, so no player area is reserved here and no empty embed is left behind. The recording remains available directly on YouTube.
Watch Market Review & NQ Futures Trade Recap 07/08/2026 on YouTube ↗
Sources for contract, session and rule context
Four references were read in a browser on 2026-09-14 for this article. None of them reports a market reaction, a price for the session discussed, or anything about the recording itself, and none is connected to the channel. Each supports general context only; the transcript does not name an instrument, so none of these links establishes what was being charted.
- [1] CME Group: E-mini Nasdaq-100 futures contract specifications (official exchange reference for the contract most often charted in this kind of recap; read 2026-09-14)
- [2] TradingView: NQ1! Nasdaq 100 E-mini futures symbol page (third-party chart platform reference; read 2026-09-14). Listed as the kind of chart product the speaker is narrating over, not as a source for any level in this article.
- [3] NinjaTrader: trading hours templates (third-party platform documentation for separating regular from extended session hours; read 2026-09-14). Relevant because both gaps in this recap are defined against session boundaries.
- [4] BestProps: prop firm drawdown rules by calculation method (this site’s own reference page; read 2026-09-14). Relevant because the trade described ran into a partial exit and a later exit, which is where trailing-drawdown definitions usually bite.
The primary source for everything attributed to the speaker above is the recording itself, Market Review & NQ Futures Trade Recap 07/08/2026, reviewed through its own timestamped transcript. BestProps is not affiliated with The Inner Circle Trader, CME Group, TradingView or NinjaTrader, and no source listed here endorses this article, this site or any setup. No trading result described in the episode is verified on this page, the quoted level and imbalance figures carry the uncertainty of automatic transcription, and nothing here demonstrates a tested or repeatable edge.





