
Key takeaways
In “ES Day Trade Review With 1min & 15Sec Timeframe” ICT reviews a short-side S&P 500 futures idea on the September 2026 contract, shown as a one-minute chart beside a 15-second chart (0:05).
Read the full summary
In “ES Day Trade Review With 1min & 15Sec Timeframe” ICT reviews a short-side S&P 500 futures idea on the September 2026 contract, shown as a one-minute chart beside a 15-second chart (0:05). His downside draw was the pair of relative equal lows from the previous Friday’s London session, with sell-side liquidity resting below them; he says he placed his objective just ahead of the level rather than demanding a perfect touch (0:36, 1:13). The entry premise came from a short-term high he describes as a fulcrum point in a swing-trading model taught in his earlier core content, with the advance up to that high supplying a measured move projected lower (4:09). He marks the 1:50–2:10 p.m. Eastern macro, describes price rolling over and trading into an inversion fair value gap, and reports taking a first partial below it, further partials as sell-side liquidity was run, and a final exit just before the next set of relative equal lows (7:09, 9:19, 11:19). His closing point is that a 15-second chart does not make the market move faster, it only divides the same movement into smaller observations (16:04). Every price, partial and result mentioned here is his spoken narration of a chart the reader cannot see: the transcript cannot verify the markings, orders, fills or account outcome.
How we researched this article
BestProps used document-based research from primary firm sources, checked September 14, 2026. The complete source list, scope, limitations, and commercial-state record appear near the end of this article.
Risk disclosure: Futures trading involves substantial risk and can result in losses exceeding the amount initially committed, depending on the account and the product. Very short timeframes can amplify execution errors, transaction costs and emotional decision-making. This article is educational and is not individualized financial advice or a trade signal.
What this ES review actually contains
The recording opens with a spoken walkthrough of an S&P 500 futures trade and then continues into the unedited execution footage. ICT says the remaining portion is played back at speed and that there is no audio for it (15:38, 15:52). The spoken explanation therefore covers roughly the first sixteen minutes, and everything after that is a silent screen recording whose order tickets, sizes and results are not narrated anywhere in the source.
This article is independent educational commentary on that recording. It is not a transcript and not an official ICT publication. The source is automatic speech recognition of the full original audio with automated timestamps, so terms and numbers were checked against their surrounding context; the reviewer of this article has read that transcript and has not seen the charts, the platform markings or any account statement.
Splitting the one-minute and 15-second charts
He sets the review up with a one-minute chart on the left and a 15-second chart on the right, noting that each candle on the smaller interval covers fifteen seconds, which means four bars inside every one-minute candle (0:05). Later, at the end of the spoken portion, he makes the point that the smaller interval is not moving any faster than an hourly chart: it only changes how finely the same movement is divided, which can create the illusion of speed and should be used to read price delivery around PD arrays and key levels rather than to generate a fresh thesis every few seconds (16:04).

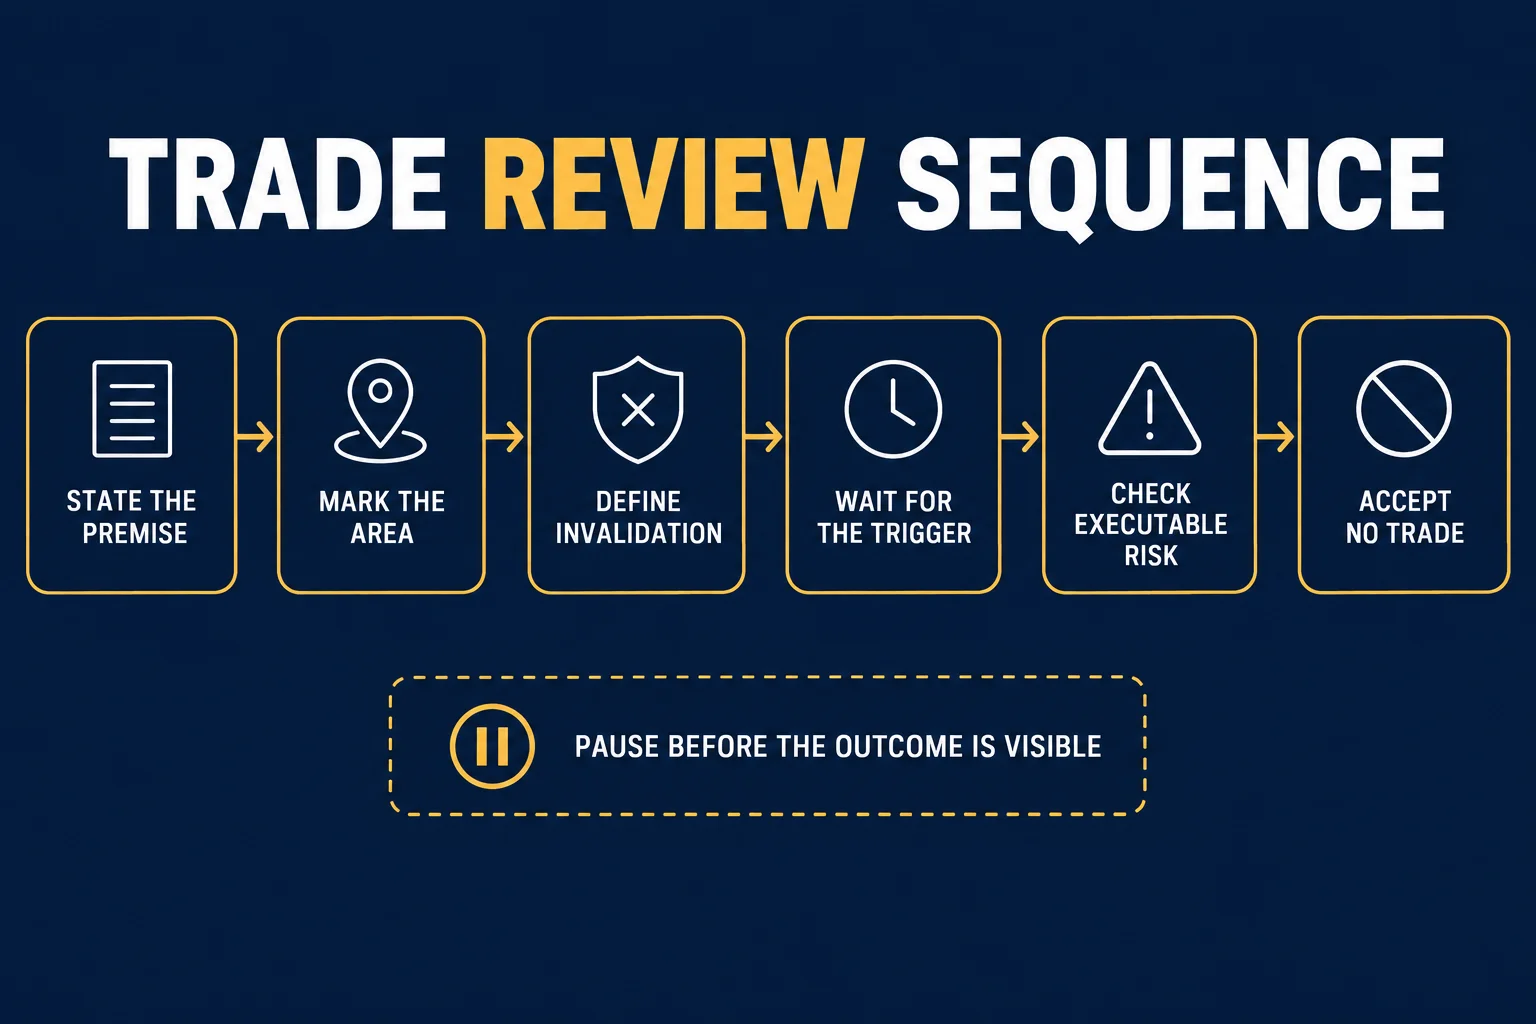
The division of labour this article uses, and which the featured schematic illustrates, follows from that: a higher timeframe supplies session context, the one-minute chart carries the setup, directional premise and invalidation, and the 15-second chart is reserved for inspecting the execution sequence around those predefined levels.
The downside objective: last Friday’s London relative equal lows
His first reference is a pair of relative equal lows from the previous Friday’s London session, which he calls clean, perfect lows and marks as the level he was willing to trade down into (0:36). He also marks the swing low and a block in that same area. The transcript renders that term as “suspension block” on each of the five occasions he uses it, so it reads as a deliberate label rather than a one-off mishearing; even so, no definition is given for it in this recording and it is left unexpanded here rather than guessed at.
The important operational detail is what he did with the level. He says he did not need price to reach the deepest marked area, that he placed limit orders just ahead of it, and that he wanted to get out before price traded down to the lows — aiming for the sell-side liquidity he believed was resting just below rather than for a perfect touch of the block (1:13, 1:26). He then carries those annotations down onto the 15-second chart, drawing the London-session lows, the swing low and that block so the same levels are visible at both intervals (3:00). That is his description of the markings, not something a reader can check.
The short-side premise: a fulcrum point and a measured move
From 4:09 he explains why he was selling from a short-term high: he felt the market was likely to continue lower, so he wanted to see that high sell off. He calls the high a fulcrum point inside the swing-trading model he says he teaches in the core content lectures from the 2016–2017 months, and describes the advance from the prior low up to that high as a measured move that should project downward if price turns lower (4:25).
Rather than holding only for that full projection, he says he used the relative equal lows as what he calls a low-hanging-fruit objective, entered on the way down and was out ahead of the deeper level (4:53). The structural idea is worth separating from the outcome: define the directional target from earlier session structure, wait for short-term price action to support it, and manage at intermediate areas instead of depending on a single all-or-nothing exit.
ES versus NQ, and why he used S&P for this example
From 5:07 he contrasts ES with Nasdaq futures, pointing to repeated candle opens and closes sitting at the level he had marked, and calling the S&P the “gentleman’s market” because he finds its delivery more precise and its pace slower than NQ, which he describes as more exaggerated and wild (5:34). These are his qualitative impressions from one chart, not comparative statistics, and the video offers no measurement of either market’s predictability.
He says the reason he traded S&P on this occasion was feedback claiming his approach only works on NQ, and he presents the ES example as a demonstration that his concepts are not instrument-specific, listing Forex, commodities and bonds as other markets he says they apply to (13:16). Whether the same framework transfers across markets is his assertion from a single reviewed trade; it is not established by this recording. His practical advice is the transferable part — do not pick a contract because an educator prefers it, match the instrument to your own temperament, and expect a slower market to suit some traders better than a faster one (6:43).
Macro window, inversion fair value gap and partial exits
At 7:09 he marks the macro window running from 1:50 p.m. to 2:10 p.m. Eastern and says that within it price rolled over, broke below the lows, came back up and broke lower again into an inversion fair value gap (7:41). He reports taking his first partial just below that gap (7:55).
He then describes price working inside the inversion fair value gap, popping above it only to run into a further imbalance — rendered in the transcript as “sibby”, which in his usage elsewhere refers to a sell-side imbalance, buy-side inefficiency (SIBI) — that contains a volume imbalance (8:16). Two price levels appear in this stretch: he reads candle bodies as stopping at 7754.50 to the tick on the open, close and open sequence (8:35), and later cites 7751 even on a candle open and high (9:32). Those are values he reads aloud from his own chart; the transcript cannot confirm the displayed contract values or any execution price.
From 10:39 he explains that a fair value gap trades through and, when he is bearish, comes back up and is treated as a premium array before price works below the sell-side liquidity pool. He says he took another partial as that run below liquidity occurred, then took smaller exits as price continued lower, and describes his final exit as sitting just ahead of the next set of relative equal lows (11:02, 11:19). He adds that price later came back up, broke lower once more and returned to those same levels, that the market was thin overnight on the 15-second chart, and that on the one-minute basis it had simply been chopping sideways (11:26).
Reported context from the same morning session
Two reported outcomes belong in the record because he raises them himself. He says that morning he posted a figure he initially got wrong — giving it as $29,984 — for a level he wanted to see traded on Nasdaq, that price did not offer him that level, that he traded the morning low instead and took out what he describes as the equivalent of 30k in price action, and that the balance was then stopped out “in the black”; he says he moved to 15-second scalping afterwards (12:19, 12:46). These are his own accounts of his own trading. The recording contains no statements, no order records and no account data, so the figures cannot be verified here, and “stopped out in the black” is a description of his outcome rather than evidence of a repeatable process.
Looking forward, he notes that US CPI was due the following morning at 8:30 a.m. Eastern and says plainly that he would not attempt to forecast the print (11:50). That is worth keeping in mind when reading any lower-timeframe review: the session structure can look orderly in hindsight even when a scheduled release was pending.
Educational takeaway
The reproducible element here is the order of operations rather than the trade result. A prior session supplied the levels, a higher-timeframe objective supplied the direction, a short-term high supplied the trigger area, and the smaller interval was only used to inspect delivery around those predefined references. The same structure is available to any student who writes the premise down before the move: what price had to do first, what would have invalidated the idea, and where the exit was planned.
What the recording cannot supply is proof. One reviewed session shows that a plan existed and that he says it was followed; it does not show that the levels were chosen before the outcome was known, that the displayed orders were the ones described, or that the approach produces consistent results. Treat it as a worked example for study, and verify contract specifications, session hours, margins and fees with the exchange and your broker before sizing anything.
Related ICT video: ES Day Trade Review With 1min & 15Sec Timeframe
The mapped source recording is ES Day Trade Review With 1min & 15Sec Timeframe from The Inner Circle Trader. This BestProps article is independent educational commentary grounded in that recording’s transcript: it is not a transcript, not an official ICT lesson, and not evidence that any entry, exit or result described in the recording occurred as reported.
Watch the original recording on YouTube
This recording cannot be played inside another website. A test run from a BestProps page on 14 September 2026 loaded the YouTube player for this video and the player itself returned “Playback on other websites has been disabled by the video owner” with no playback position and no media data, so no player is embedded here and no restriction beyond that message is asserted. You can watch the full recording, including the unedited execution section, directly on YouTube.
Watch ES Day Trade Review With 1min & 15Sec Timeframe on YouTube ↗
Reference material for this review
Three references support the practical side of this article: the exchange product page for the contract under review, the charting documentation for time intervals, and the drawdown-rules page that governs how much room a futures account actually has.
Check the contract at the exchange
E-mini S&P 500 futures are an electronically traded contract one fifth the size of the standard S&P futures contract and are based on the underlying S&P 500 index; CME Group’s product page sets out the contract’s features, its leverage and the ways it differs from holding S&P 500 ETFs.[1] Because the recording names a specific delivery month, confirm the exact contract, its tick value, session hours and margin treatment with the exchange and your broker rather than inferring them from a review video.
Understand what a 15-second interval is
TradingView’s help page explains how candle intervals work, how to choose one, how to build a custom interval by minutes or days, and that tick-based intervals count price ticks rather than fixed blocks of time.[2] It is the reference for the distinction the recording relies on: changing the interval changes how the same movement is sliced, not how fast the underlying market moves.
Size against the drawdown rule you are actually under
BestProps’ own drawdown-rules reference compares static, trailing, intraday, end-of-day and daily loss models across checked prop-firm sources, and notes that intraday trailing can tighten while a trade is still open because unrealized profit can raise the peak, while end-of-day trailing usually waits for the closing balance.[3] That is the constraint a reader should apply to any short-timeframe idea taken from a video, because how much room an account has is set by the firm’s rules, not by the setup.
Sources and tool documentation
- [1] CME Group: E-mini S&P 500 futures
- [2] TradingView Help: Time intervals — a quick introduction and tips
- [3] BestProps: Prop firm drawdown rules by calculation method
BestProps is not affiliated with CME Group, TradingView or the Inner Circle Trader, and no source listed here endorses this article or any setup. Relative equal lows, sell-side liquidity, inversion fair value gap, volume imbalance, PD arrays, macro and fulcrum point are used as descriptive study terms taken from the recording, and the term rendered “sibby” has been interpreted as his SIBI construct rather than a different label. Nothing on this page demonstrates a tested, repeatable or profitable result; any practical application involves substantial risk and this review is for education only.





