
How we researched this article
BestProps used document-based research from primary firm sources, checked September 14, 2026. The complete source list, scope, limitations, and commercial-state record appear near the end of this article.
In Chain Of Custody Of Price With Daily Inefficiencies, ICT reviews how an inefficiency identified on a daily chart can be subdivided into reference levels and then carried onto a one-minute chart. The central idea is a form of top-down chart organisation: start with one specific daily range, keep its boundaries and internal divisions, and observe how intraday price behaves around those same levels.
This is ICT’s account of his own session, not independent evidence that the levels predict price. The article was built from an automatic speech-recognition transcript of the recording’s audio — not from the video’s own captions — so the wording, times and numbers below carry that caveat, and the charts themselves were not inspected. Timestamps mark where each passage begins.
Starting with the daily-chart inefficiency
ICT opens by revisiting commentary he says he gave during a Sunday Trader Roundup X Space. In that conversation he identified a daily-chart volume imbalance as a likely draw on price, followed by a sell-off, and he links that area to Friday’s new day opening gap (0:56). Asked what timeframe the levels are anchored to, he answers plainly: the daily chart (1:38).
The phrase “chain of custody” is a useful label for the workflow, but it is not developed as a formal definition in the recording. What he actually demonstrates is continuity of reference: a higher-time-frame price feature stays the source of the analysis as he moves to lower time frames, instead of new intraday levels being chosen without context. He calls the subdivisions gradient levels.
Octants, quadrants and consequent encroachment
He divides the selected daily inefficiency into a sequence of octant and quadrant levels, and identifies the midpoint he calls consequent encroachment. At 7:17 he describes measuring from the high of the May 5, 2026 daily structure to its low and projecting the resulting subdivisions forward — the high, upper quadrant and upper octant levels above the midpoint, then the lower octant, lower quadrant and the low of the structure below it.
He is visibly working with hand-drawn annotations rather than a mechanical tool: at 5:34 he notices that a Fibonacci anchor on his chart is set incorrectly, comments that he does not know why the platform is displaying a level that way, and continues, describing the result as good enough for the purpose. That is a useful reminder that the plotted boundaries in the recording are discretionary.
- Parent range: the high and low of the selected May 5 structure establish the boundaries.
- Midpoint: consequent encroachment acts as the central reference.
- Quadrants and octants: further divisions create intermediate levels above and below that midpoint.
- Projection: the same daily-derived levels stay on the chart when he drops to the one-minute view.
How ICT reads the one-minute reactions
After returning to the one-minute chart (6:39), he points out how price used those projected levels, including the overnight trade into Friday’s opening gap, which he says lined up with the lower imbalance level. His focus is not simply whether a wick touches a line. Around 11:00 he highlights candle bodies staying outside the upper half of a referenced area, with a body resting on top of an octant just before the midpoint, and reads that behaviour as supporting a move lower.
That reading is discretionary. The transcript gives no mechanical rule for how many candles are required, how far a body may penetrate, or when the idea stops being valid, and it cannot establish from an unseen chart that each reaction happened exactly at the printed level.
He also discusses several short entries, partial exits and stop-outs rather than a single clean trade. He says an initial position was stopped after he had taken a partial, that he re-entered short, and that he wanted a limit entry but chose to be in the position so he could manage it (8:16). The recording does not show order tickets or account statements, so these remain reported executions.
Using the levels for trade management
From about 11:30 he shifts from directional analysis to position management. As price approaches successive octants, quadrants and the daily low, he describes taking partial profits instead of requiring the whole position to reach one final target, and he says he treats those levels as places where a reaction — and therefore a reduction in exposure — may be available.

His stated expectation was not fully met: around 9:09 he says that price came back up into the upper volume imbalance and that he had expected it to get “really heavy” and, for reasons he does not explain, it did not. Later he notes that price went slightly beyond one of his exits and argues for being content with a good enough portion of a move rather than chasing the whole of it (13:16). Both points are about his own execution approach; neither is a performance claim.
When the framework stops being useful
The recording also covers inactivity. During what he identifies as the New York lunch period, price begins spending more time between nearby subdivisions, and he points to a small “retail bull flag” that fails. At 14:39 he says that prolonged movement between octants and quadrants is usually a signal to stand aside rather than force another trade.
That is an important qualification: mapped levels do not create a setup by themselves. In his framing their relevance depends on context, on the directional expectation and on how price delivers into or away from them, and a narrow, indecisive range can offer less clarity even though the identical daily references are still visible.
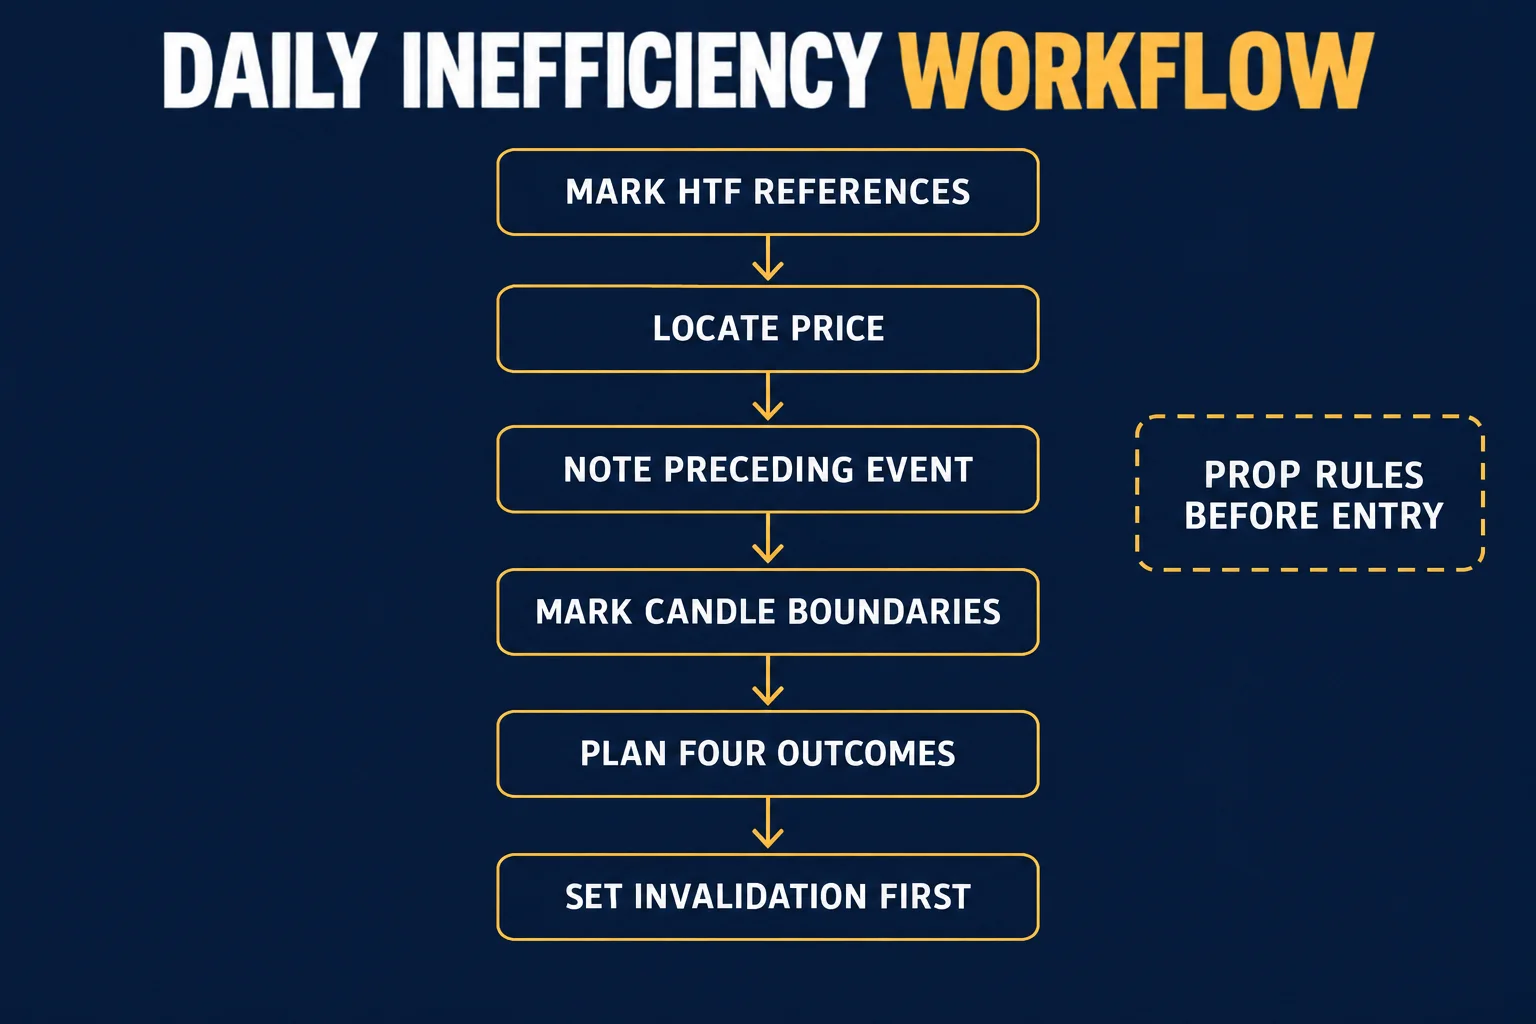
Marking daily inefficiencies: a six-step study workflow
The recording does not present a numbered checklist, but the same order of work recurs in it. Written out — as a study process rather than as ICT’s own numbered method — it looks like this.
- Mark the higher-time-frame references. Choose one daily structure and keep its boundaries fixed (7:17).
- Locate price. Note where the current session sits relative to those boundaries — inside the range, between subdivisions, or at an edge (6:39).
- Note the preceding event. Record what created the imbalance and what the surrounding session delivered into it (0:56).
- Mark the candle boundaries. Divide the range into quadrants and octants so the levels are written down before the session, not drawn after the fact.
- Plan four outcomes. Price delivers to the next subdivision; price rejects and returns through the parent boundary; price stalls between subdivisions; price reaches the level but no confirmation appears. Only the first two are actionable ideas.
- Set invalidation first. Decide in advance what would show the reading is wrong — the recording’s own examples include stops being taken on the way to the objective.
Account rules belong before entry rather than after: a funded account’s drawdown, instrument and holding-period limits can remove a setup that the chart alone would allow.
What the recording does not establish
Several things should be treated as unverified. The session is reviewed after the fact on an annotated chart, and while ICT says he showed a stop loss live and posts his executions, the transcript contains no account statements or order data, so the entries, partials and stop-outs he narrates are his own account of them. The recording also does not establish which calendar day the reviewed session took place on; it refers to a Sunday X Space and to “Monday”, while the May 5, 2026 structure it measures belongs to an earlier date.
Numbers need care. The speech recognition renders the price levels he reads off the chart inconsistently — one passage produces “28,000…9.25” and another “28,0007.75” for what he treats as effectively the same opening price — and a reference to relative equal highs “between 190 and 200” is likewise an automated rendering. Those figures should be read off the video rather than quoted from this summary. Terminology is affected in the same way: he says “buy-side imbalance, sell-side inefficiency” and “consequent encroachment”, but recognition renders both phrases inconsistently, including as “consequent encouragement”.
Finally, his broader claims — that the levels are algorithmic and repeat, and that the technique is unique to his material — are his interpretation. Nothing in the transcript independently verifies them, and the levels themselves are drawn by hand on a chart that a reader of the transcript cannot see.
An educational way to review the lesson
Stripped of the specialised vocabulary, the workflow is a hierarchy of references: identify a specific higher-time-frame range, record its boundaries and midpoint, divide it into consistent internal segments, carry those references onto the execution timeframe, observe acceptance or rejection around them, and avoid treating every touch as a mandatory entry.
Near the close he acknowledges unusually high volatility and the difficulty of finding consistency, especially for a newer trader. At 16:27 he says he is showing executions and getting stopped out sometimes, and describes the available responses as considering a re-entry, standing aside, or reversing — then warns against letting a difficult stretch turn into a toxic mindset. A cautious study process would therefore keep the losing and no-trade examples alongside the ones that worked, and would log what was expected before each session rather than only what printed.
Watch the original ICT lesson
This article draws on an automatic transcript of the audio of Chain Of Custody Of Price With Daily Inefficiencies. That transcript is a source for the speaker’s words only; it is not the video’s own captions, it is not independent proof of the reported executions, and the annotated charts remain essential if you follow the lesson on the video itself.
Watch the original lesson on YouTube
This video cannot be played inside another website: when its embedded player was loaded and clicked on 14 September 2026, the player reported “Playback on other websites has been disabled by the video owner” and offered only a “Watch on YouTube” prompt, with no duration and no playback progress. That response is why no player is reserved or left blank here; the recording is available directly on YouTube.
Watch Chain Of Custody Of Price With Daily Inefficiencies on YouTube ↗
Primary source and further reading
- The original Inner Circle Trader recording: use the timestamp links above to compare each explanation with its source passage.
- TradingView help: time intervals: vendor reference on how a charting platform groups and displays intraday intervals.
- TradingView help: how to turn Bar Replay on: relevant to the replay-versus-live distinction that is repeatedly raised about published executions.
- LuxAlgo “Smart Money Concepts” indicator (third-party, unofficial and untested): a community script that approximates similar concepts; it is not ICT’s method, has not been tested here, and should not be treated as reproducing the levels in this recording.
- BestProps: prop firm drawdown rules by calculation method: this site’s documented comparison of drawdown models, relevant to the account-rules step above.
This is independent educational commentary. It is not official ICT material, a tested trading system, or a claim that the reported executions can be reproduced.





