
How we researched this article
BestProps used document-based research from primary firm sources, checked September 14, 2026. The complete source list, scope, limitations, and commercial-state record appear near the end of this article.
In ICT Algorithmic Time & Price Grids, ICT reviews a Nasdaq September futures chart and explains how he combines higher-time-frame price levels with intraday time windows. His central idea is that a grid has two dimensions: horizontal price references taken from a measured range, and vertical references taken from time.
The lesson is presented entirely in ICT’s own market model and terminology. His view that price delivery is algorithmically scripted and predictable is his interpretation, not an independently established trading edge, and the recording shows no account statements, order fills or verified outcomes. This article was built from an automatic speech-recognition transcript of the recording’s audio — not from the video’s own captions — so the wording and numbers quoted below carry that caveat, and the chart itself was not inspected. Timestamps are machine-generated and mark the point in the recording where a passage begins.
Starting with higher-time-frame context
ICT opens on a daily chart of the September Nasdaq futures contract and walks through an aggressive decline that overlaps the previous day’s FOMC session. He highlights two shaded daily areas he calls suspension blocks, then narrows his attention to the unshaded space between them. At 0:38 he introduces the weekly-low narrative and the two higher-time-frame areas that organise the rest of the review.
On the one-minute chart he marks the 9:30 a.m. New York opening price and describes what happened around it. In his account, the market opened above a short-term high, took buy-side liquidity, then traded down to relative equal lows a few minutes later, reaching sell-side liquidity at 9:33 (4:39). He treats that order of business as support for a bias he had already stated before the open, not as a standalone entry signal.
The one-minute explanation begins around 2:11. Its practical lesson is that the same candle pattern can be read differently depending on where it forms relative to the daily references. He explicitly rejects waiting for a pattern to be labelled an “engulfing candle” and then chasing it, and argues that his judgement of where price was likely to turn came first.
How ICT grades wicks and candle bodies
A recurring mechanical step in the lesson is to take a prominent wick and divide it in half. He calls that midpoint “consequent encroachment.” Under a bullish reading he wants candle bodies to stay in the upper half, above the midpoint, while allowing a wick to pass through it; under a bearish reading he applies the inverse test. He also singles out the longest wick in a sequence as the reference that sets where bodies should not trade below. At 7:11 he applies this grading process after the move through the relative equal lows, treating the failure of later bodies to trade beneath the wick midpoint as bullish order-flow evidence.
The same body-versus-wick test is then applied to fair value gaps and inversion fair value gaps. At 48:31 he sets out the three-candle construction — one candle, the middle candle that creates the inefficiency, and a third candle — and argues that the gap only counts inside his model when the middle candle is touching a measured key level.
In one example, at 35:16, price closes outside an imbalance. He reads that failure and close as validating the area as an inversion fair value gap, and describes how its “first utilisation” flips from supporting one side of the market to the other. These are rules inside his framework; the transcript does not show that they hold beyond the session he reviews.
Octants, quadrants and anchored PD arrays
The price side of the grid comes from dividing a selected range into quadrants and octants. At 29:09 he lists what that range might be: an inefficiency, an opening range gap, a new week opening gap or a new day opening gap. He then looks for one of his price-delivery arrays — order blocks, breakers, fair value gaps and inversion fair value gaps — to form at one of those subdivisions.

At 16:19 he sets this out as homework for viewers. His stated rule is that a pattern’s visual resemblance is not enough: the array has to be anchored to a quadrant or octant level of the range being measured, and that anchor is what validates it. He contrasts this with adding outside tools such as market profile or footprint studies, which he says dilute the model rather than improve it.
The time axis of the grid
The clearest definition of the grid appears from 27:43, where he announces “here’s your grid.” The price levels he has marked become the horizontal lines. The vertical references come from the beginning of a macro window, the top of the hour and the close or start of the next macro window (28:54). He compares the intersections to reading a multiplication table, and describes two primary functions: identifying a key level derived from an octant or quadrant, and knowing what is being measured and graded.
He refers to times including 9:50, 10:10 and 10:50. The 9:50–10:10 macro is discussed at 20:46, where he points out that the lowest candle of that window printed at 10:10. Later, at 42:48, he notes the last candle of another move forming ten minutes after 11 — 11:10 — as the close of a macro. Because those time labels come from an automated transcript of the audio, the window boundaries should be checked against the recording before being copied into any schedule.
One qualification he repeats is that a trade does not have to be taken inside a macro. At 36:07 he says the macro matters as an indication of time influencing price: in his model it can initiate a move whose price structures stay relevant after the window has closed.
Low-resistance runs versus efficient delivery
He distinguishes two ways price can travel upward. A fast expansion with large candles he calls a low-resistance liquidity run. A narrow, persistent overnight rise built from small candles he describes instead as efficient delivery, or a buy program. At 14:50 he explains why he expected the faster kind once price was inside the open space between the two daily reference areas.
This distinction matters because his forecast covers the manner of delivery as well as direction. A slow, overlapping advance where he expected expansion would weaken that particular narrative even if price initially moved the way he anticipated — a useful reminder that a chart plan can be falsified by how price travels, not only by where it stops.
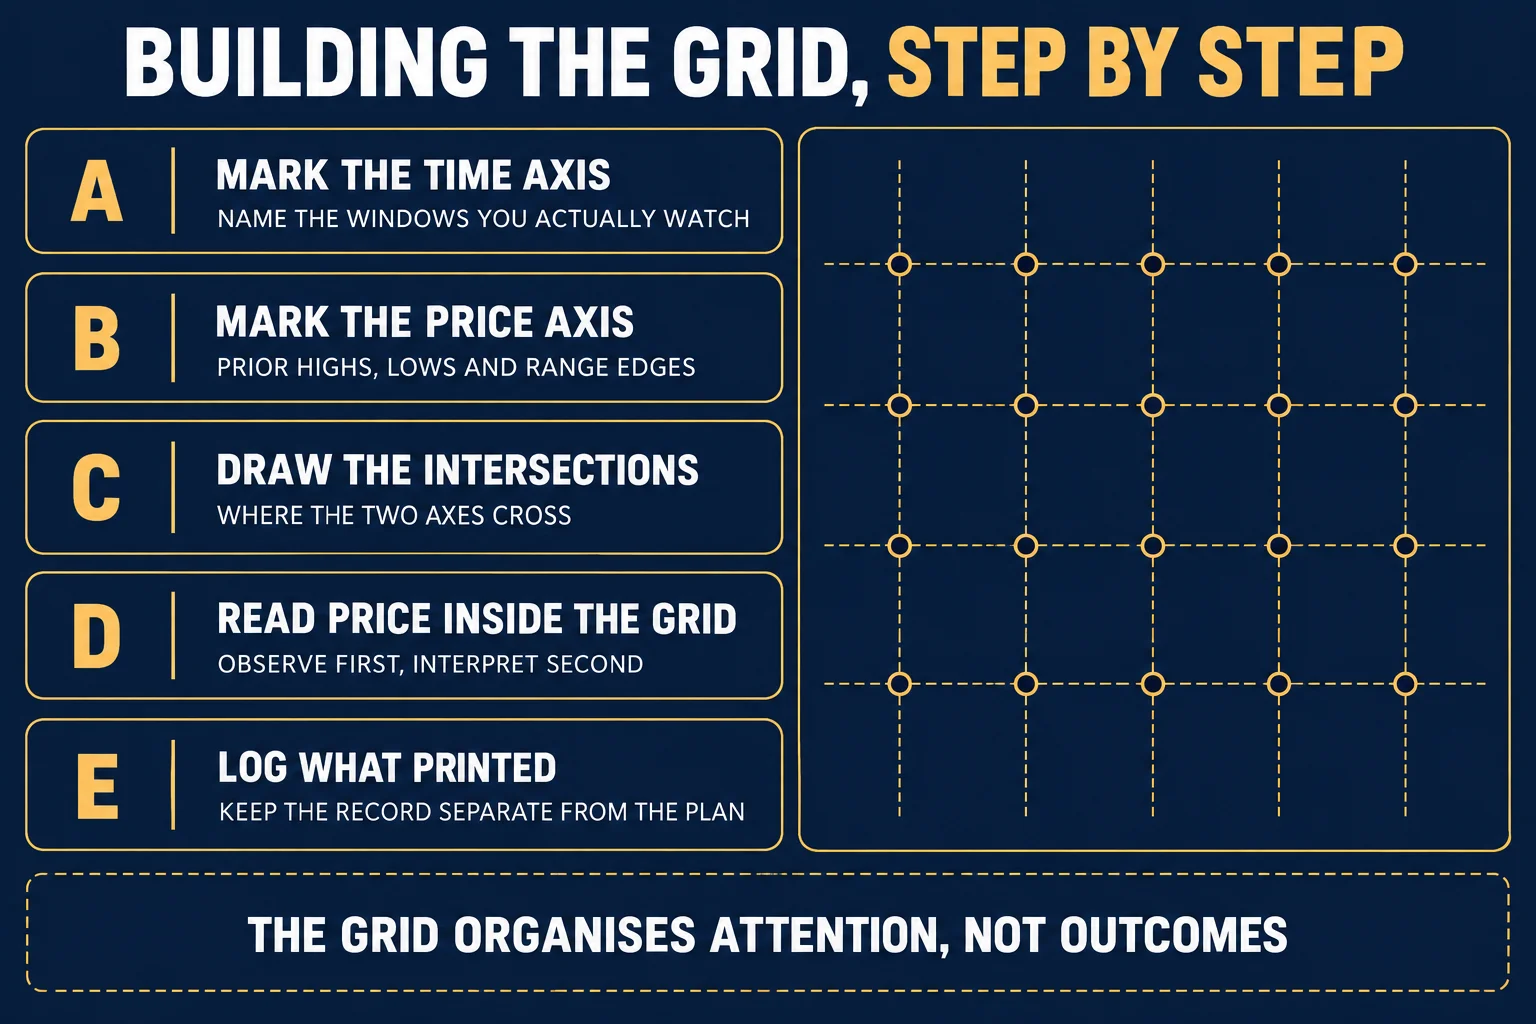
Building the grid: the five steps
Reduced to its mechanics, the process he demonstrates runs in the order shown in the schematic below.
- Mark the time axis. Name the windows actually watched: macro start, top of the hour, macro close (28:54).
- Mark the price axis. Prior highs and lows, session boundaries and range edges, then divide the chosen range into quadrants and octants (29:09).
- Draw the intersections. Require a price-delivery array anchored to one of those levels before treating it as a level worth watching (16:19).
- Read price inside the grid. Check where bodies close relative to the relevant midpoint, and whether a gap has been closed through and reinterpreted (7:11, 35:16).
- Log what printed. Keep the record of what actually happened separate from the plan, including sequences that failed.
That last step is close to the study method the recording itself recommends. At 12:29 he tells viewers to work through historical examples until the patterns are recognisable, then to read live price without trading at all — not even on a demo — before risking anything.
What the recording does not establish
The session is reviewed after the fact on a marked-up chart. The transcript contains no account statements, no order tickets and no independently verifiable fills, so the trades he describes narrating are his account of his own reading rather than demonstrated results. He also refers to a short video he posted on X before the open and to guidance he says he gave before the week started (53:36); those claims of advance calls cannot be checked from the recording itself.
Some of his broader assertions are interpretations rather than established facts. He argues that the market is scripted and repeats that buying and selling pressure cannot explain candle behaviour, reasoning that a single contract can print the high or the low of a candle (50:09). He also states that what he teaches is unique to his material. Those are his positions; nothing in the transcript independently verifies them, and the chart detail that supports his annotations is not visible in a transcript.
Numbers need particular care here. The transcript is machine-generated, and his Fibonacci readings are rendered inconsistently — he says there is “no magic” to the fib and that it only marks where the algorithm’s reference points sit (1:04:09), but the specific levels he calls out are not reliably legible in the transcription. The same applies to a candle-low observation near 1:08:55, where he notes a low stopping about one tick above a level but the quoted figures cannot be confirmed. Terminology is also affected: the midpoint he calls “consequent encroachment” is rendered several different ways by the speech recognition, and terms such as “suspension block” and “buy-side imbalance, sell-side inefficiency” should be checked against the audio and chart labels.
Finally, the upload date does not establish the date of the market session discussed. The recording refers to “yesterday’s FOMC,” to a Sunday open and to a review of the week, but the transcript alone does not fix a calendar date for the session being annotated.
An educational way to review the lesson
Independent of the proprietary terminology, the lecture illustrates several general chart-review practices: define reference levels before looking at a lower-timeframe entry, require invalidation or a change in short-term behaviour before acting on a directional thesis, choose an objective and an invalidation point as parts of one plan, and judge a setup by how price travels as well as where it stops.
Near the end, he addresses risk directly. At 1:13:13 he says traders will not be right every time, and ties survival to not over-leveraging, not abandoning the model and using sound money management. That is a general risk statement rather than a performance claim, and it is the part of the closing section most useful to a funded-account trader. Earlier he makes the same point from the opposite direction: at 1:12:36 he argues that candles cannot hurt a trader who has aligned a plan with them, and that the work is learning the model’s language.
A cautious way to use the lesson would be to mark one range, calculate its subdivisions, note the relevant windows, write down what would invalidate the interpretation before the session opens, and keep the losing and no-trade examples alongside the ones that worked. The recording is best treated as a detailed presentation of one speaker’s chart-reading framework: higher-time-frame context supplies the range, octants and quadrants supply the price coordinates, macro windows supply the time coordinates, and candle behaviour at their intersections is used to support or reject the working narrative.
Watch the original ICT lesson
This article draws on an automatic transcript of the audio of ICT Algorithmic Time & Price Grids. That transcript is a source for the speaker’s words only; it is not the video’s own captions, it is not independent proof of the reported trading, and the annotated chart detail remains essential if you follow the lesson on the video itself.
Watch the original lesson on YouTube
This video cannot be played inside another website: when its embedded player was loaded and clicked on 14 September 2026, the player reported “Playback on other websites has been disabled by the video owner” and offered only a “Watch on YouTube” prompt, with no duration and no playback progress. That response is why no player is reserved or left blank here; the recording is available directly on YouTube.
Primary source and further reading
- The original Inner Circle Trader recording: use the timestamp links above to compare each explanation with its source passage.
- TradingView: Pine Script documentation, Time: vendor reference on how charting platforms represent time and exchange hours.
- BestProps: prop firm drawdown rules by calculation method: this site’s documented comparison of drawdown models, relevant to the funded-account risk point above.
- ICT macro times (third-party explainer, unofficial and untested): an independent site’s published macro schedule; it is not ICT’s own material and its windows should not be assumed to match the labels used in this recording.
This is independent educational commentary. It is not official ICT material, a tested trading system, or a claim that the reported results can be reproduced.





