
Key takeaways
ICT’s framework marks highs and lows from roughly the prior three months, then weekly, daily and session levels, to judge whether price moves toward, through or away from them rather than treating them as automatic support, resistance or entries.
Read the full summary
ICT’s framework marks highs and lows from roughly the prior three months, then weekly, daily and session levels, to judge whether price moves toward, through or away from them rather than treating them as automatic support, resistance or entries. Areas above prior highs are called buy-side liquidity and areas below prior lows sell-side liquidity, with movement through multiple highs interpreted as relative strength and through multiple lows as relative weakness. A bullish change in the state of delivery requires price to trade below a prior low, recover above it and then cross a prior high before seeking a long setup and opposing liquidity objective. The bearish sequence requires a move above a prior high, a return below it and a break of a prior low, so a stop run alone is not a signal. After confirmation, ICT looks for an impulse-leg retracement during the London window around 2 to 5 a.m. Eastern Standard Time or the New York window around 7 to 9 a.m., associating the retracement with optimal trade entry or OTE and emphasizing New York for developing traders. He advises against forcing daily trades, chasing late-week setups or demanding perfect forecasts, especially during inside days, outside days and consolidation. A neutral study exercise is to annotate historical levels, sessions, sweeps, opposing-level crosses, consolidations and failed sequences without trading. The article stresses that this is ICT’s interpretation, the chart annotations and GBP example cannot be verified from the transcript, and no profitable mechanism or universal schedule is established.
How we researched this article
BestProps used document-based research from primary firm sources, checked September 25, 2026. The complete source list, scope, limitations, and commercial-state record appear near the end of this article.
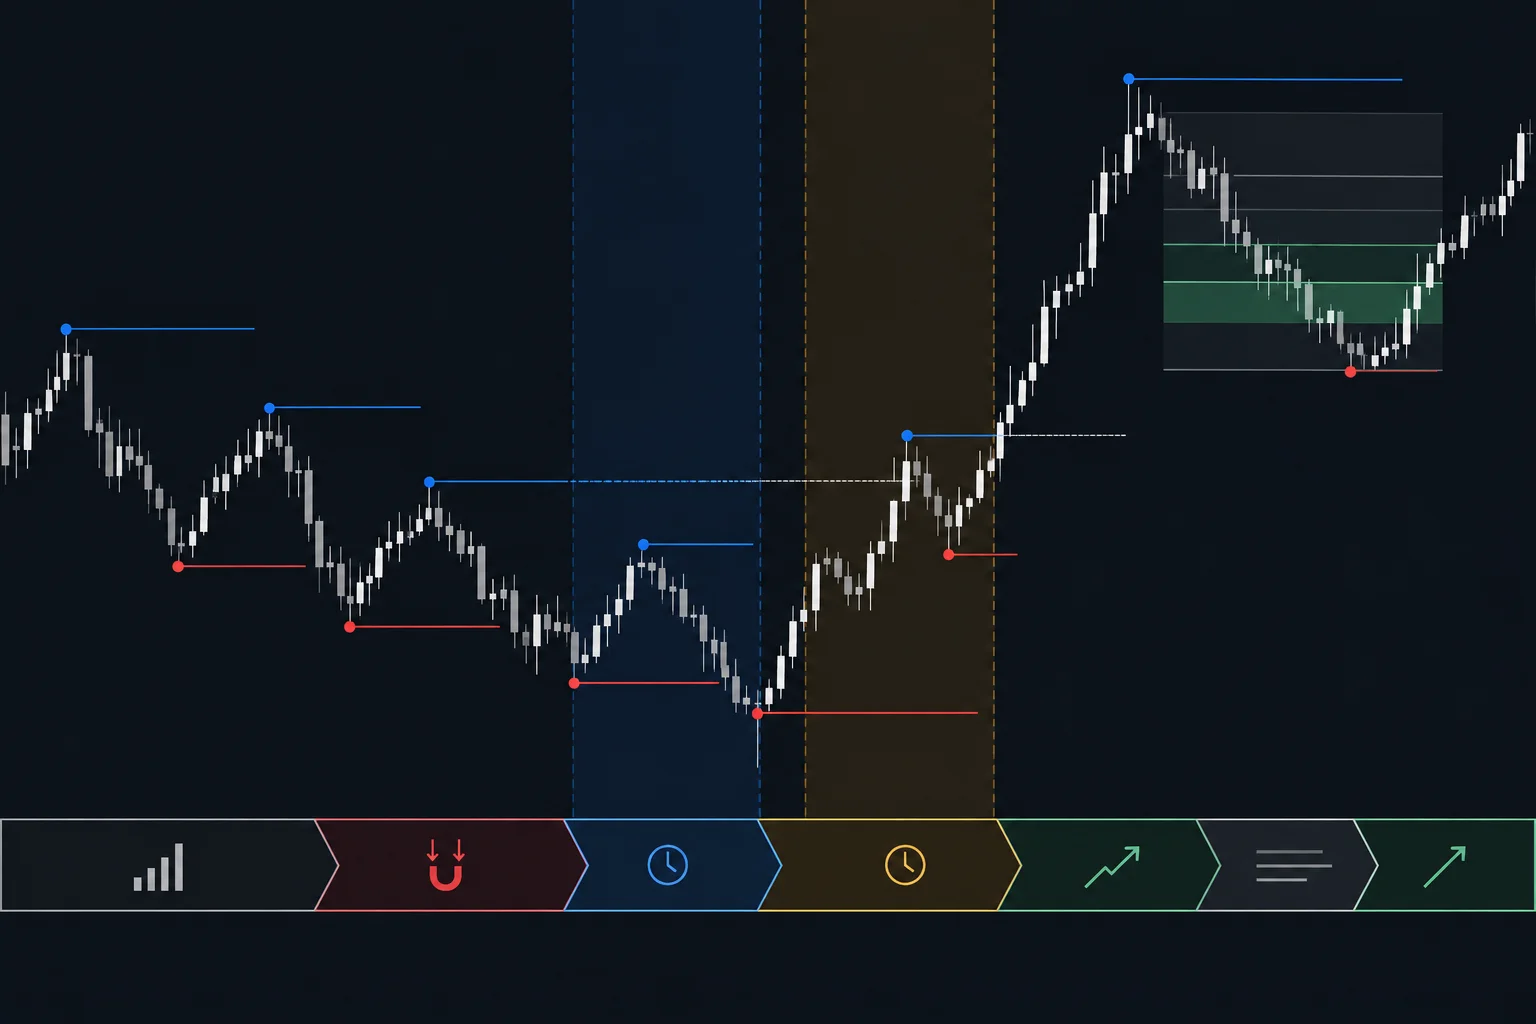
In If I Could Go Back & Tell Myself What I Know Now… Part 2 of 4, ICT frames the lesson as advice he would give himself at age 20. His central message is to stop searching for certainty in conventional indicators and instead study how price behaves around prior monthly, weekly, daily and session highs and lows.
This is ICT’s interpretation of market behavior, not independently established proof that markets operate through the mechanism he describes. The transcript also cannot verify the chart annotations shown in the recording or demonstrate that the proposed framework produces profitable trades.
ICT Framework for Reading Highs and Lows
ICT introduces the practical focus at 5:31: mark monthly, weekly, daily and session highs and lows. Rather than treating each one as a conventional support or resistance level, he asks whether price appears to be moving toward, through or away from it.
- Monthly levels: ICT suggests beginning with the highs and lows of roughly the previous three months and extending them forward for study.
- Weekly levels: These provide intermediate reference points between larger monthly extremes.
- Daily levels: Prior daily highs and lows are used to examine shorter-term direction and possible changes in price behavior.
- Session levels: Intraday highs and lows are considered only after the higher-time-frame context has been assessed.
At 7:07, he recommends marking recent monthly extremes and studying reactions around them. The distinction is important: he does not present the line itself as an automatic entry. In his model, an old high or low is an area around which to observe whether price reaches beyond the level, rejects it or continues through several comparable levels.
Reading Highs and Lows Beyond Support and Resistance
ICT argues that traders often expect old highs and lows to stop price. His alternative view, explained around 11:15, is that price may move slightly above an old high or below an old low because orders may be clustered beyond those reference points. He calls the areas above highs “buy-side liquidity” and those below lows “sell-side liquidity.”
His memorable instruction is to study movement “to and through” a level. In this framework, crossing an old high or low is not automatically a breakout trade or a reason to fade the move. Context comes from what price does next and whether it can cross an opposing reference point.
ICT also interprets movement through multiple highs as evidence of relative strength and movement through multiple lows as evidence of relative weakness. At 13:08, he discusses using different chart colors for highs and lows so that sequences of crossed levels are easier to recognize. This is an organizational aid, not a signal by itself.
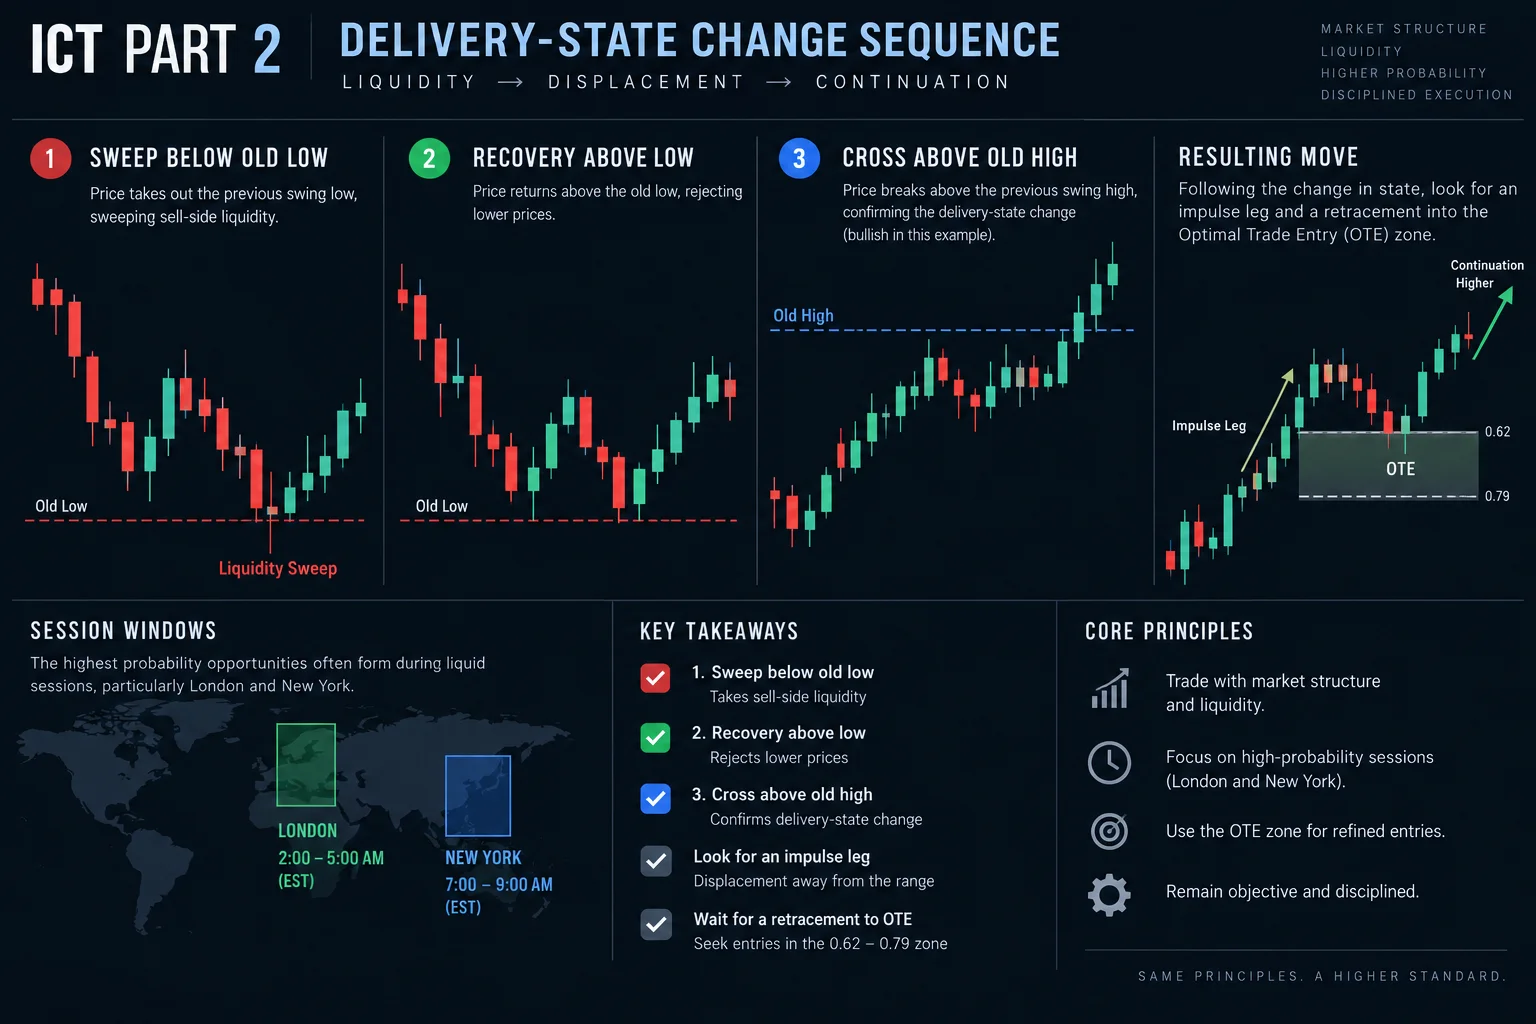
ICT Framework for Changes in Price Delivery
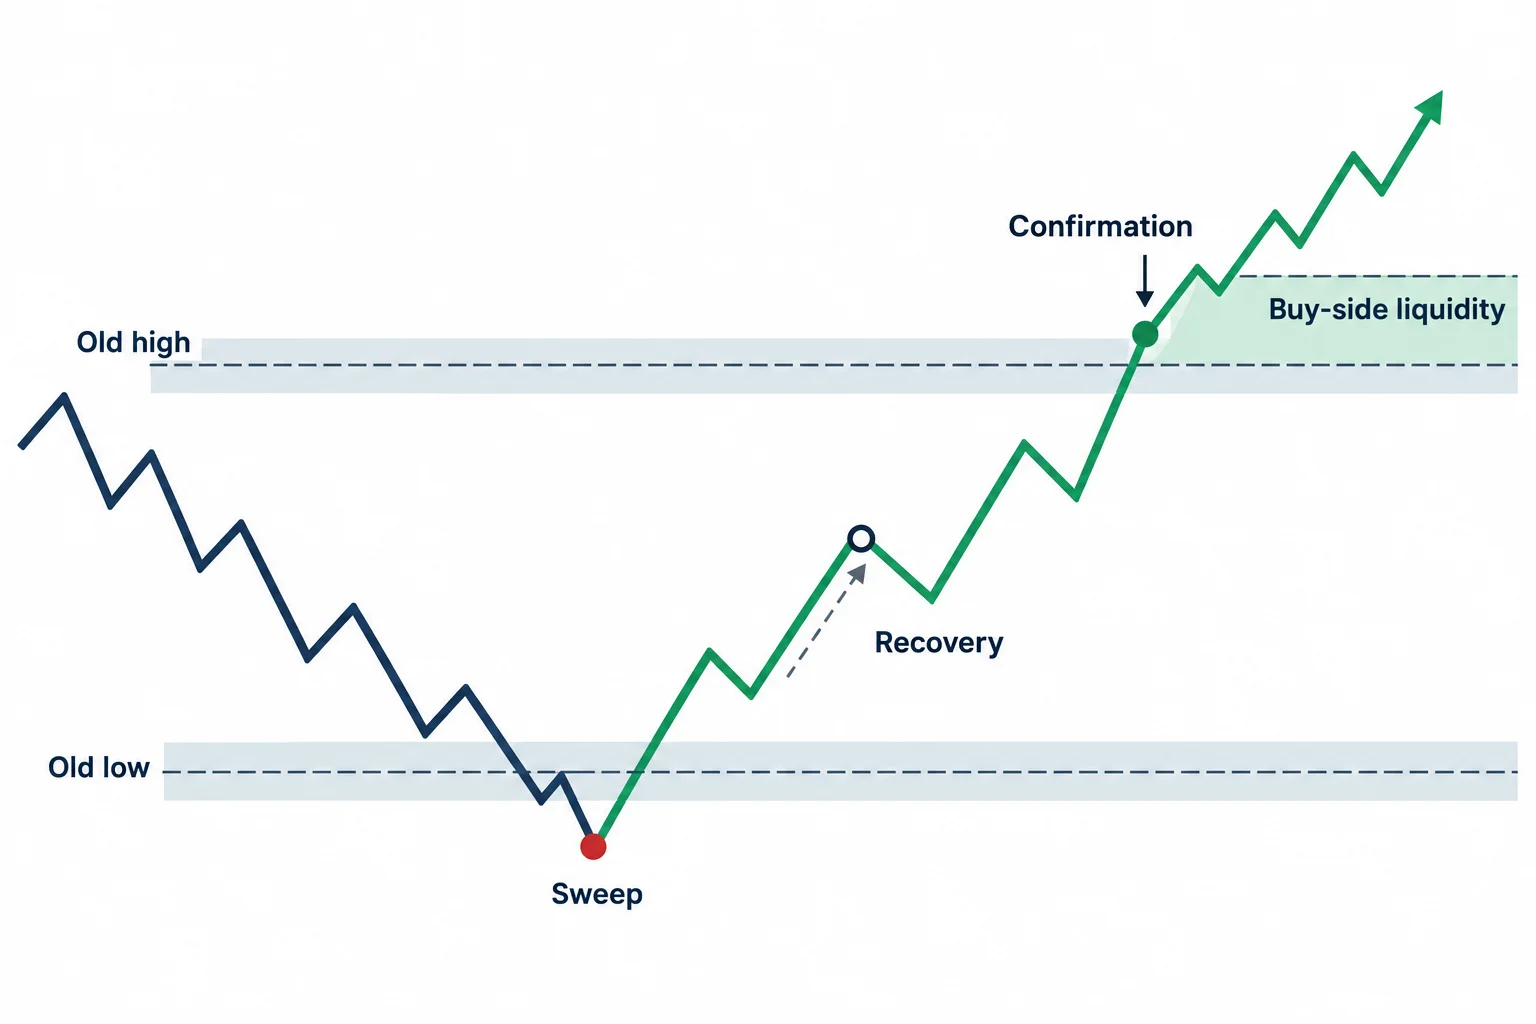
The most specific part of the lesson concerns what ICT calls a change in the market’s “state of delivery.” A sweep below an old low followed by a recovery above that low is not, in his view, enough to justify a long position. He says price must subsequently trade above an old high before he interprets the sequence as a shift toward buy-side liquidity.
He explains that sequence at 21:51:
- Price trades below a prior low.
- It returns above that low.
- It then trades above a prior high.
- Only after that confirmation does ICT begin looking for more specific long setups and an opposing liquidity objective.
The inverse sequence applies to his bearish interpretation: price moves above an old high, returns beneath it and then breaks an old low. At 23:40, ICT emphasizes that a stop run alone is not an entry signal. In his presentation, the opposing high or low must also be crossed.
Reading Highs and Lows by Time of Day
Once that directional sequence is present, ICT narrows the analysis to intraday timing. Beginning at 25:33, he discusses a London window of approximately 2:00–5:00 a.m. Eastern Standard Time and a New York window of approximately 7:00–9:00 a.m. Eastern Standard Time.
In the bullish example described verbally, price first takes a prior low, then crosses an old high. ICT labels the upward movement an impulse leg and anticipates a retracement. He then looks for that retracement during a session window, with particular emphasis on New York for a developing trader. Around 28:48, he associates this retracement concept with his term “optimal trade entry,” or OTE.
The transcript does not provide enough numerical information to reconstruct the illustrated GBP chart, identify exact entries or confirm what happened after the displayed period. The session times should therefore be read as a report of ICT’s stated framework, not as a verified setup or universal trading schedule.
ICT Framework for Process and Restraint
A second theme is behavioral. ICT warns his younger self against trying to trade every day, chasing late-week setups after earlier gains or equating frequent correctness with competence. At 15:05, he notes that daily opportunities may appear, but argues that some days are better left alone. He mentions inside days, outside days and consolidation as examples of conditions that complicate a simplistic expectation of daily expansion.
He also repeatedly rejects perfection. Near 9:59, ICT says that trying to make every forecast unfold perfectly can lead to poor decisions. The educational takeaway is broader than his liquidity terminology: define what must happen before acting, accept that losses remain possible and avoid treating activity as a requirement.
ICT Highs and Lows Study Exercise
A neutral way to examine the lesson is to annotate historical charts without placing trades. Mark recent monthly, weekly and daily highs and lows, then record whether price stopped short, crossed one level, crossed several levels or swept a level before crossing an opposing one. Separate observations by session and include consolidations and failed sequences. This does not validate ICT’s algorithm claims, but it converts the video’s terminology into testable chart observations while reducing hindsight-based selection.
The full primary source is available on YouTube. This summary is educational commentary and not investment advice.
Watch the original ICT lesson on YouTube
The video cannot be played inside another website: when its embedded player was opened and clicked on 21 September 2026, the player itself reported “Playback on other websites has been disabled by the video owner.” and settled on a “Watch on YouTube” prompt, with no duration and no playback progress reported. That message is the reason no embed is reserved here; the recording is available directly on YouTube.
Primary source and further reading
- The original Inner Circle Trader lesson, Part 2: use the timestamp links in this article to compare the explanation with its source.
- YouTube’s embedding documentation: platform guidance relevant to the external watch link above.
- 17 CFR 4.41: disclosures concerning hypothetical performance: a regulatory reference, not a statement that a particular recording or this article meets every legal requirement.
This is independent educational commentary. It is not official ICT material, a tested trading system, or a claim that the reported results can be reproduced.


