
Key takeaways
ICT’s September 2017 USD/CAD commentary presents a liquidity-based scenario using broad US dollar strength, prior highs and lows, and an optimal trade entry, with buy-stop objectives around 1.2400, 1.2420, and 1.2440 and an intermediate objective near 1.2365 followed by the prior high near 1.2407.
Read the full summary
ICT’s September 2017 USD/CAD commentary presents a liquidity-based scenario using broad US dollar strength, prior highs and lows, and an optimal trade entry, with buy-stop objectives around 1.2400, 1.2420, and 1.2440 and an intermediate objective near 1.2365 followed by the prior high near 1.2407. At 41 seconds he says price reached the anticipated upside areas, while from 5 minutes 47 seconds to 7 minutes 4 seconds he explains that he wanted a sweep below a prior low before buying for a reversal toward overhead stops. He explicitly states at 7 minutes 41 seconds that he did not obtain the long position, although he identifies an earlier optimal trade entry short targeting liquidity below swing lows. His process is to use Dollar Index strength as context, map sell-side and buy-side liquidity, require a sweep and reversal before entry, and distinguish directional expectations from executed trades. At 16 minutes 30 seconds he describes planned live commentary as demo-account education rather than a signal service, and near 19 minutes 36 seconds he calls optimal trade entry his principal pattern across time frames and trading styles. The transcript provides no verifiable charts, order records, complete rules, controlled testing, or performance history, so the reported levels, fills, timing, and predictive value require confirmation from the original September 27, 2017 recording.
How we researched this article
BestProps used document-based research from primary firm sources, checked September 25, 2026. The complete source list, scope, limitations, and commercial-state record appear near the end of this article.
In the September 2017 video UsdCad Commentary, ICT reviews a USD/CAD move through the lens of liquidity, relative US dollar strength and what he calls an optimal trade entry. His central teaching point is not simply that price reached an anticipated area. He tries to explain how traders could organize a market narrative before and around the move.
This is a transcript-grounded summary of ICT’s interpretation, not independent proof that the concepts predict markets. The available source contains automatically generated timestamps and no verifiable chart images, order records or later performance data.
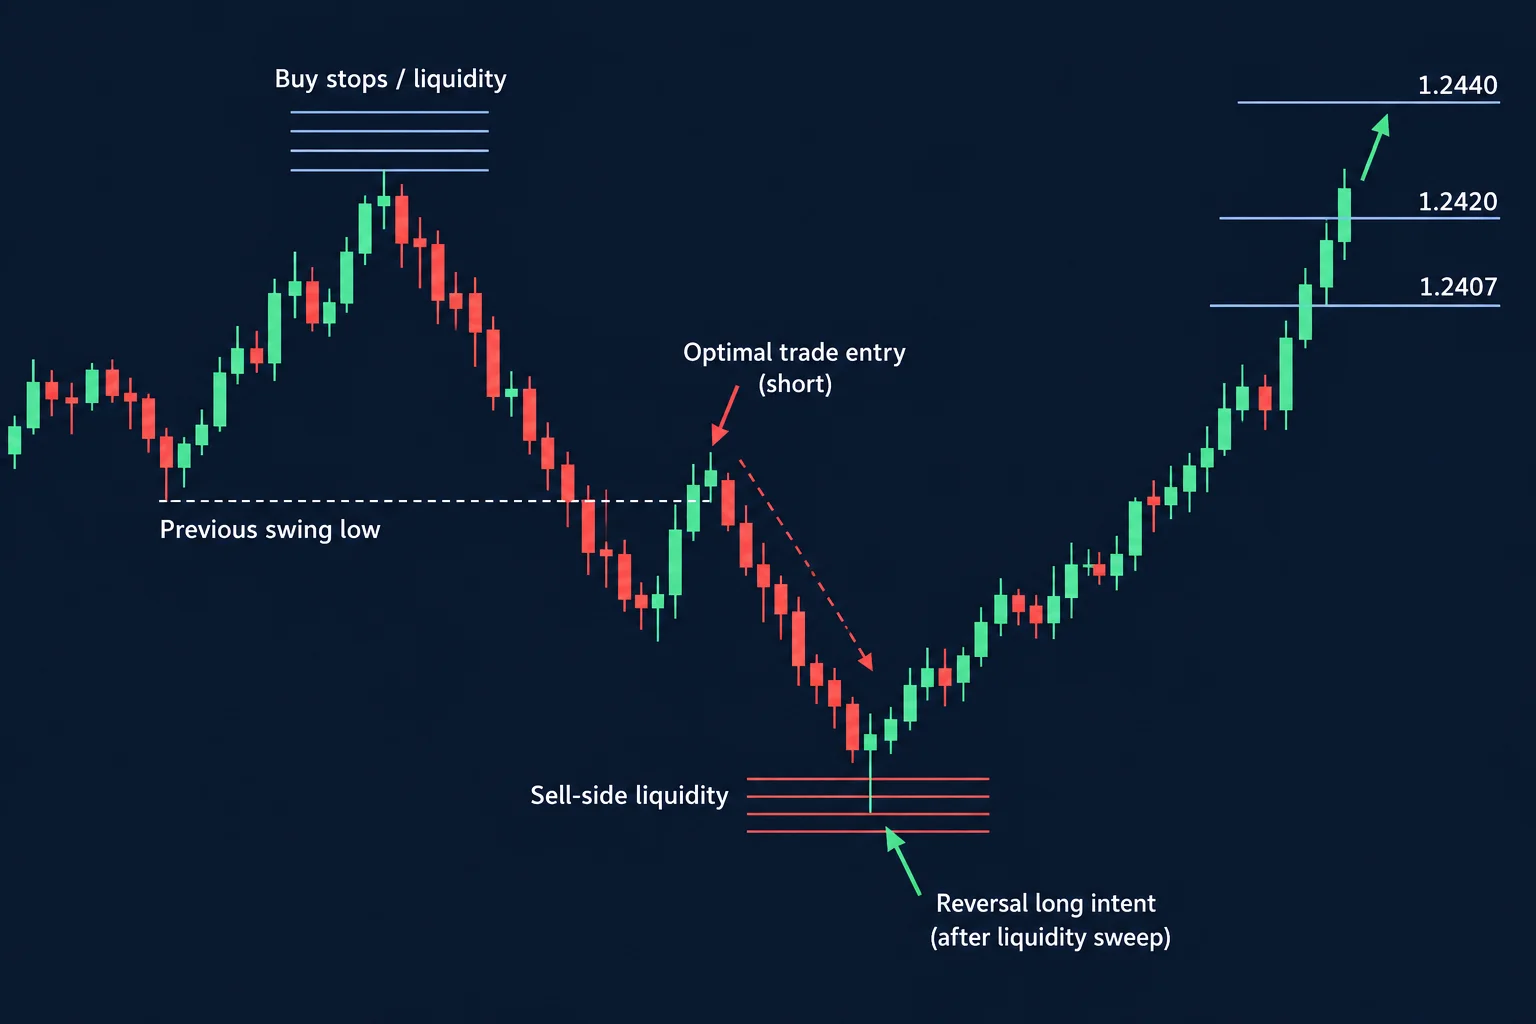
ICT USDCAD Trade Objectives
At 0:41, ICT says he had expected a run on buy stops around the 1.24 large figure, followed by objectives near 1.2420 and 1.2440. He then describes price as reaching those targets during the recording. These levels are reported from his narration; the transcript alone cannot confirm the displayed quote, the timing of any earlier social-media post or an executed trade.
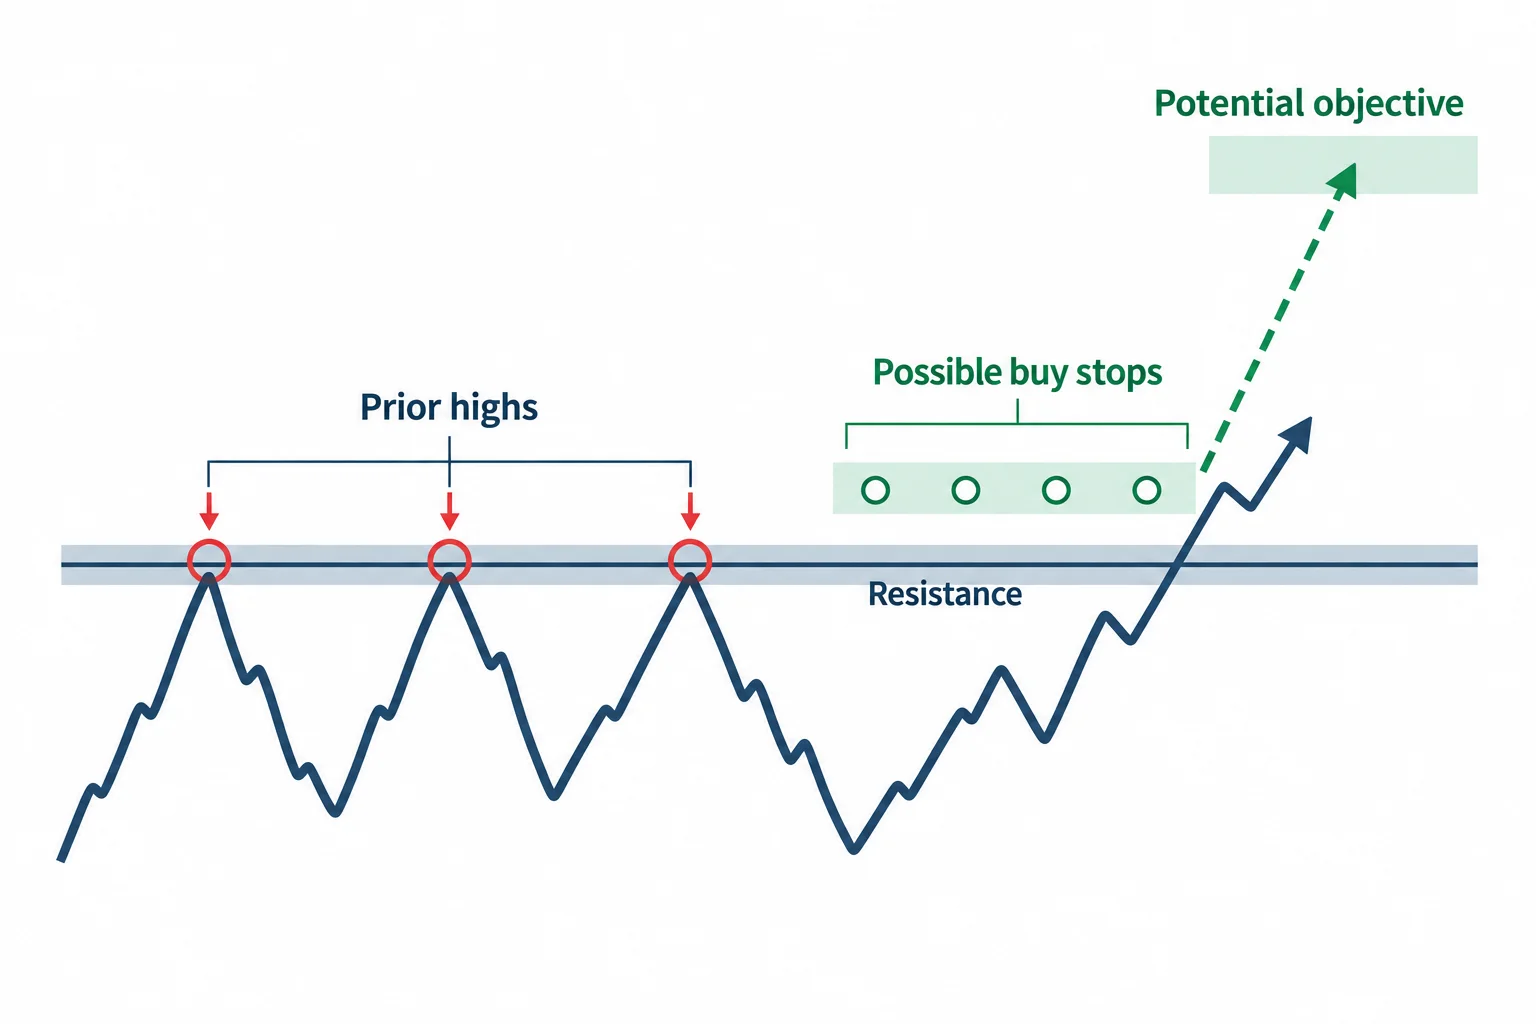
ICT frames the move as a liquidity event. In his terminology, buy stops resting above prior highs may become objectives because those orders provide liquidity. He argues that a level widely interpreted as resistance can also attract orders above it, creating a destination for an upward move rather than guaranteeing a reversal.
ICT USDCAD Dollar Strength Context
The discussion shifts to the Dollar Index at 2:20. ICT characterizes the dollar’s session as consistently strong from around midnight onward. In his account, attempting repeated countertrend reversals against that strength exposed traders to choppy or adverse price action.
He then compares that broad dollar behavior with an earlier decline in USD/CAD. At 5:05, he asks why USD/CAD was being pushed lower while the dollar itself appeared strong. His answer is that the decline preserved the buy-side objectives above while allowing price to reach liquidity beneath nearby lows first.
This is an example of intermarket context rather than a mechanical rule. A stronger Dollar Index does not require every US dollar pair to move in the same direction at every moment; the other currency and pair-specific flows also matter. The educational takeaway is narrower: ICT wanted viewers to notice an apparent divergence and ask whether the USD/CAD decline fit the broader session narrative.
ICT USDCAD Liquidity Setup and Missed Trade
A useful detail appears between 5:47 and 7:04. ICT identifies lows he had been watching as downside targets. He says he wanted price to trade below one particular low before buying, anticipating a reversal toward the buy stops overhead.
The automated transcript renders the intended reversal pattern as “turtle suit” at 7:09. This is likely an imperfect recognition of a specialized term, so the exact label should be checked against the audio and chart rather than assumed. The underlying explanation is clearer than the label: ICT wanted a sweep below a prior low followed by an upward move.
He outlines a hypothetical management sequence involving an initial objective around 1.2365, the prior high near 1.2407, then 1.2420 and finally 1.2440. Importantly, he explicitly says at 7:41 that he did not obtain a long position. The discussion therefore should not be read as evidence of a filled long trade or realized profit.
ICT USDCAD Optimal Trade Entry
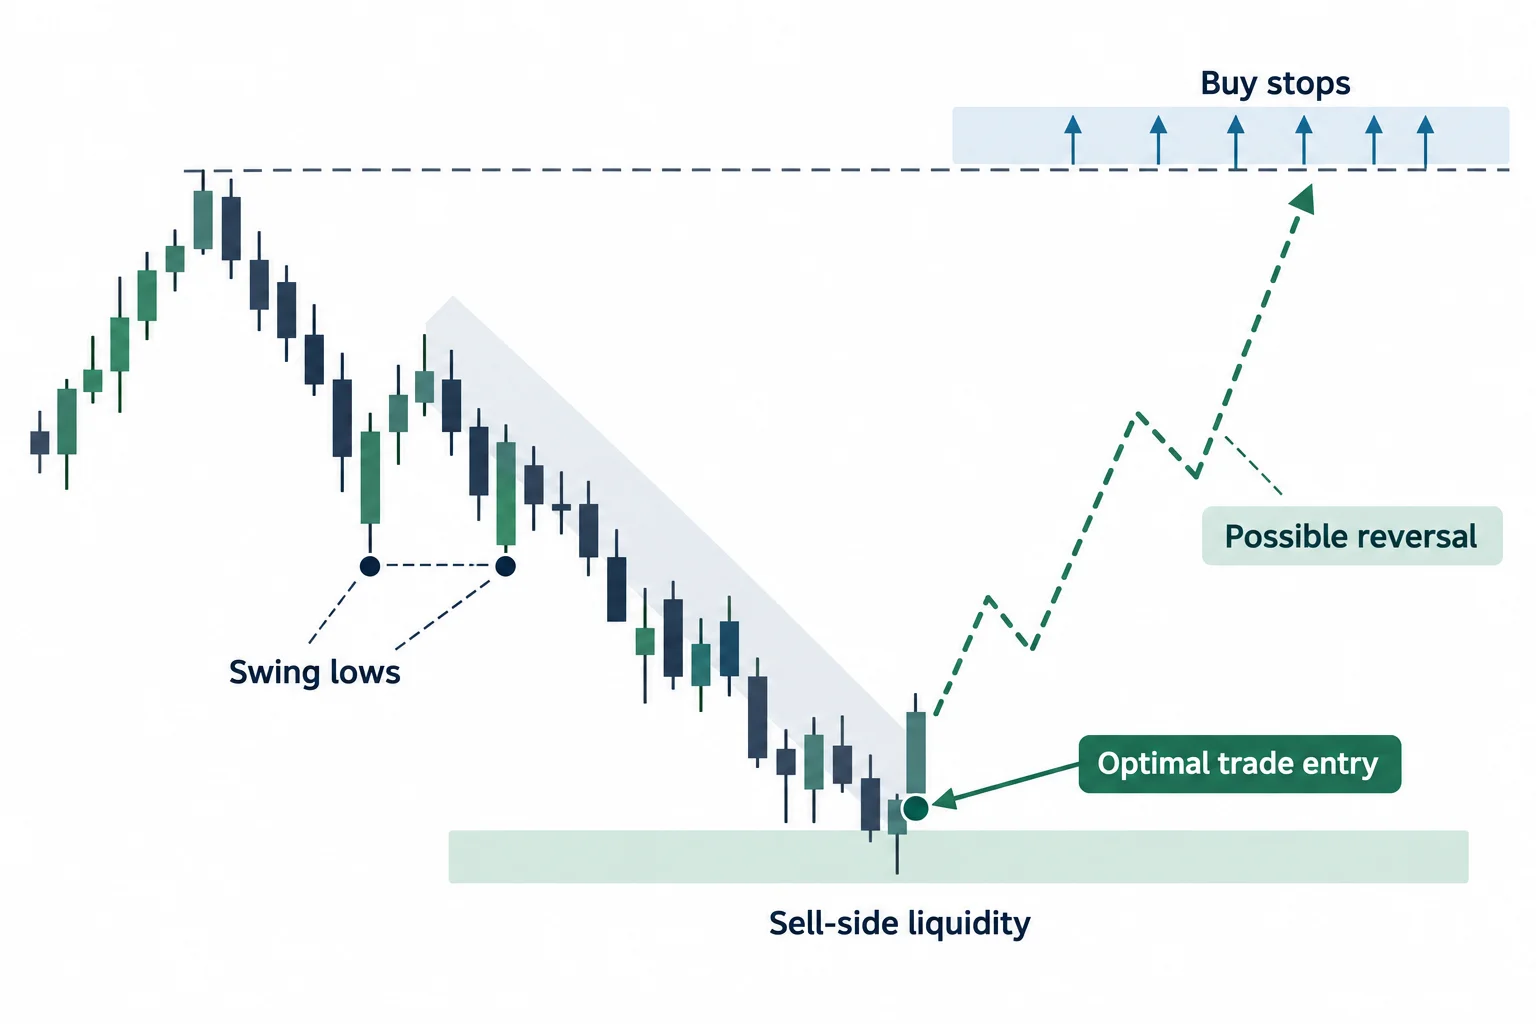
Although the desired long entry did not occur, ICT says an “optimal trade entry” short was present earlier in the decline. In his explanation, that short move targeted liquidity beneath swing lows. Once price approached or removed that sell-side liquidity, he was interested in the possibility of a reversal toward the buy stops above.
The sequence can be summarized as follows:
- Use broad dollar strength as directional context.
- Identify prior USD/CAD lows as possible downside liquidity objectives.
- Recognize that buy stops remained above prior highs.
- Consider a short setup into the lower objectives.
- Look for a sweep and reversal before considering the long scenario.
- Do not treat an anticipated scenario as an executed trade when its entry condition is not met.
This last distinction is one of the more practical lessons in the recording. ICT separates his directional expectation from actual participation: he believed the pair could eventually move higher but says he missed the long because price did not provide the specific entry he wanted.
ICT USDCAD Commentary Session Lessons
Later portions of the video move away from USD/CAD and discuss ICT’s tutorials and planned live commentary. He repeatedly describes that commentary as educational rather than a signal service. At 16:42, he says he would discuss anticipated direction and risk definition using a demo account, not provide exact instructions to buy, place a stop or execute a trade.
Near 19:36, ICT returns to optimal trade entry as the principal pattern he intended to emphasize. He claims it can be examined across different time frames and trading styles. The video does not, however, provide a controlled test, complete rule set or performance history with which to evaluate that claim.
ICT USDCAD Commentary Educational Takeaways
Viewed conservatively, the USD/CAD commentary demonstrates a scenario-building process: establish contextual direction, map liquidity on both sides of price, specify the condition required for entry and acknowledge when that condition fails to appear. Those habits can help distinguish analysis from impulsive execution, but they do not establish that any particular liquidity model or entry pattern is profitable.
The primary source is ICT’s UsdCad Commentary, uploaded September 27, 2017. Readers should consult the original recording alongside the chart because the transcript cannot independently verify visual levels, fills or subsequent outcomes.
Watch the original ICT commentary on YouTube
The video cannot be played inside another website: when its embedded player was opened on 22 September 2026, the player itself reported “Playback on other websites has been disabled by the video owner” and settled on a “Watch on YouTube” prompt, with no duration and no playback progress reported. That message is the reason no embed is reserved or left blank here; the recording itself is available directly on YouTube.
Primary source and further reading
- The original Inner Circle Trader commentary, “UsdCad Commentary”: use the timestamp links in this article to compare the explanation with its source.
- YouTube’s embedding documentation: platform guidance relevant to the external watch link above.
- 17 CFR 4.41: disclosures concerning hypothetical performance: a regulatory reference, not a statement that a particular recording or this article meets every legal requirement.
This is independent educational commentary. It is not official ICT material, a tested trading system, or a claim that the reported results can be reproduced.


