
Key takeaways
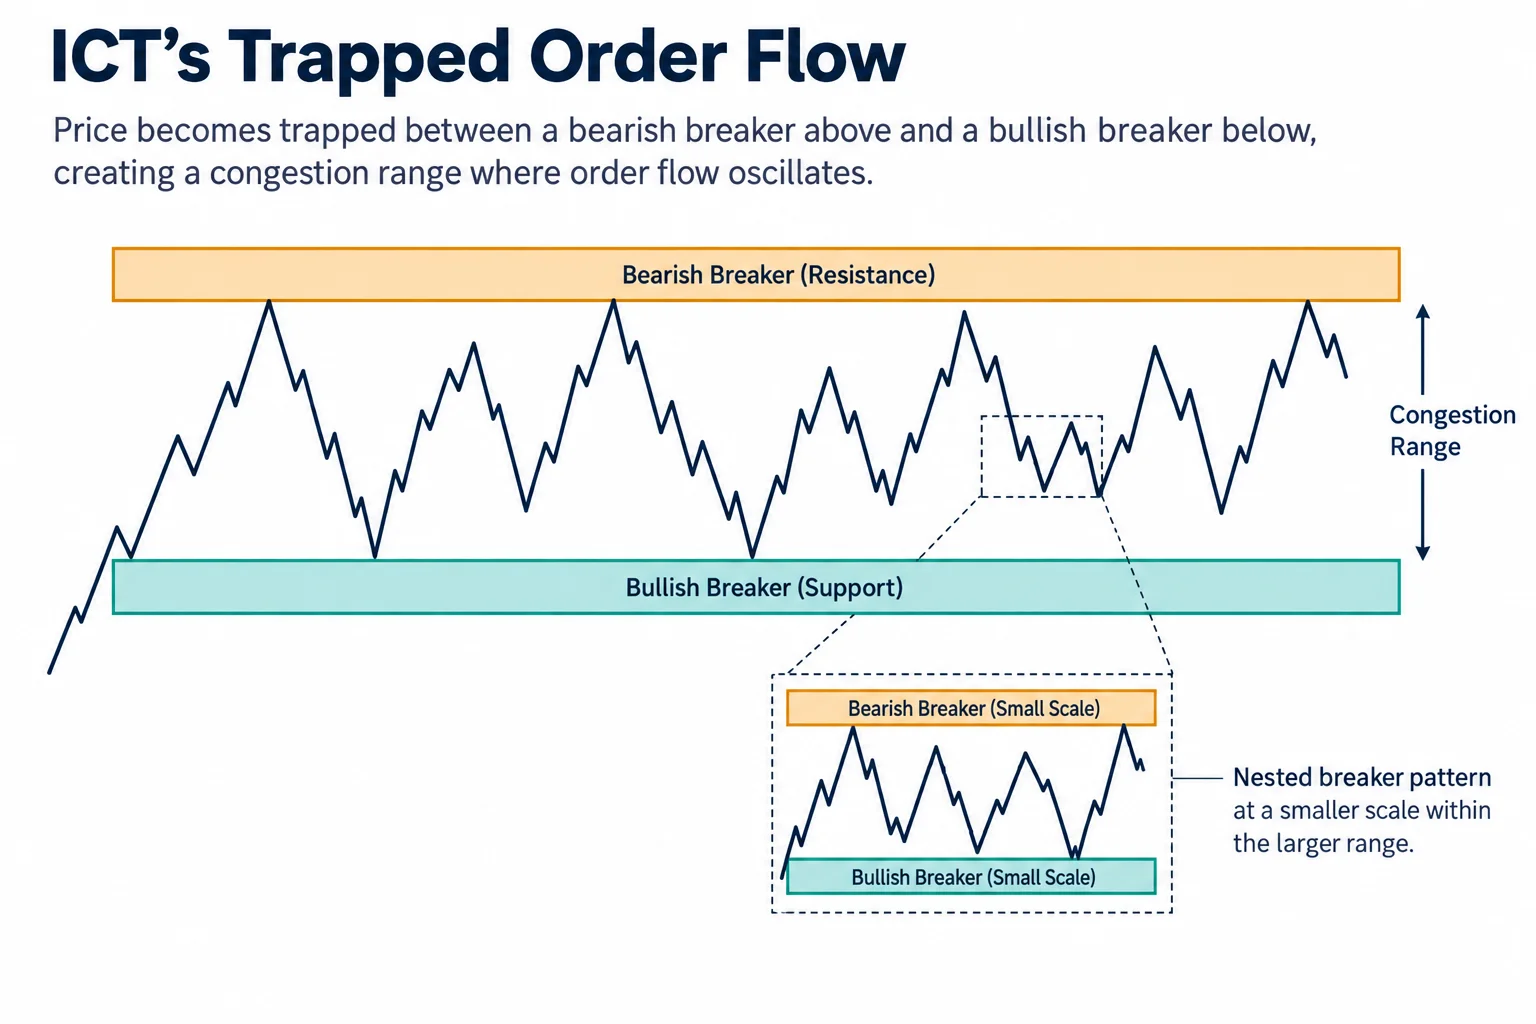
ICT explains that EUR/USD setups around the February 1, 2019 non-farm payroll release were low odds because opposing bullish and bearish breaker structures trapped price in a congestion range, creating a high-resistance liquidity run with repeated reversals rather than sustained direction.
Read the full summary
ICT explains that EUR/USD setups around the February 1, 2019 non-farm payroll release were low odds because opposing bullish and bearish breaker structures trapped price in a congestion range, creating a high-resistance liquidity run with repeated reversals rather than sustained direction. He labels this seek-and-destroy behavior because price clears short-term highs and lows, whipsawing breakout traders, and recommends recognizing it early, staying sidelined or favoring the range edges over its center. In a small demo short, ICT used the midpoint of an up-close candle, called the mean threshold, as a possible entry after price swept a prior high and fell below that midpoint, with plans for partial profits and risk adjustment if nearby lows broke. He repeatedly stressed that the position remained open, the outcome was unknown, and his directional expectation could be wrong. The broader filter is to distinguish trending price from range rotation, identify structures supporting opposite directions, separate temporary event volatility from sustained displacement, and treat every thesis as conditional, especially around non-farm payroll, FOMC events, and high-impact speakers.
How we researched this article
BestProps used document-based research from primary firm sources, checked September 25, 2026. The complete source list, scope, limitations, and commercial-state record appear near the end of this article.
In “What Makes Trade Setups Low Odds? Trapped Order Flow”, uploaded February 3, 2019, ICT examines a euro-dollar consolidation surrounding the February 1 non-farm payroll release. His central lesson is not a promise that a particular setup will work. It is that traders should recognize environments in which opposing price structures make sustained movement less likely and repeated reversals more likely.
The recording uses a chart that is not available in the transcript, so the exact levels and candles cannot be reconstructed here. What the captions do support is a detailed explanation of how ICT interpreted the range, why he considered it difficult to trade, and how he approached a small demo position while openly acknowledging uncertainty.
How ICT Defines Trapped Order Flow
ICT introduces “trapped order flow” as price action that has difficulty escaping a defined range. At 1:31, he asks viewers to study an intraday segment in which price struggled to move decisively higher or lower.
He contrasts two types of conditions:
- Low-resistance liquidity run: In ICT’s terminology, price moves relatively smoothly toward or through an earlier high or low.
- High-resistance liquidity run: Price encounters substantial opposing structure, producing hesitation, reversals, or limited follow-through.
This is ICT’s framework for interpreting price, not an independently established law of market behavior. In the example, he identifies opposing bullish and bearish structures (called “breakers” in his terminology) on either side of the range. He argues that these competing reference points created a back-and-forth “tug-of-war” (5:53).
Why ICT Trade Setups Need Economic Calendar Context
ICT combines the chart context with the scheduled non-farm payroll announcement. Beginning around 6:06, he describes price dropping sharply after the release, rallying back, returning to the original consolidation, and then selling off again into a bullish reference area.
Despite the initial volatility, his interpretation was that the market still could not establish a durable direction. He says similar behavior may appear around major scheduled events such as non-farm payroll, FOMC-related events, or high-impact speakers. The broader point is that volatility by itself does not guarantee directional follow-through.
How Trapped Order Flow Creates Seek and Destroy Trades
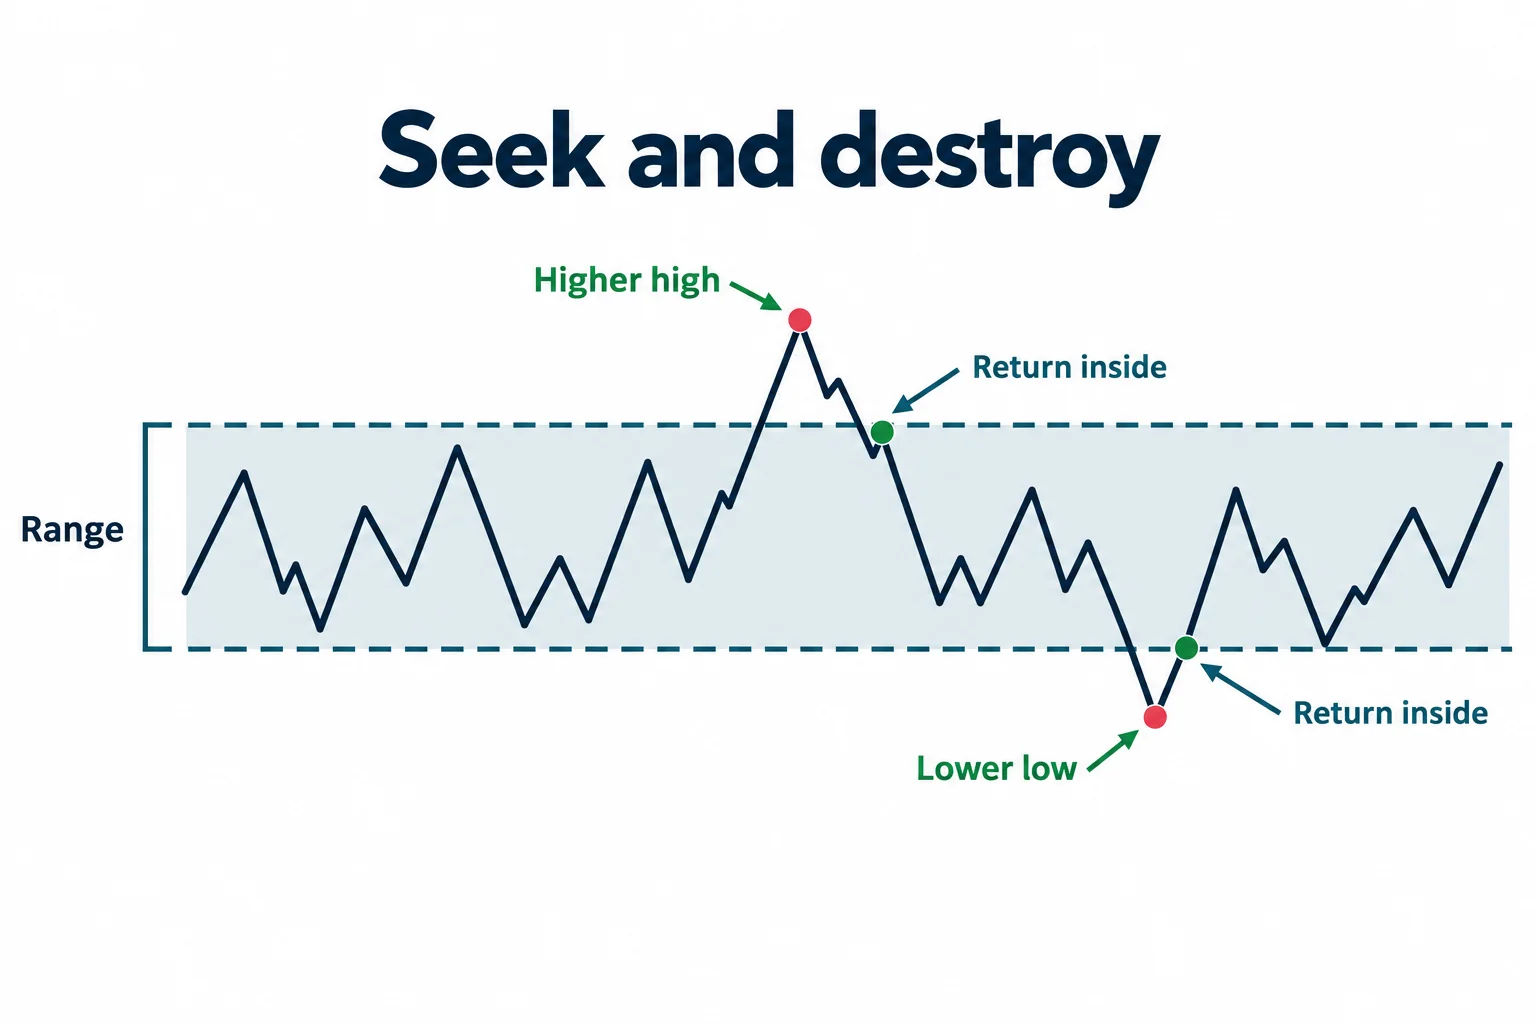
At 7:15, ICT explains why apparently reasonable long and short entries can both become frustrating inside such a range. A long may briefly make a higher high before returning to its entry area. A short may initially make a lower low and then reverse upward.
He calls this a “seek and destroy” market condition because successive short-term highs and lows are taken out. In practical terms, a trader who reacts to each small breakout can be whipsawed: buying after an upward move, being stopped on the reversal, then selling only to be stopped when price turns upward again.
ICT’s stated response is to recognize the condition early and consider moving to the sidelines. If participating at all, he prefers locations near the outer edges of the range rather than entries near its middle. That is a description of his approach in the video, not personalized trading advice.
How ICT Framed the Low Odds Trade Setup
The video also discusses an open demo short. Around 8:38, ICT focuses on the midpoint of an up-close candle, which he calls its “mean threshold.” After price moved above a prior high and then fell below that midpoint, he treated a return toward it as a possible short-entry area.
His reasoning was conditional. He believed stops above a previous high may have been cleared, and he wanted to see price move below nearby lows. He discussed taking partial profits and adjusting risk if that occurred. Crucially, he repeatedly said that his expectation could be wrong and that “should” was not a definitive forecast (11:59).
The position was still open while he was speaking. He had not established the eventual outcome, and the transcript provides no evidence of what happened afterward. He also identifies the example as a small demo trade rather than a live-money transaction.
How Opposing Order Flow Makes Trade Setups Low Odds
ICT summarizes the purpose of the presentation at 16:46. When bullish and bearish structures oppose one another inside a defined range, otherwise familiar entry patterns may have poor follow-through. The more obstacles standing between an entry and its intended destination, the less surprising it should be if price stalls, reverses, or remains confined.
Later, ICT emphasizes that his teaching does not provide a perfect strike rate and that he sometimes reads the market incorrectly (19:11). He presents the concept as a way to identify periods when price may be less likely to move favorably, not as a guarantee of profit.
How to Interpret ICT Trapped Order Flow
Outside ICT’s specialized terminology, the lesson can be understood as a market-context filter:
- Mark whether price is trending or rotating within a range.
- Look for technical reference points supporting opposite directions.
- Distinguish temporary volatility from sustained displacement.
- Be cautious about signals appearing near the center of congestion.
- Treat every directional thesis as conditional and define what would invalidate it.
ICT suggests that a larger directional move may become easier after price finally leaves a mature range. However, the transcript does not establish when a breakout will happen, which direction it will take, or how far it will travel. The most defensible takeaway is therefore diagnostic: when price repeatedly clears nearby highs and lows without sustaining direction, the market state itself may be the main reason an otherwise familiar setup has low odds.
Watch the ICT Trapped Order Flow Lesson
Explore Related ICT Trade Setup Resources
- 2022 ICT Mentorship Episode 5 – covers breaker block formation and opposing structure concepts.
- ICT Forex Price Action Lesson – IPDA Vs. Wyckoff Theory – discusses range dynamics and institutional order flow interpretation.
- ICT Breaker Block Trading, Failed Order Block Strategy (Free PDF) – Inner Circle Traders’ reference on breaker blocks, liquidity sweeps, and market structure shifts.
- ICT HRLR & LRLR, Low & High Resistance Liquidity Runs – explains the liquidity-run classifications ICT references in this lesson.



