
Key takeaways
ICT uses TradingView paper trading to explain a hypothetical, unverified EUR/USD setup built around session context, optimal trade entry retracements, order blocks, liquidity targets, partial profits and tighter stops.
Read the full summary
ICT uses TradingView paper trading to explain a hypothetical, unverified EUR/USD setup built around session context, optimal trade entry retracements, order blocks, liquidity targets, partial profits and tighter stops. The bearish example follows repeated moves above the 1.18 big figure, a break below a short-term low and a retracement into an optimal-entry area and bearish order block during the London-close window from approximately 10 a.m. to noon New York time. ICT takes a first partial at the initial draw on liquidity, another near a lower order block ahead of a prior low, then tightens the remaining stop after price trades below that low. A second example uses a 15-minute level transcribed as 1.1807, two five-minute optimal trade entries aligned with bullish order blocks during the 8.30 a.m. to 11 a.m. New York window, and relative equal highs plus 1.18 as upside liquidity objectives. The core lesson is to predefine nearby objectives, scale out to reduce uncertainty and psychological pressure, and adjust risk after liquidity is taken rather than trying to hold the full position to one perfect exit. The transcript and unseen chart do not independently verify the annotations, executions, results, profitability or ICT's claim near nine minutes 48 seconds that the pattern delivers every day.
How we researched this article
BestProps used document-based research from primary firm sources, checked September 25, 2026. The complete source list, scope, limitations, and commercial-state record appear near the end of this article.
In ICT Forex Price Action Lesson: EurUsd MRP, uploaded on August 12, 2020, ICT reviews a hypothetical EUR/USD paper-trading example and explains the price-action concepts he says informed its management. The lesson focuses less on finding a single perfect exit and more on identifying potential liquidity objectives, operating within defined session windows and reducing exposure through partial profits.
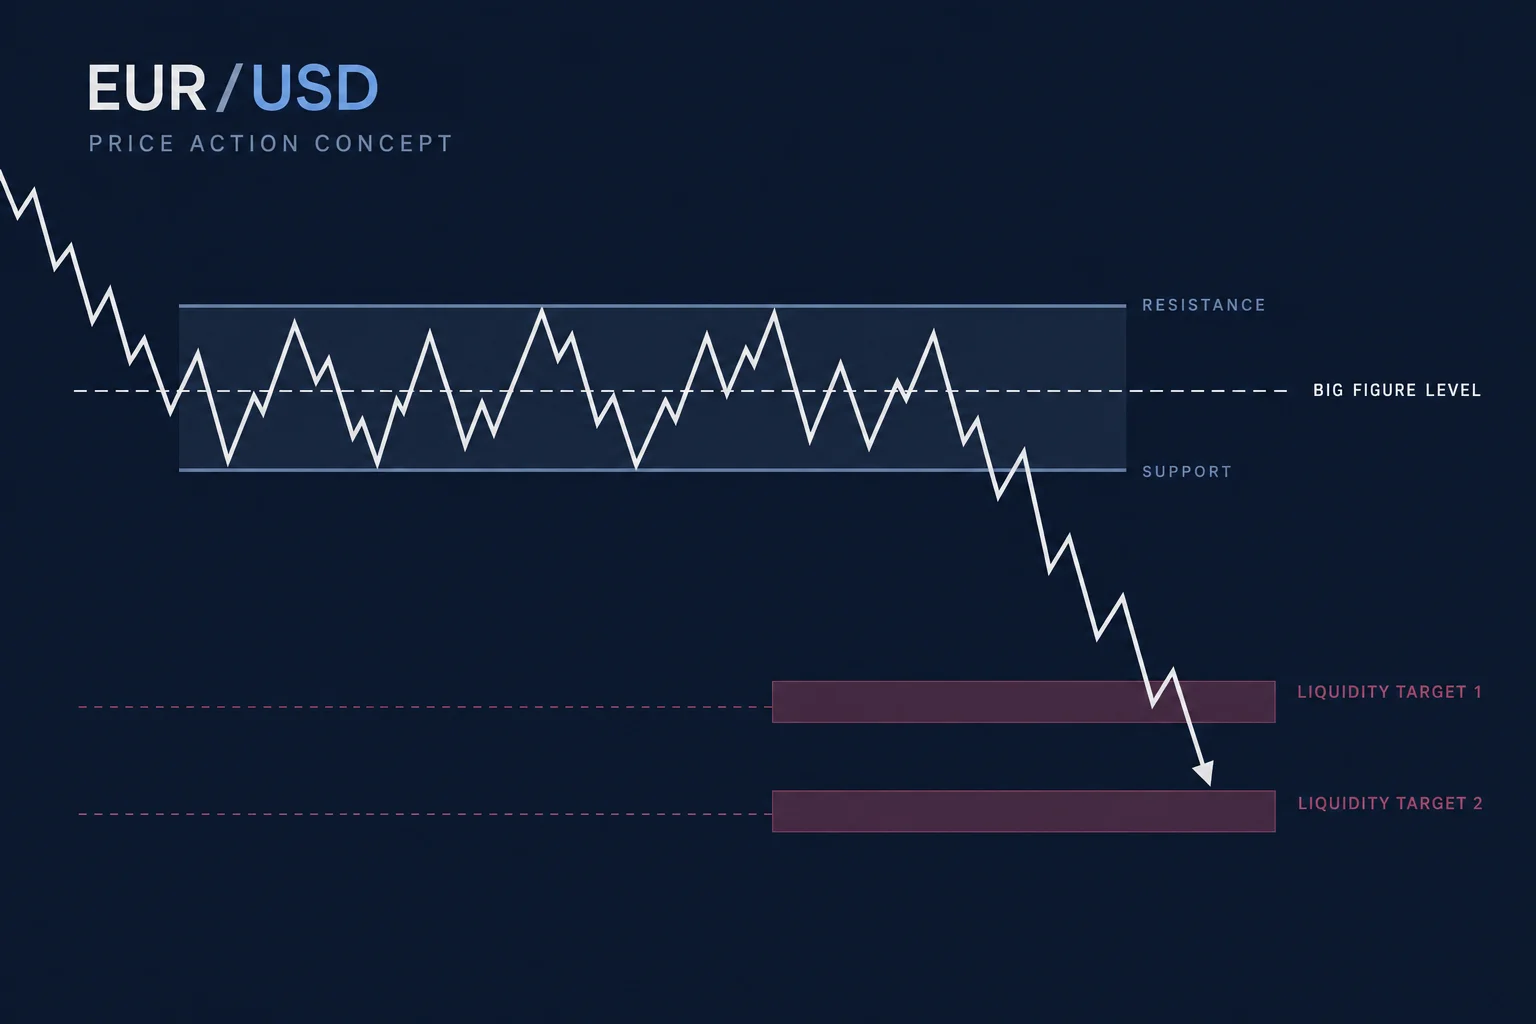
The source is an automatically transcribed video of the original audio; the chart itself was not available for independent inspection here. Consequently, this summary explains ICT’s stated reasoning without treating the unseen annotations, executions or results as independently verified.
ICT Forex Lesson Using Paper Trading
At 0:30, ICT addresses why he demonstrates the idea through TradingView’s paper-trading feature. He characterizes the position as a hypothetical teaching example rather than individualized trade advice. He also contrasts live-forward demonstrations with retrospective chart explanations, arguing that students should pay attention to how an idea is managed as uncertainty develops.
That distinction matters educationally: a completed chart makes every turning point look obvious, whereas a developing setup can retrace, fail to reach its objective or invalidate the original premise. A transcript alone, however, cannot confirm what appeared in the account history or whether every chart annotation was present in real time.
ICT Forex Risk and Partial Profit Lesson
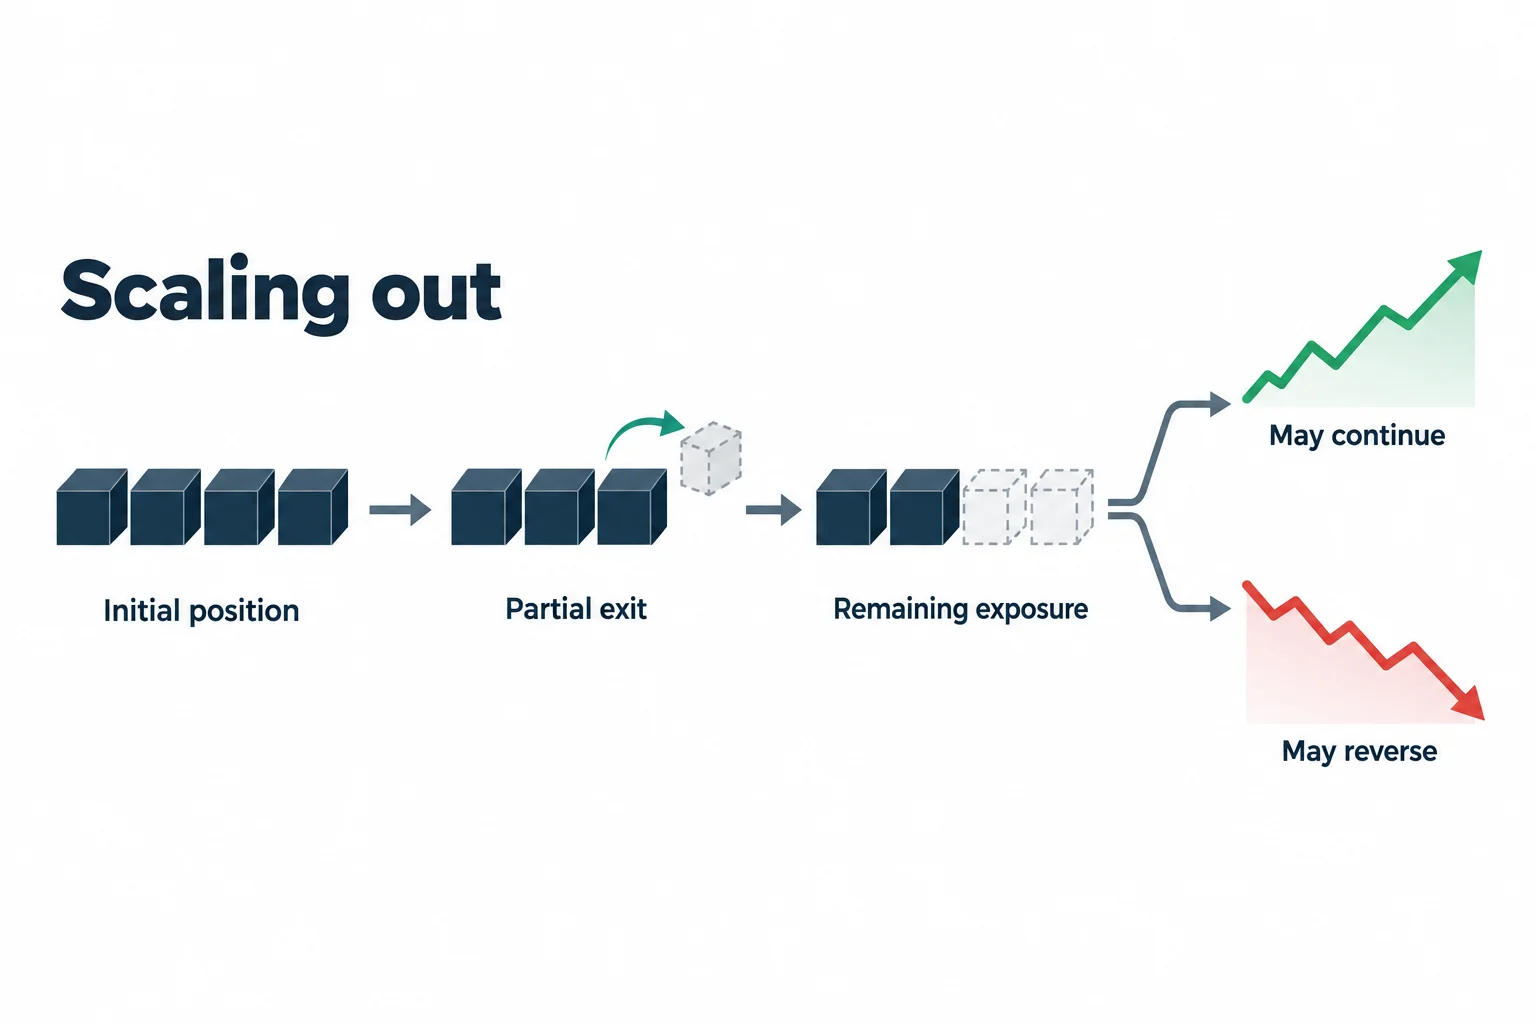
The clearest practical theme begins around 3:47. ICT says developing traders should learn to take profits along the way rather than assuming they will consistently hold an entire move from entry to its final low or high.
His stated rationale is that scaling out can address three pressures:
- Market uncertainty: price can reverse before reaching the furthest projected objective.
- Risk exposure: realizing part of a hypothetical gain reduces how much remains dependent on the next move.
- Psychological pressure: banking partial profits may make the remaining position easier to manage without reacting impulsively.
At 4:37, he explicitly recommends partial profit-taking while a student is still building experience. This is ICT’s instructional view, not evidence that one exit method is universally superior. Scaling out can also reduce the benefit of a move that continues directly to a distant target, so the method still requires predefined risk and exit rules.
ICT EURUSD Bearish Price Action Setup
Beginning at 4:59, ICT reconstructs what he says he observed during the prior session. In his description, EUR/USD moved above the 1.18 “big figure” several times and then broke below a short-term low before consolidating.
He links the subsequent short idea to the London close and to what he calls an optimal trade entry. He defines the London-close window in this discussion as approximately 10:00 a.m. to noon New York time. Around 5:41, he says a retracement entered an optimal-entry area and a bearish order block during that window.
These labels belong to ICT’s own framework. In this lesson, an optimal trade entry is presented as a retracement area within a larger directional move, while a bearish order block is treated as an area from which selling may resume. The transcript does not provide enough visual information to reconstruct the precise boundaries or independently assess those classifications.
Liquidity Targets and Partial Exits
At 6:34, ICT identifies what he calls the first “draw on liquidity” and says a first partial profit was taken there. He describes another partial exit near a lower order block and ahead of a prior low. His reason was not certainty that price would reverse, but recognition that it could retrace toward equal highs instead of continuing downward.
He then says the market traded beneath the referenced low and that he tightened the stop on the remainder to avoid surrendering more of the hypothetical open profit after that liquidity objective had been reached. This sequence illustrates his broader process:
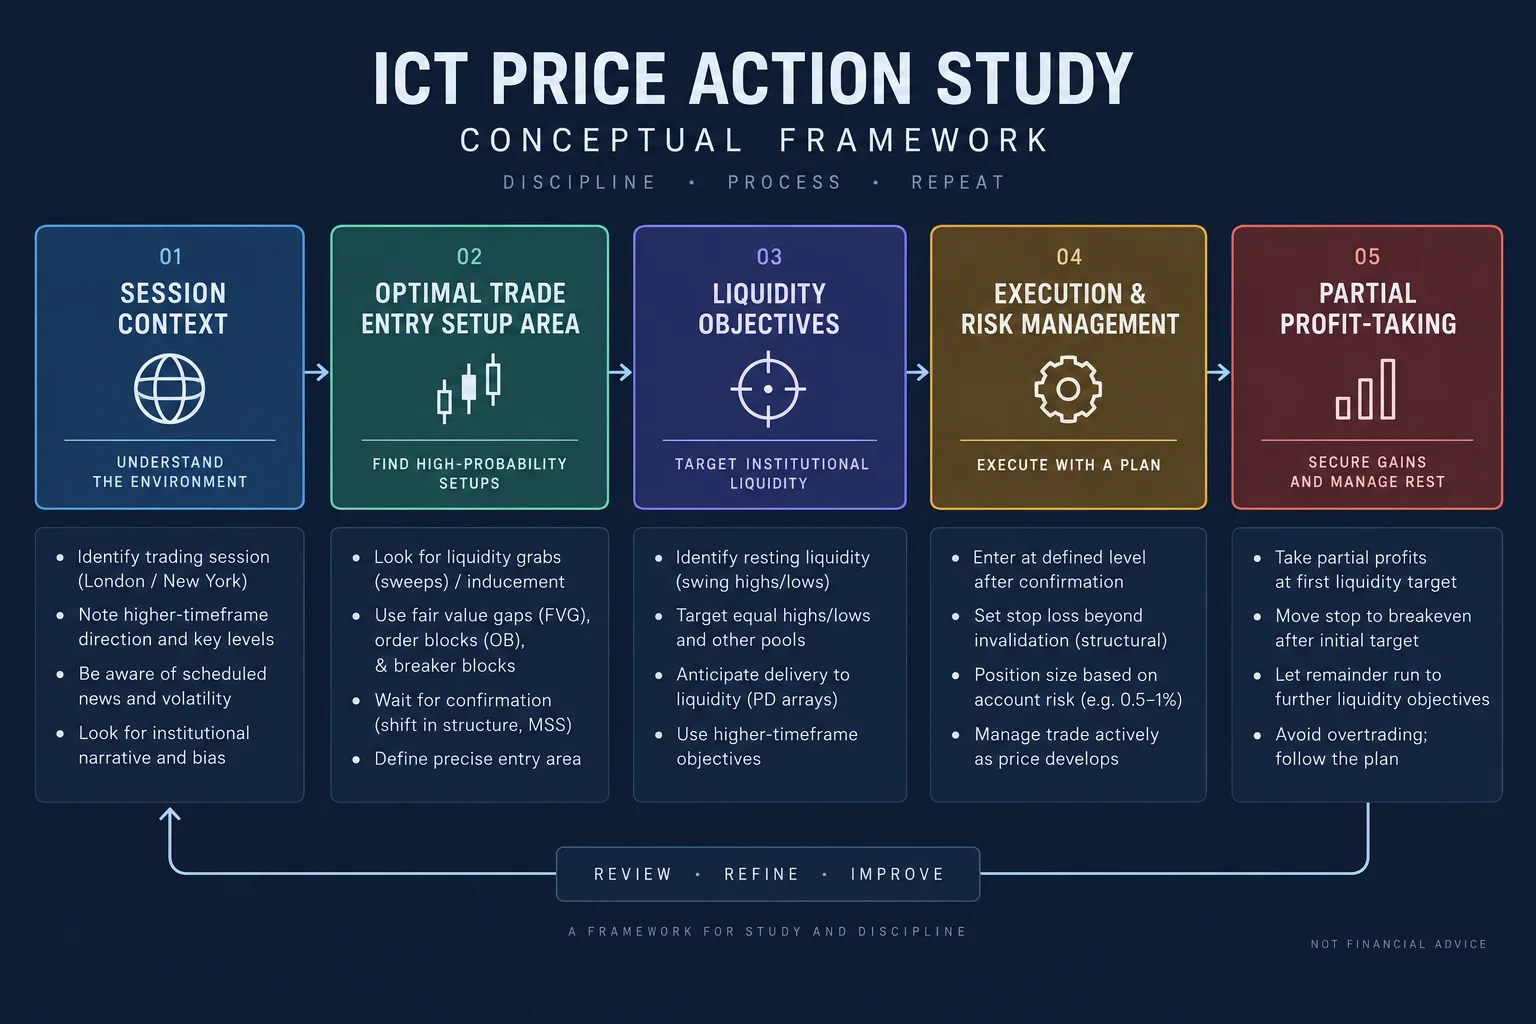
- Form a directional idea from market structure and session context.
- Use a retracement area for the proposed entry.
- Identify nearer liquidity or structural objectives.
- Reduce the position at intermediate objectives.
- Tighten risk after an important low or high is taken.
ICT EURUSD New York Session Example
ICT shifts to another EUR/USD example around 8:47. He directs attention to the 15-minute chart and mentions a level transcribed as 1.1807. On the five-minute chart, he says two optimal trade entries aligned with bullish order blocks during an 8:30 a.m. to 11:00 a.m. New York window.
He then uses relative equal highs on the 15-minute chart as an upside liquidity objective. In ICT’s interpretation, clustered highs can represent an area toward which price may be drawn. He says price subsequently moved above those highs and the 1.18 big figure. Because the chart and subsequent market data are not contained in the transcript, this should be understood as his narrated reading of the example rather than an independently verified result.
ICT Forex Price Action Takeaways
The most transferable point is not that a named pattern "delivers every day" (a broad claim made by ICT near) 9:48 but not established by this single lesson. Rather, the video demonstrates a structured way to discuss a setup: establish session context, mark a proposed entry zone, identify nearby objectives and decide in advance how risk will change as those objectives are reached.
For study purposes, viewers can turn that narrative into a testable checklist and review it across many historical samples, including failed setups. This lesson alone does not establish profitability, execution quality or a repeatable trading edge. It is educational commentary on ICT’s interpretation of one EUR/USD session, not investment advice.
ICT Forex Lesson Source and Further Reading
- The original ICT Forex Price Action Lesson: EurUsd MRP: use the timestamp links in this article to compare the explanation with its source.
- YouTube embedding documentation: platform guidance for the external watch link above.
- 17 CFR 4.41: disclosures concerning hypothetical performance: a regulatory reference relevant to hypothetical trading examples, not a statement that a particular recording or this article meets every legal requirement.
Watch the original ICT lesson on YouTube
Watch ICT Forex Price Action Lesson: EurUsd MRP on YouTube ↗
This article is educational commentary on the linked video and is not investment advice or a performance promise.



