
Key takeaways
ICT presents a historical chart-review drill for hypothetical intraday scalps, not a proven or live-capital strategy, combining daily directional bias, prior daily highs or lows, a 7 a.m.
Read the full summary
ICT presents a historical chart-review drill for hypothetical intraday scalps, not a proven or live-capital strategy, combining daily directional bias, prior daily highs or lows, a 7 a.m. New York reference, and retracement analysis. On bearish days, identify old daily lows as possible objectives, wait around 7 a.m. for a rally of roughly 20 pips or more that stays below the London-session high, then study overlap with the optimal trade entry area near the cited 62% and 70.5% retracements before monitoring an intraday low and older daily low as targets. ICT prefers candle bodies over wicks because wick-based levels may produce hypothetical orders that are not filled. On bullish days, reverse the process by studying a retracement lower and a potential move toward prior highs. The technique targets roughly 20 to 30 pips and may appear a few times weekly according to ICT, but the transcript provides no verified results. In the example, MT4 showed 11 a.m. when New York time was 7 a.m., an account-specific offset rather than a universal conversion. ICT recommends end-of-day review, tracking failures and ambiguous examples as well as successes, and warns that greater understanding does not guarantee profitability. A hypothetical growth claim using 2% risk per trade lacks a performance record, sample size, costs, loss sequence, and risk-of-ruin analysis.
How we researched this article
BestProps used document-based research from primary firm sources, checked September 25, 2026. The complete source list, scope, limitations, and commercial-state record appear near the end of this article.
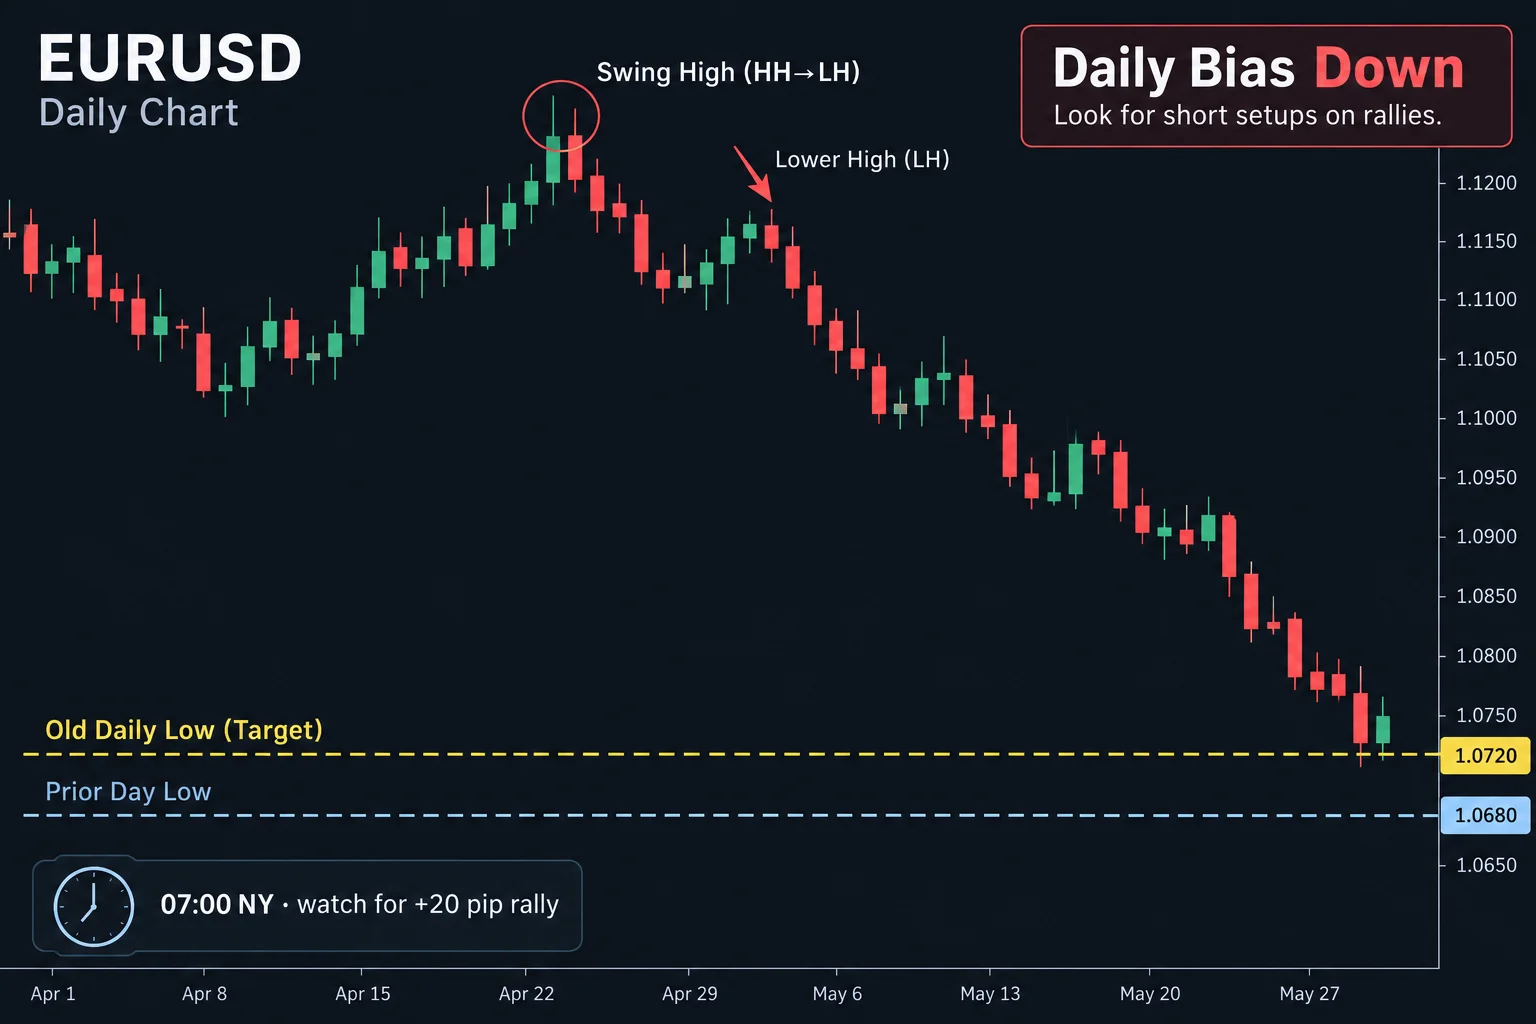

Watch: ICT Development Concept – Scalping Exercise (original source video, October 23, 2017)
In ICT Development Concept: Scalping Exercise, uploaded on October 23, 2017, ICT presents a chart-review drill for studying intraday price movement. The lesson combines a daily directional bias, prior daily highs or lows, a 7:00 a.m. New York reference time, and a retracement framework for identifying hypothetical scalp setups.
ICT frames this primarily as a practice exercise rather than an instruction to commit live capital. He also explicitly says that improved understanding does not guarantee profitability. The transcript documents his interpretation of one historical chart example; it does not independently establish that the method is predictive or profitable.
Set the ICT Scalping Bias and Daily Objective
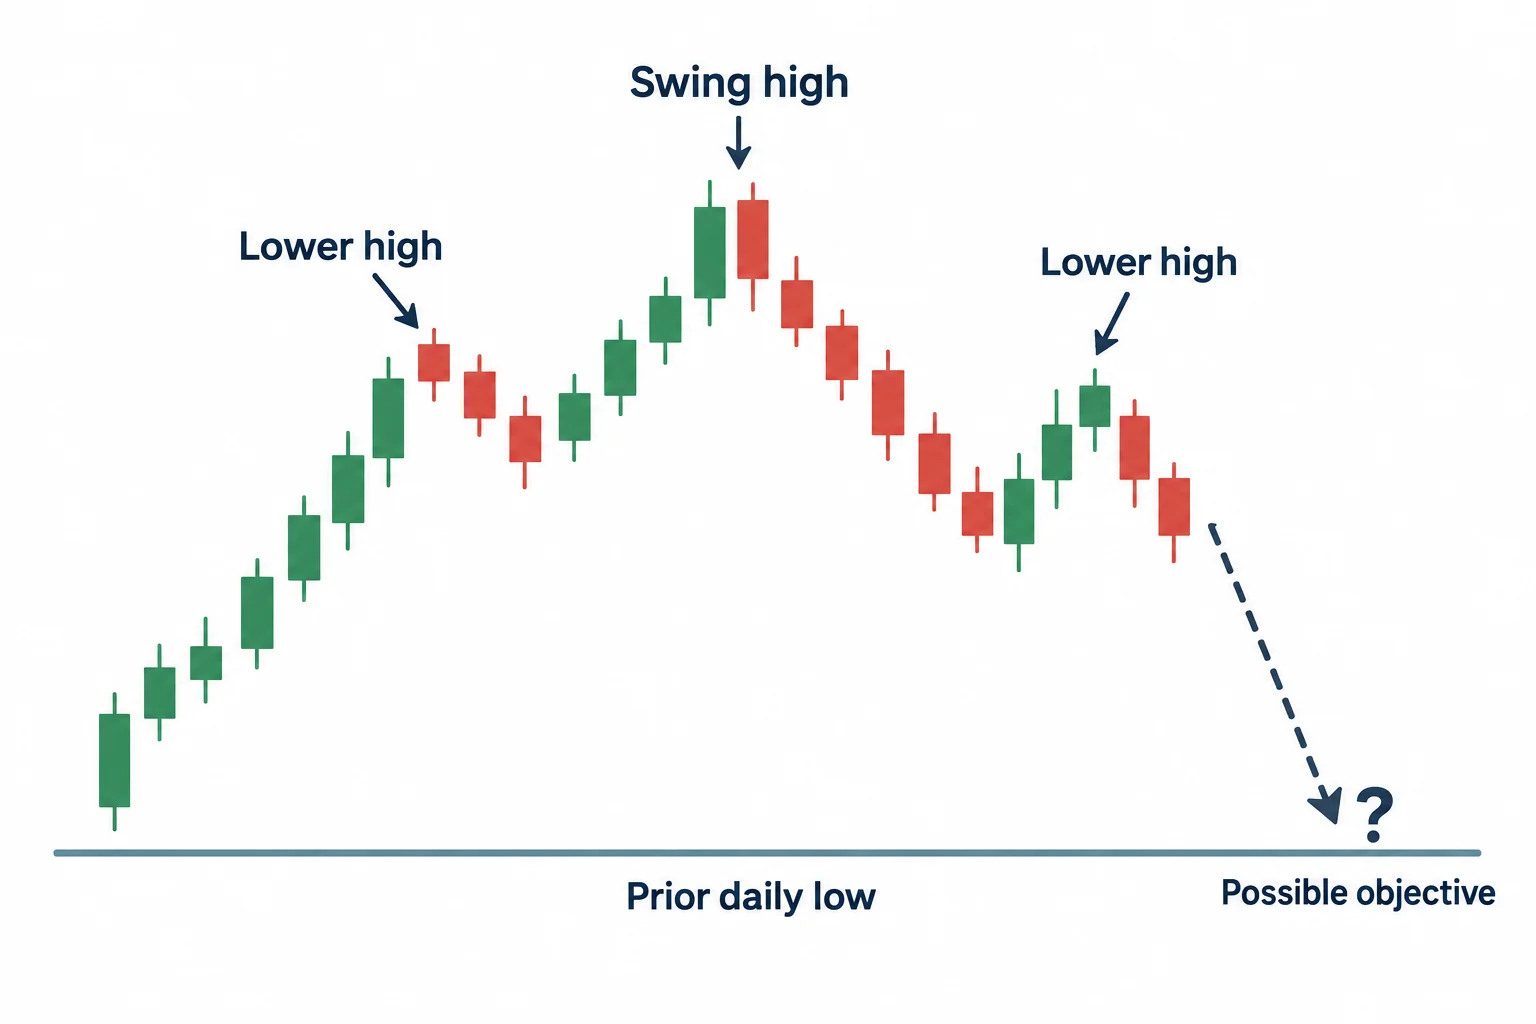
At 1:02, ICT begins with the daily chart and a swing-high structure: a high flanked by lower highs. In the bearish example, he watches successive prior daily lows as potential objectives. His basic premise is that, when the daily context points lower, an untouched or nearby old low may provide a logical level for price to approach.
He later describes this old low as a “mark” or target. At 3:45, he reasons that a level from which price previously rallied may be revisited. He does not claim certainty about the reaction: price could bounce, trade through the level, or fail to reach it. Within his framework, the prior low is therefore a minimum objective to monitor, not a guaranteed destination.
The available range matters as well. ICT says that the distance between current price and the proposed objective varies from one setup to another, and he prefers examples offering more room. Because the source is an automatically transcribed audio track without chart verification, the precise placement of the levels shown on screen cannot be independently confirmed here.
Practice the ICT Scalping Exercise at 7 a.m.
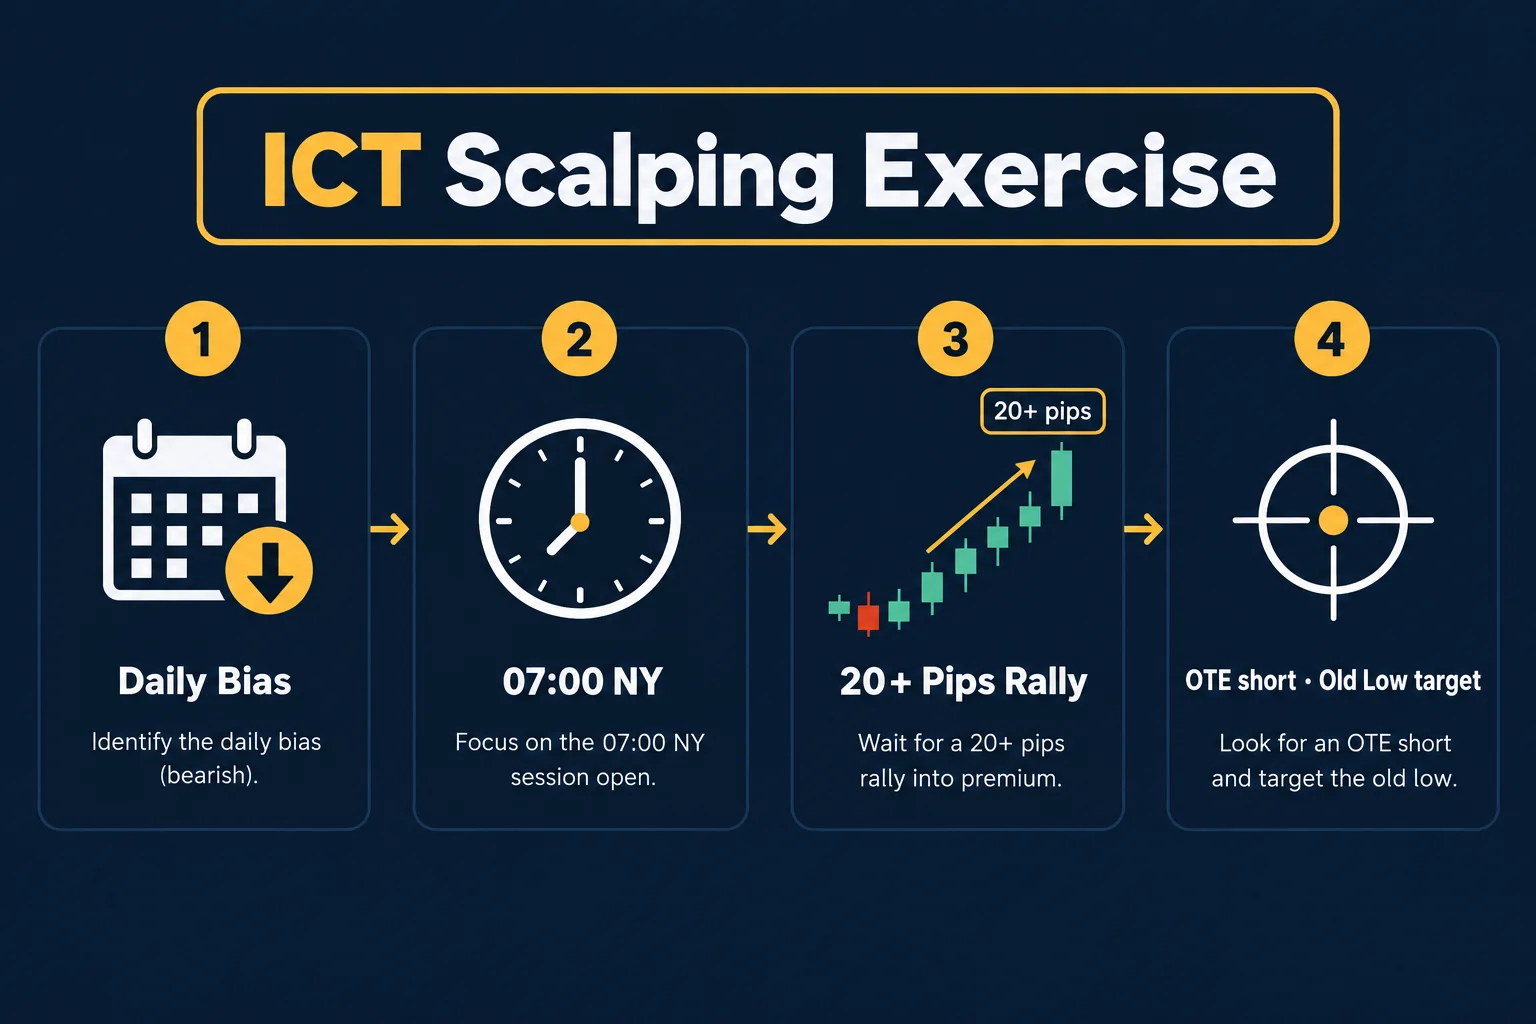
The practical exercise starts around 6:02. On a day classified as bearish, ICT tells viewers to inspect the market shortly before or around 7:00 a.m. New York time. He emphasizes that the directional bias must come first: the trader is supposed to decide from the daily chart whether price is more likely to pursue lows or highs.
For the bearish version of the drill, his sequence is:
- Establish a bearish daily bias before looking for an entry pattern.
- Mark relevant prior daily lows as possible downside objectives.
- At approximately 7:00 a.m. New York time, wait for price to rally rather than immediately chasing a decline.
- Look for a rally of roughly 20 pips or more that remains below the earlier London-session high.
- Measure the retracement and study whether it overlaps ICT’s “optimal trade entry” area.
- Use an intraday low and then the older daily low as levels to study as potential objectives.
At 9:54, ICT notes that his MT4 platform displayed 11:00 when it was 7:00 a.m. in New York. That offset was specific to the platform configuration in the example and should not be treated as a universal broker-server conversion.
Apply the ICT Scalping Concept on Bearish Days
Beginning at 10:43, ICT discusses Monday, October 23, 2017. In his reading, the session high formed during the 2:00–4:00 a.m. New York window. After an initial decline following 7:00 a.m., price rallied without exceeding what he calls the London high.
He then anchors a retracement measurement between an earlier high and the low preceding the rally. ICT says the rebound reached an area he associates with an optimal trade entry, while also overlapping an old Friday low and a prior swing level. He prefers using candle bodies for this exercise, explaining at 11:58 that measuring from wicks may produce more exact-looking levels but can also result in hypothetical orders not being filled.
The transcript includes references to approximately 62% and 70.5% retracement levels. One nearby phrase was transcribed ambiguously as “79 cent tradesman level,” so it should not be used as a precise rule without checking the original audio and chart.
ICT Scalping Drill at a Glance
Reverse the ICT Scalping Exercise on Bullish Days
At 13:52, ICT says to invert the framework when the daily bias is bullish. Instead of waiting for a post-7:00 rally to study a short, the exercise looks for a retracement lower followed by a possible move toward prior highs.
He characterizes the idea as a scalping technique aimed at relatively limited intraday movement, mentioning roughly 20–30 pips and suggesting that suitable examples may occur a few times per week. Those frequency and range statements are ICT’s own expectations, not results demonstrated by the transcript.
Use the ICT Development Exercise for Practice
The most defensible use of this lesson is as a repeatable chart-study routine. A learner can record the daily bias, the prior high or low selected before the session, what happened after 7:00 a.m. New York time, whether the specified retracement appeared, and whether the proposed objective was reached. Reviewing all examples (including failures and ambiguous cases) would be more informative than selecting only charts that fit afterward.
ICT himself calls part of the discussion hindsight analysis at 6:24 and recommends end-of-day review for people unable to watch live. That distinction is important: recognizing a clean pattern on a completed chart is not the same as identifying and executing it in real time.
The closing section also contains a hypothetical account-growth statement based on risking 2% per trade. The transcript supplies no performance record, sample size, loss sequence, transaction costs, or risk-of-ruin analysis supporting that claim. It should not be interpreted as a realistic projection or promise. This summary is educational commentary, not investment advice.
Sources
- ICT Development Concept: Scalping Exercise — original video (primary source; timestamped references throughout).
- Inner Circle Trader education library — ICT’s methodology references for daily bias, liquidity, and optimal trade entries.
- Risk per trade calculator — BestProps — supplementary sizing context for the hypothetical 2% risk-growth statement; not a projection.


