
Key takeaways
ICT uses historical EUR/USD daily, hourly and 15-minute charts to teach retrospective recognition of market-structure breaks and bullish and bearish breakers, not to document trades or verified results.
Read the full summary
ICT uses historical EUR/USD daily, hourly and 15-minute charts to teach retrospective recognition of market-structure breaks and bullish and bearish breakers, not to document trades or verified results. A structural break occurs when price exceeds a short-term swing high or low, while Fibonacci measurements favor candle-body opens and closes over wick extremes and may be re-anchored when a later body extends the swing. Confluence includes directional swing breaks, higher- and lower-time-frame retracement overlap, forceful movement, nearby candle bodies, order blocks and 62%, 70.5% and 79% retracement areas. The bullish breaker sequence is a prior low, a lower-low sell-stop sweep, an upside structural break and a later return to the earlier high area, with the revisit being essential. The bearish breaker reverses that logic through a prior high, buy-stop sweep, downside structural break and later rally into the reference low. Key sections begin at 49 seconds, 2 minutes 26 seconds, 4 minutes 40 seconds, 5 minutes 24 seconds and 5 minutes 55 seconds, while chart practice is recommended at 7 minutes 6 seconds. ICT disclosed that he took no trades during the discussed period, and unclear automatically transcribed terminology or prices should be verified against the original YouTube lesson, which was available directly despite off-site playback returning Error 153 on 22 September 2026.
How we researched this article
BestProps used document-based research from primary firm sources, checked September 25, 2026. The complete source list, scope, limitations, and commercial-state record appear near the end of this article.
In Pattern Recognition – Breakers & Market Structure, ICT walks through a historical EUR/USD chart to explain how he identifies breaks in market structure, retracement areas and bullish or bearish breakers. The lesson is primarily about learning to recognize a sequence of price movements, not documenting a trade or demonstrating a verified outcome.
ICT Market Structure Breaks
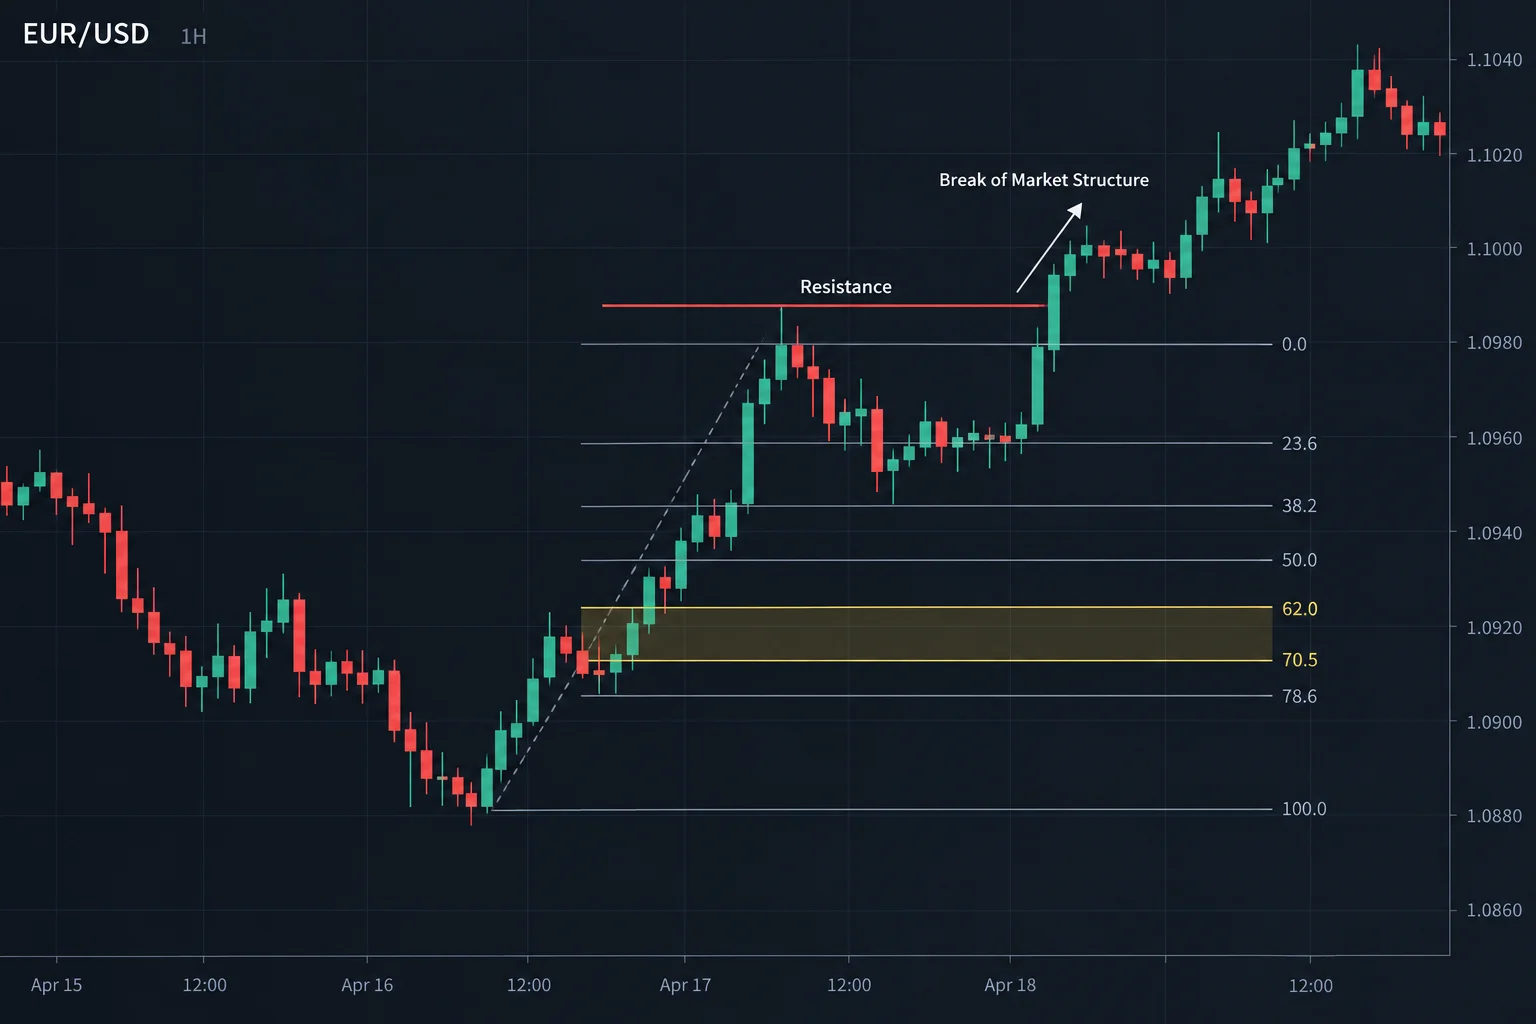
ICT begins by marking a short-term high as horizontal resistance. When price subsequently trades above that high, he classifies the move as a break in market structure at 0:49. He then refers back to the preceding low and describes applying a Fibonacci retracement across the swing.
His anchoring method emphasizes candle bodies, using relevant opens or closes rather than automatically selecting the full wick extremes. He notes that the anchor may change if a later candle body extends the swing. In the example, ICT interprets a retracement into the resulting area as a potential bullish setup, with the earlier high serving as an initial objective. This is his chart-reading framework, not evidence that the same formation reliably predicts future prices.
ICT Market Structure Across Time Frames
At 2:26, ICT moves from the daily chart to a 15-minute EUR/USD chart. He points to another short-term high being exceeded, followed by a deeper pullback. He describes that pullback as reaching an “optimal trade entry” area associated with the higher-time-frame Fibonacci measurement.
The commentary highlights several elements that ICT treats as confluence:
- A directional break of a recent swing point.
- A retracement into Fibonacci levels measured from a prior price swing.
- Overlap between higher- and lower-time-frame retracement areas.
- A swing with comparatively forceful movement away from its low.
- Nearby candle bodies and an order-block reference.
ICT discusses the 62%, 70.5% and 79% retracement areas during this section. However, the transcript is generated by automatic speech recognition, and some neighboring terminology and spoken price values are unclear. Those uncertain details should be checked against the chart and original audio rather than treated as exact data.
He also observes that a deep pullback can be uncomfortable for someone holding a bullish view and says that a tightly trailed stop could be triggered. The transcript does not reveal actual orders, fills or account results.
ICT Bullish Breaker Pattern
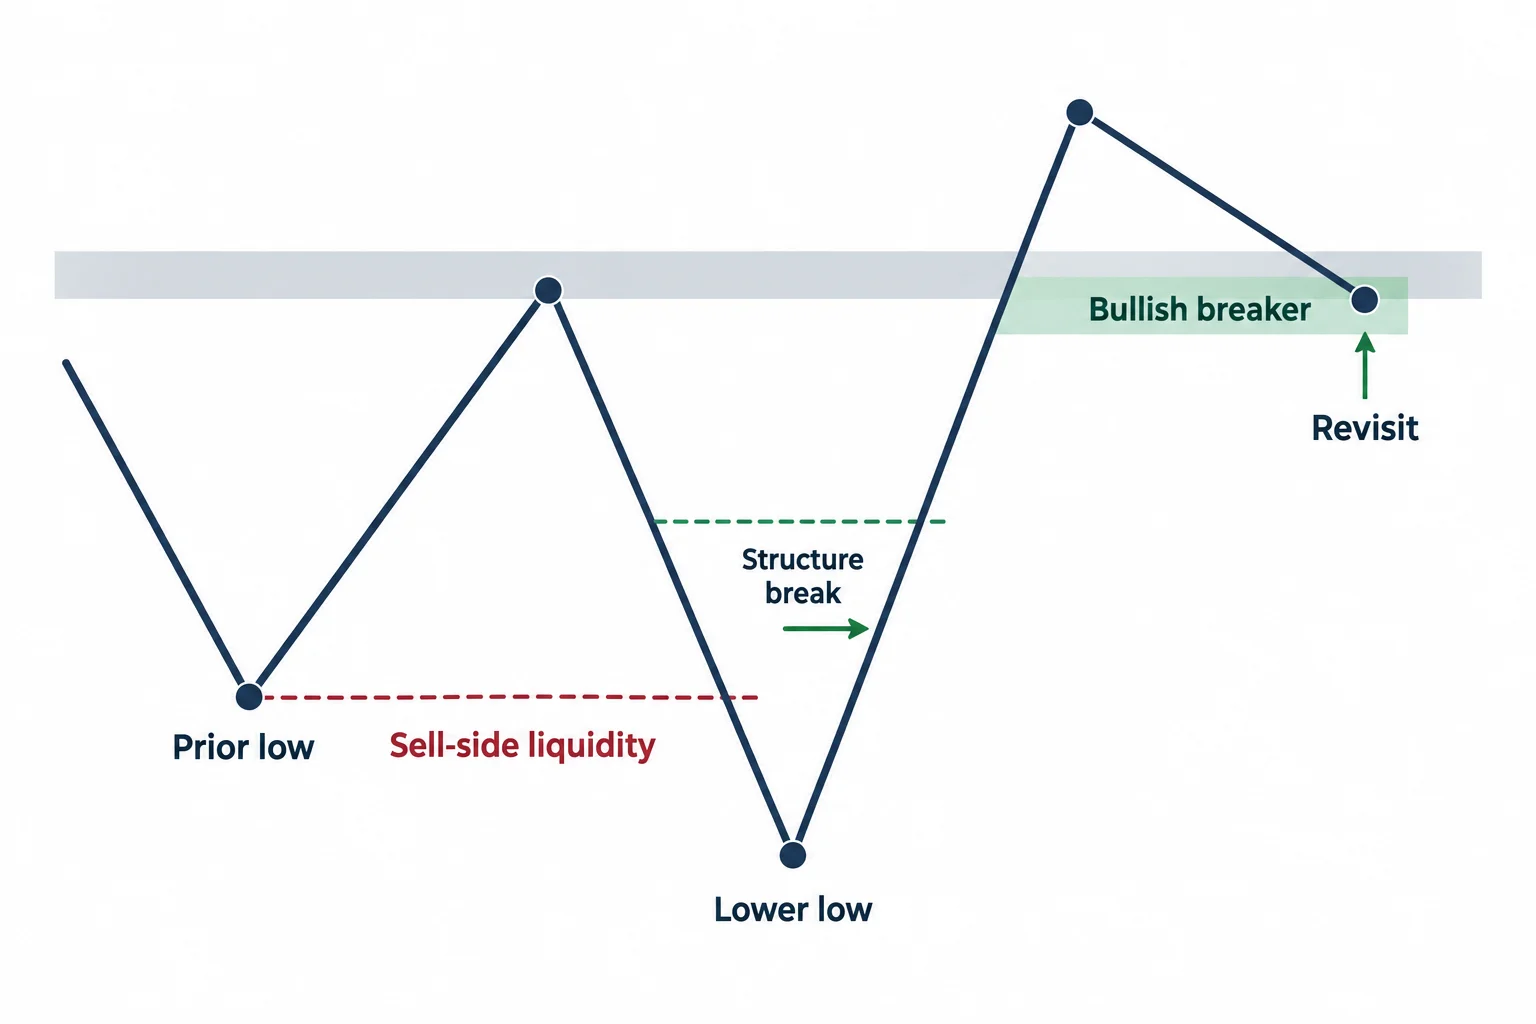
The main pattern lesson starts at 4:40. On an hourly chart, ICT identifies a low and assumes that sell stops have accumulated beneath it because price previously rallied away from that point. Price then moves below the low, which he interprets as removing that sell-side liquidity, before rallying again.
ICT summarizes the bullish breaker structure as follows:
- Price forms a low and subsequently trades to a lower low.
- The lower low moves through the prior low, which ICT interprets as a run on sell stops.
- Price rallies and breaks market structure to the upside.
- Attention shifts to the earlier high associated with the sequence.
- A later return to that area is treated by ICT as a bullish breaker scenario.
At 5:24, he explains that the later revisit (not merely the initial stop run) is central to how he recognizes the pattern.
ICT Bearish Breaker Pattern
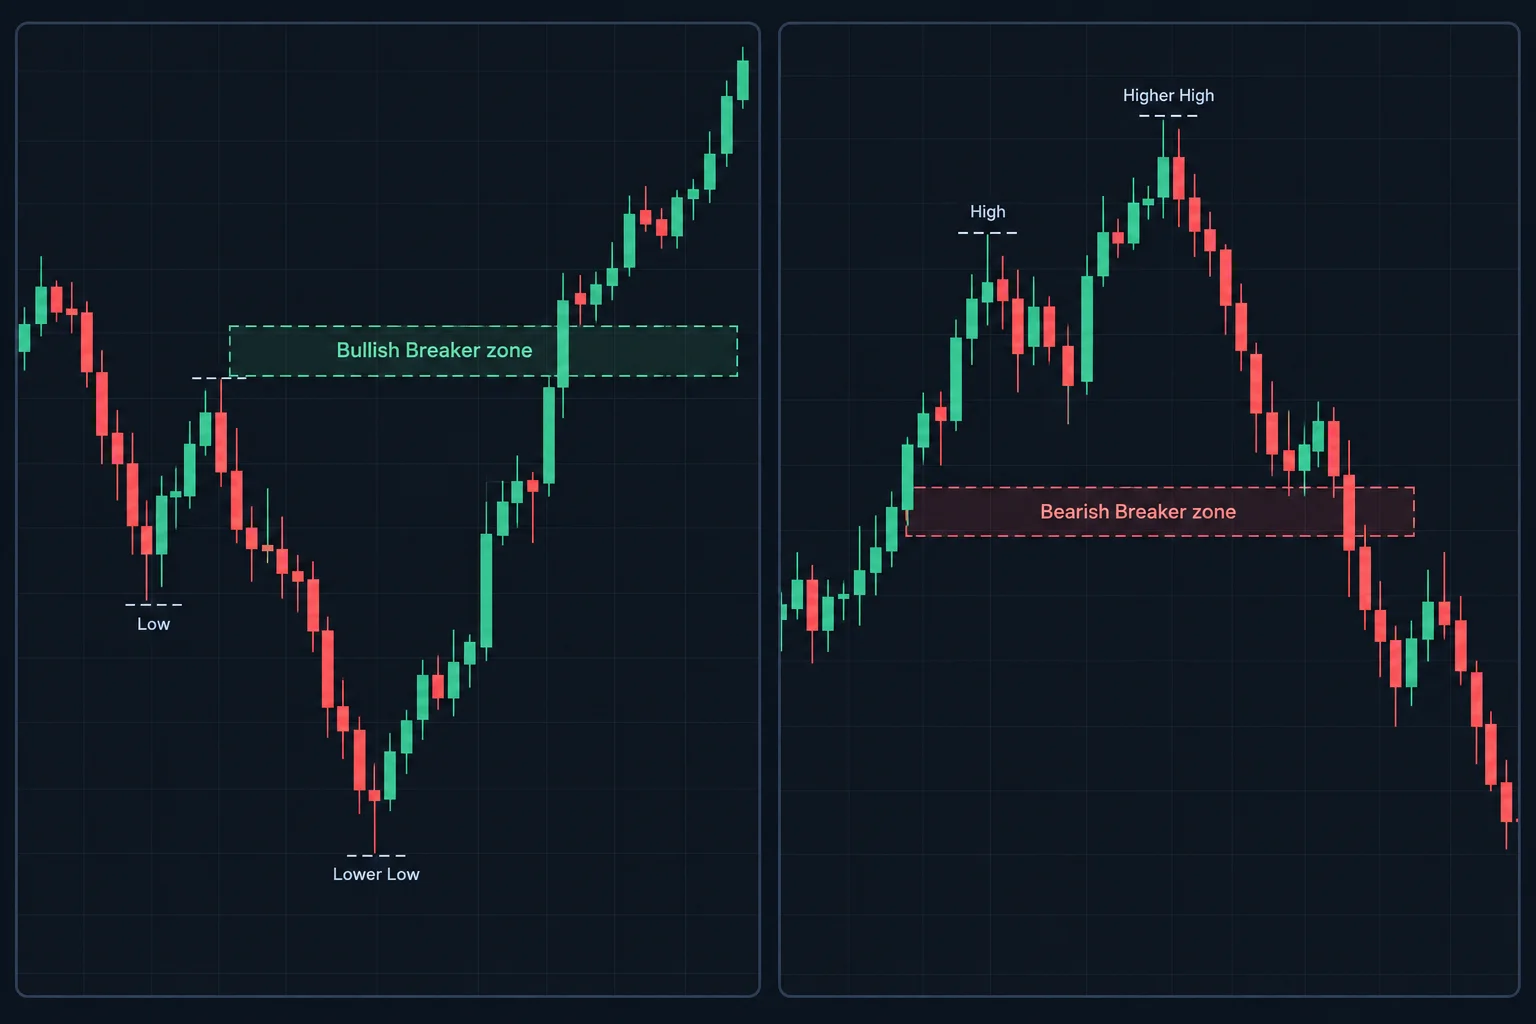
ICT then reverses the logic to describe a bearish market-structure pattern. Price forms a high and declines, leading him to assume that buy stops rest above that high. If price later trades above it, he views that move as taking the stops. The relevant reference then becomes the low that formed before the upward stop run.
After price breaks below that reference, a later rally back into it is interpreted as a bearish breaker. The explanation begins around 5:55. ICT uses the chart to show price revisiting what he calls the middle of a breaker before declining toward a bullish breaker area.
How to Study ICT Breaker Patterns
The most useful educational takeaway is to study the full sequence rather than label every isolated swing as a breaker. In ICT’s presentation, the pattern requires a prior high or low, a move through that level, a subsequent structural break in the opposite direction and a return to a defined reference area.
ICT explicitly cautions that beginners may not recognize these formations immediately and recommends chart practice at 7:06. A neutral study routine would be to mark candidate examples only after all parts of the sequence are visible, record the time frame used and distinguish body-based levels from wick extremes. That approach can help evaluate whether a label has been applied consistently, but it does not establish profitability.
Near the end, ICT discloses that he did not take trades during the period being discussed. Accordingly, the video is best understood as retrospective pattern commentary on EUR/USD rather than a record of executed trades. The complete primary source is available on YouTube.
Watch the original lesson on YouTube
The video cannot be played inside another website: when its embedded player was opened on 22 September 2026 it returned a YouTube “Video player configuration error” (Error 153), the player-level sign that the author restricted off-site playback. That is why a watch link is used instead of a reserved or blank embed; the recording itself is available directly on YouTube.
Watch Pattern Recognition – Breakers & Market Structure on YouTube ↗
ICT Breaker and Market Structure Sources
- The original Inner Circle Trader lesson: use the timestamp links in this article to compare the explanation with its source.
- CFTC Commitment of Traders reports: the source of the positioning data ICT references in the wider series.
- 17 CFR 4.41: disclosures concerning hypothetical performance: a regulatory reference, not a statement that a particular recording or this article meets every legal requirement.
This is independent educational commentary. It is not official ICT material, a tested trading system, or a claim that the reported results can be reproduced.



