
Key takeaways
ICT’s June 2017 index futures lesson introduces the E-mini S&P 500 ES, Nasdaq futures, and Dow mini futures using barchart.com charts, with all examples intended for paper trading rather than a tested real-money system.
Read the full summary
ICT’s June 2017 index futures lesson introduces the E-mini S&P 500 ES, Nasdaq futures, and Dow mini futures using barchart.com charts, with all examples intended for paper trading rather than a tested real-money system. ES quarterly codes are H for March, M for June, U for September, and Z for December, making ESU17 the September 2017 contract. Historical figures cited are $12.50 per tick, 0.25 point per tick, 4 ticks per point, $50 per point, and roughly $122,000 notional exposure. The New York session and ICT true trading day run from 9.30 a.m. to 4.00 p.m., peak stated volume occurs from 9.30 to 10.00 a.m., and the opening range spans 9.30 to 10.30 a.m., with its high or low treated as a possible daily extreme, stop run, or fair value setup. barchart.com displays Central Time in the examples, so 8.30 to 9.30 there corresponds to 9.30 to 10.30 New York time. ICT tracks opening-range highs and lows, order blocks, rejection blocks, Turtle Soup moves, edge retests, and relative volume, including a Dow example where a lower-volume second test of the low failed. He applies the same opening range to ES, Nasdaq, and Dow, keeps first-hour and first-30-minute extremes separate, and proposes later combining indices for directional signals, but the article reports no performance data, independently verified chart levels, or evidence that these patterns reliably predict outcomes.
How we researched this article
BestProps used document-based research from primary firm sources, checked September 24, 2026. The complete source list, scope, limitations, and commercial-state record appear near the end of this article.
This lesson opens a series on what ICT calls the major four asset classes, and it deals specifically with index futures. He asks viewers to read the disclaimers and says everything he discusses about index futures should be viewed in the light of a paper trade only (0:13). The presentation identifies itself as the June 2017 ICT Mentorship, index trading concepts, lesson one: basics and opening range concept (0:28).
The primary source is ICT Mentorship Core Content – Month 10 – Index Futures – Basics & Opening Range Concept, published on YouTube on 19 October 2022 with a running time of about twelve minutes. The recording dates its own material to June 2017, so every contract example and dollar figure below belongs to that historical presentation.
ICT Index Futures Contract Basics
ICT says the introduction focuses mainly on the E-mini S&P 500, with the other two indices he follows covered briefly (0:46). He gives the trading symbol as ES, standing for the E-mini S&P 500 (0:58), and names the session he concentrates on as the New York session, keyed to 9:30 a.m. through 4:00 p.m. New York time (1:08).
He then lists the quarterly delivery months and their letter codes:
- March (code H)
- June (code M)
- September (code U)
- December (code Z)
The format is the symbol, the month code, then the year, so he gives ESU17 as the September 2017 E-mini S&P contract (1:34). On tick size his figures are 12.50 per tick, with a quarter of one point equal to one tick, four ticks making one point, and fifty dollars per point (1:43). He describes leverage as fifty dollars multiplied by the level of the S&P 500 index, which he quotes at roughly 122,000 dollars at the time of that recording (1:55). Read those dollar amounts as part of the 2017 presentation, not as current contract, margin or notional figures.
ICT Opening Range and the True Trading Day
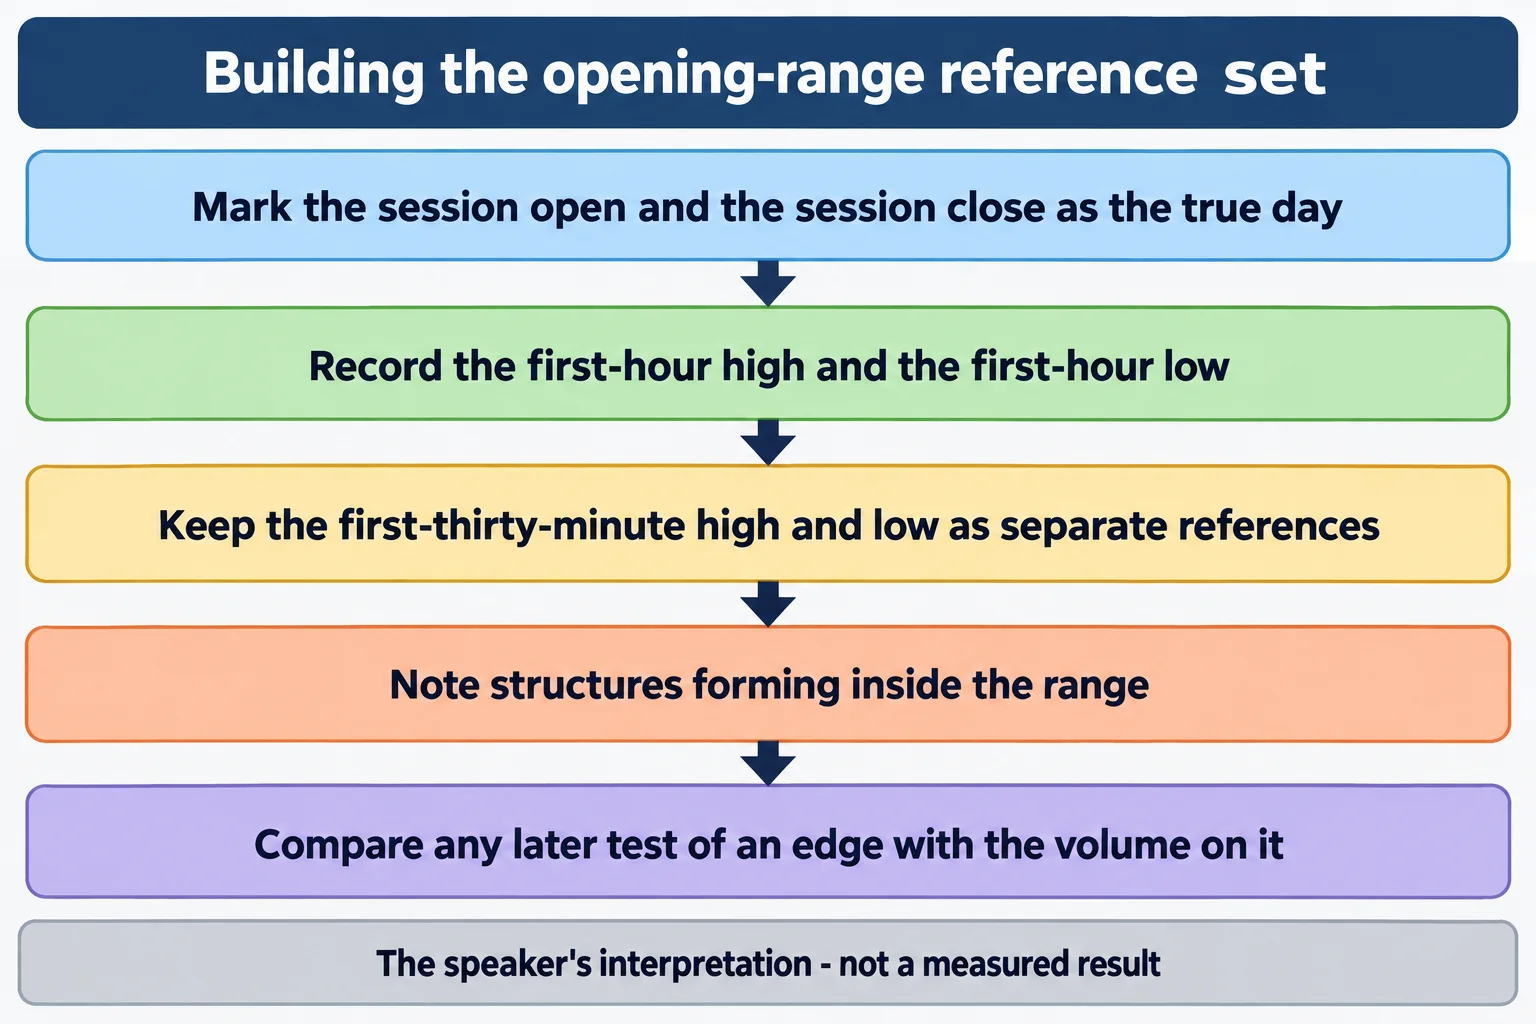
ICT notes that the highest volume in S&P trading sits between 9:30 and 10:00 a.m. New York time, a thirty-minute span that generally begins right at the open (2:35). His true day runs from 9:30 a.m. to 4:00 p.m. New York time (2:51); although the market trades around the clock, he keeps the analysis on the New York session for day trading. The opening range itself runs from 9:30 to 10:30 a.m. New York time, a one-hour window he says tends to produce the market high or low of the day and can be a run on stops or a fair value setup (3:07). He also calls S&P 500 trading “spoos,” a slang name he traces back to around 1983 (2:14).
One charting detail matters when following the lesson. Every chart shown is from barchart.com in Central Time, an hour earlier than New York, so a window highlighted there as 8:30 to 9:30 is the 9:30 to 10:30 New York opening range (3:42). Check the time zone a platform is displaying rather than copying its clock labels.
What ICT Reads Inside the Opening Range
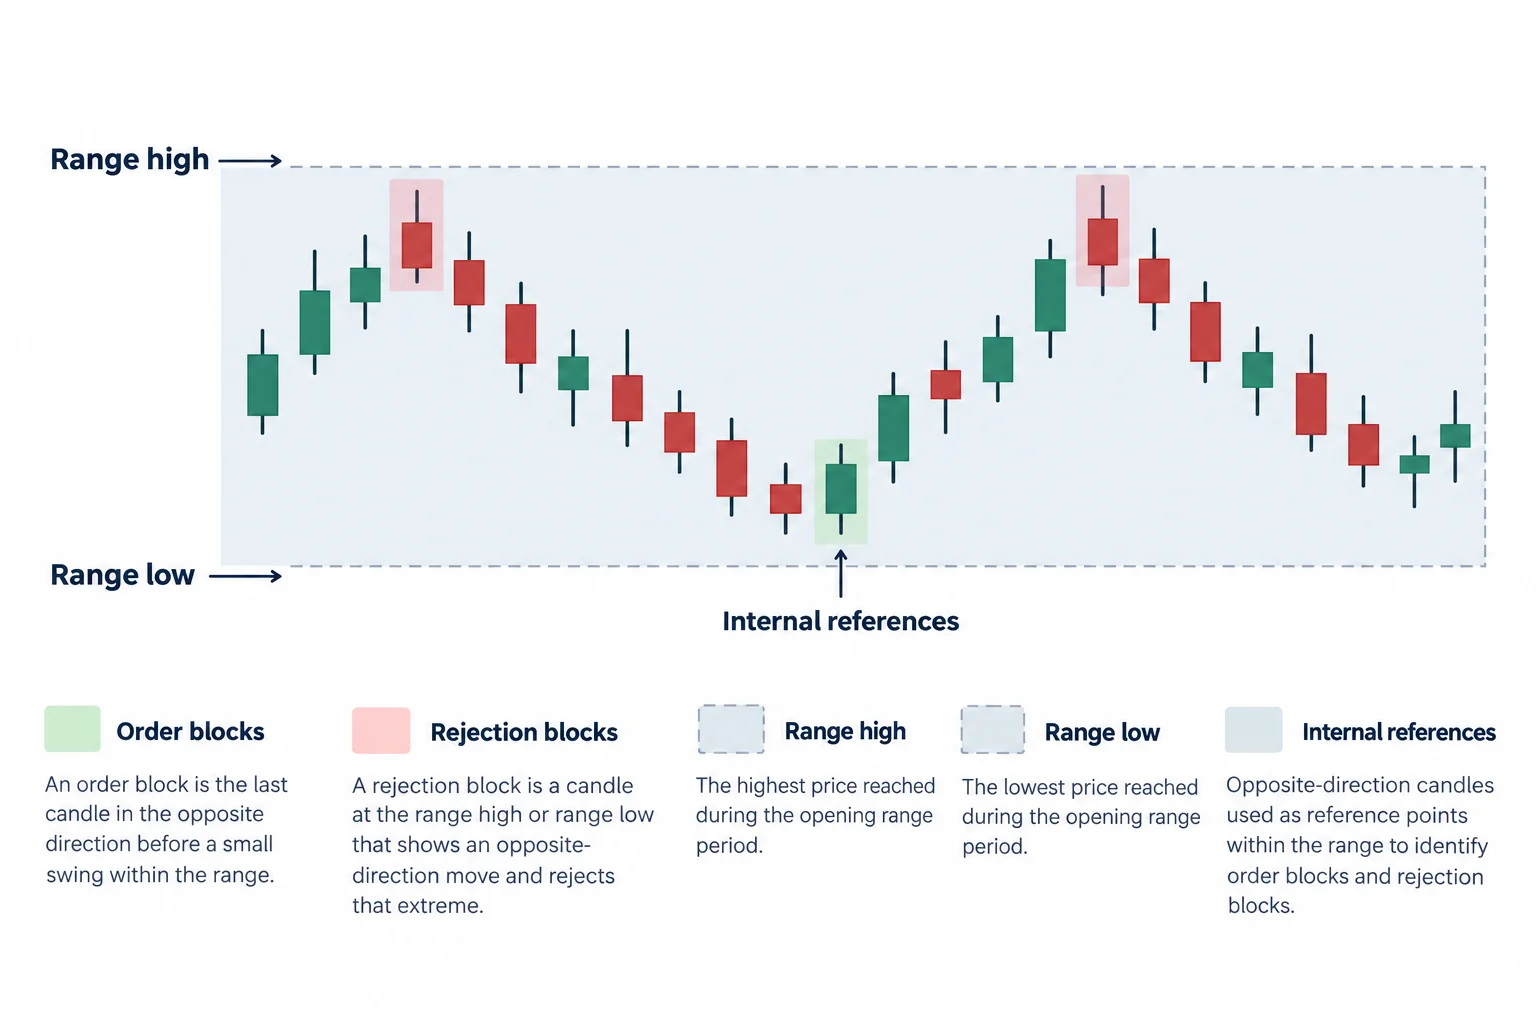
Across several E-mini S&P examples from the September 2017 contract, ICT marks the range high and low and then points to internal reference points he calls order blocks and rejection blocks, in his usage, the last opposite-direction candle before a move, watched afterwards as a level. In the first example he identifies a return into a previous up-close candle before price later trades up to a reference point inside the opening range (4:08). A later five-minute example has price returning to a down-close candle before a rally (5:31). These are locations for contextual reading in his framework, not mechanical entry rules, and the transcript alone does not establish the exact levels or fills.
One example uses an unusually wide opening range (5:59). His interpretation is that a wide range gives a larger area to work back into, and that when the range is extended he looks for the opposite edge of the range to be violated or retested later in the day, depending on directional bias. In the case he narrates, price ran below the opening-range low (what he calls a Turtle Soup) and then rallied back to the range high to run the stops resting there (6:51). He presents this as his reading of one historical chart, not as a rule that an edge will reliably break.
Applying the ICT Opening Range to Nasdaq and Dow
He extends the identical 9:30 to 10:30 a.m. New York opening range to the Nasdaq futures contract he follows, marking the range high and low and pointing out a rejection block formed by the last up-close candle inside the range, which he says was later reused as a reference point for a sell-off (7:15). He notes the Nasdaq futures session is the same, opening at 9:30 and closing at 4:00 p.m. New York time.
The Dow mini-future example begins at 8:31. He marks an opening-range low that had been made on a move down from the overnight session, then describes a later attempt to trade below that low which failed. His reason is volume: in his narration the candle that made the low of the day inside the opening range carried the high green volume bar, while the second attempt down came on a lower red volume bar (9:27). He refers back to his commodity teaching that volume precedes price (a retest of an old low or high should show higher volume, and here it did not) and reads the rejection block as having failed to attract the volume a genuine break would need. That is his interpretation of one historical chart. It is not a demonstrated rule that a lower-volume retest must reverse, and the transcript cannot verify the chart’s volume or price values independently.
What the ICT Index Futures Lesson Establishes
Near the end he says indices can be studied individually, as shown, and later blended together for stronger directional signals, along with time-of-day specifics unique to index trading (10:43). He closes by saying there is a specific relationship between the first hour’s range high and low and the first thirty minutes’ high and low, to be developed in a later teaching on trading the AM trend (11:43). This recording is therefore an introduction to that vocabulary, not a complete method.
Two limits are worth stating plainly. The transcript is a record of what ICT says; it does not contain the chart images, so the levels, order blocks and volume bars described above cannot be independently checked against a visual source, and nothing here verifies real-money results. And a tendency for the opening range to contain the day’s high or low is his stated interpretation, not a measured statistic. The lesson reports no performance figures of any kind.
ICT Index Futures Basics for Educational Use
Set aside the proprietary labels and the lesson still describes a repeatable research habit: pick one time window, record its extremes before the session unfolds, and keep the two nested windows (the first hour and the first thirty minutes) separate rather than merged. A study log can record how wide the range was, whether either edge was later tested, and what happened to volume on that test, without needing to predict an outcome. Reviewing many sessions is what would show whether the pattern has any value for a given trader. Futures are leveraged instruments and losses can exceed the amount committed; this article is educational commentary, not investment advice.
Watch the ICT Index Futures Opening Range Lesson
This article is built from the timestamped English captions of the recording. Captions are a record of the speaker’s words, not independent evidence for anything he reports about markets.
Watch the original lesson on YouTube
The video cannot be played inside another website. When its embedded player was loaded and clicked in a real browser on this page’s behalf on 15 September 2026, the player reported “Playback on other websites has been disabled by the video owner” and offered a “Watch on YouTube” prompt, with no duration and no playback progress. That is why no embed is left blank or half-working here; the recording plays normally on YouTube itself.
ICT Index Futures Sources and Further Reading
- The original Inner Circle Trader lesson: use the timestamp links in this article to compare each explanation with its source.
- CME Group E-mini S&P 500 contract specifications: the exchange’s official specification page, useful for checking the contract unit, tick increment and quarterly listing pattern. It reflects the current specification and will not match every historical figure quoted in the 2017 lesson.
- CME Group education: the exchange’s own introductory material on futures mechanics and margin, useful background that is independent of ICT’s terminology.
- U.S. Commodity Futures Trading Commission (learning resources): regulator material on futures markets and on evaluating trading claims.
This is independent educational commentary. It is not official ICT material, a tested trading system, or a claim that any described approach produces results.


