
How we researched this article
BestProps used document-based research from primary firm sources, checked September 24, 2026. The complete source list, scope, limitations, and commercial-state record appear near the end of this article.
This is the first lesson in ICT’s bond trading concepts, and it opens the commodity portion of the mentorship. He states at the outset that he is not a licensed CTA, that this is not trade advice, and that everything discussed in the month’s content is to be treated as a paper trade only (0:01). The recording identifies itself as the June 2017 ICT Mentorship, bond trading, lesson one: basics and opening range concept (0:16).
The primary source is ICT Mentorship Core Content – Month 10 – Bond Trading – Basics & Opening Range Concept, published on YouTube on 17 October 2022 with a running time of roughly eighteen minutes. The lesson dates its own material to June 2017 and works from the September 2017 contract, so its symbols, price levels and contract-value arithmetic belong to that historical period.
What contract he means by “bonds”
When he says “the treasury bond,” he means specifically the 30-year U.S. Treasury bond futures contract, traded under the root symbol ZB (0:46). He says the concepts taught that week are primarily used to analyse the New York session, and gives that session as 8:20 a.m. to 3:00 p.m. New York time (1:02).
The delivery months and their letter codes are the same quarterly set used across the other contracts he teaches:
- March — code H
- June — code M
- September — code U
- December — code Z
The format is the root symbol, the month code, then the last two digits of the year, so ZBU17 is the September 2017 30-year Treasury bond contract (1:19). He notes it trades on the Chicago Board of Trade (1:53). On tick and point value his figures are 31.25 per tick, with one full point — a handle — equal to 32 ticks and worth 1,000 dollars per contract (2:23). Those are contract-value facts about a 2017 instrument, not an indication of attainable profit. CME Group’s current specification page for ZB still lists the outright minimum price fluctuation as 1/32 of one point, or 31.25 dollars, which is a useful cross-check on the tick arithmetic even though the article’s other figures come from the 2017 recording.
The bond opening range and the true day
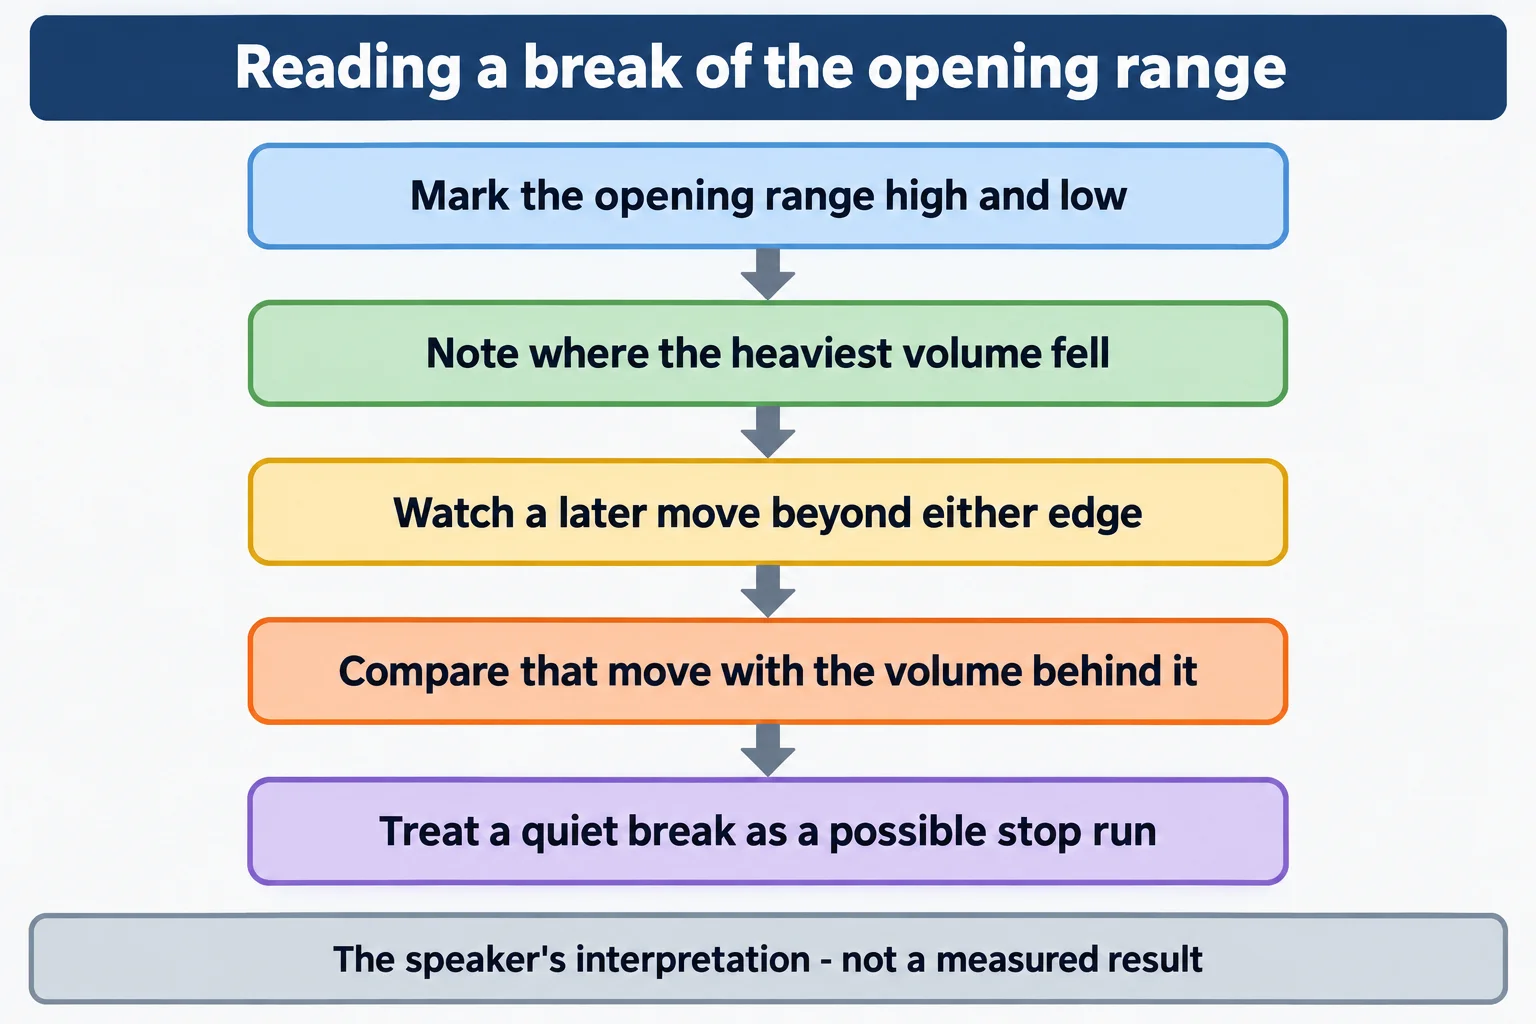
The central concept starts at 3:05. He says the highest volume in the bond market is seen between 8:00 and 9:30 a.m. New York time, while the true day for bonds is 8:00 a.m. to 3:00 p.m. New York time (3:19). The opening range itself begins at 8:00 a.m. and ends at 9:00 a.m. New York time — an hour, not the thirty minutes that get the heaviest tape.
His stated procedure is:
- Open a 15-minute chart of the relevant ZB contract.
- Mark the interval from 8:00 through 9:00 a.m. New York time.
- Record the highest and lowest prices formed during that hour.
- Watch how price behaves when it later approaches or crosses either boundary.
- Compare that move with the volume accompanying it.
He says this range tends to create the bond market’s high or low of the day and can be a run on stops or a fair value setup — in his words a bullish or bearish order block, or a trade down into a liquidity void or fair value gap. He also describes it as a place where liquidity pools build ahead of the stock market open. These are his framework’s labels and his interpretation; the lesson reports no statistical testing of them.
The three chart examples he walks through
A break below the range on lighter volume. From 4:16, he marks the 8:00 to 9:00 a.m. high and low on a 15-minute chart. Price trades below the low formed in that hour (4:46), and he calls that a stop run and a potential reversal. His evidence is volume: the heaviest volume of the day sat inside the 8:00 to 9:00 a.m. window, while the lower low made after 9:00 a.m. came with less volume. He reads that as a volume divergence — in his words, a lower low should have been met with a higher volume bar, and its absence signalled weakness for the down move rather than continuation (5:16). He is describing what he sees on one chart, not establishing a rule that a low-volume break must reverse.
A bullish order block inside the range. The second example starts at 6:41. He identifies the last two down-close candles inside the opening range as a bullish order block, sees price trade back into it, and watches it rally away from that area (7:17). As price makes a higher high into the 11 o’clock hour, he says volume was declining, and he calls that divergence an early sign that the move up was weak. Price then declines back into the opening range and consolidates. He notes that commodities give a real volume read through the vertical green, blue and dark blue bars (8:21).
A light-volume break above the range. In the third example, from 8:39, the last down-close candle inside the range again serves as an order block, with two reference points he says either of which would suit. He describes price reaching a level above the opening range high on light volume rather than the larger volume seen later in the day, running the stops above the range and failing to hold, then trading down to close in a fair value gap. As in the other examples, the transcript gives his narration of levels such as the 154 handle but supplies no chart image, so the levels, the volume bars and the outcomes cannot be independently verified here.
Where the method becomes discretionary
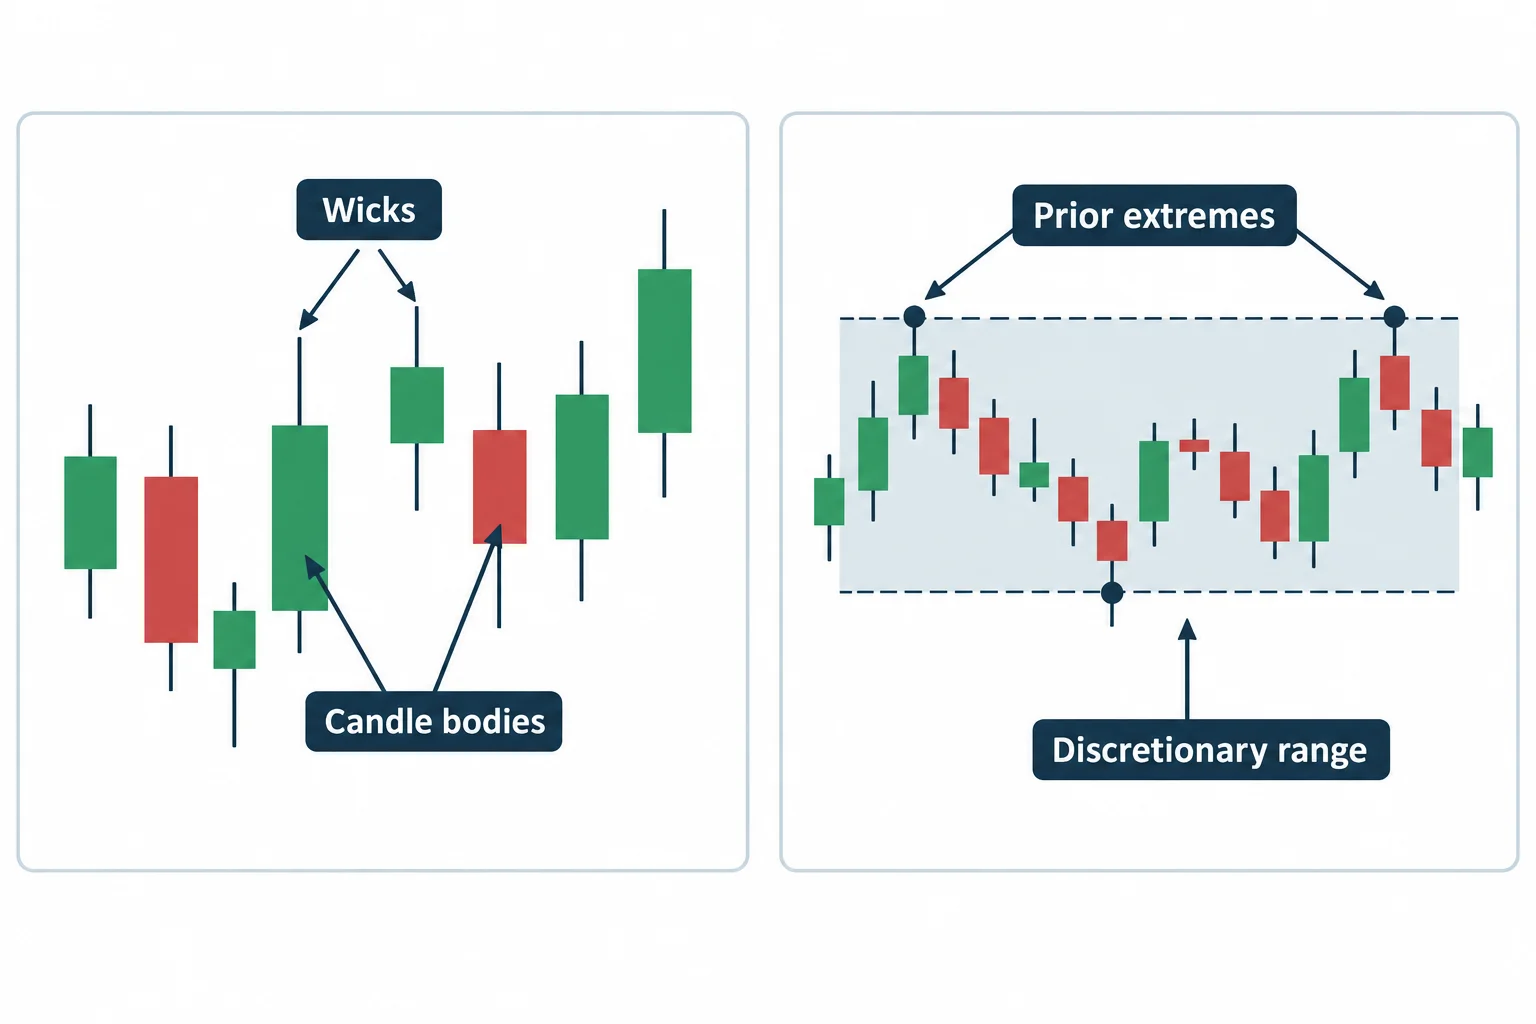
At 10:34 he explains how he actually draws the range. Rather than two mechanical lines around one hour of data, he looks for the candle bodies but also incorporates wicks, and he pulls in previous highs or lows sitting just to the left of the 8:00 to 9:00 a.m. window (11:01). He notes the resulting reference point later became an issue for stop running during the Asian session. Anyone comparing their own mark-up with his should expect differences, because this step is a judgement call rather than a fixed rule.
On timing, he says he likes to see signals form at 8:20 a.m. or after, that they can occur as early as 8:00 a.m. and sometimes shortly before, and that he generally prefers 8:00 to 8:30 a.m. (11:48). His reason is participation: New York traders are arriving around 8:20 while London traders are still on the clock, and European traders wanting exposure to Treasuries have a large, liquid market to work in (12:06). He calls the bond market the least manipulated of the markets he has traded, then immediately qualifies it — least in relative terms, not free of it (11:31). That is his opinion and not a testable claim from this source.
News risk, expectations and the practice routine
He warns that around FOMC decisions, interest-rate reports and non-farm payroll releases the bond market “can get a little wonky,” and that the simplest response is to stay out of the asset class ahead of those events. His stated reason is that liquidity is poor in those windows, the market can gap toward liquidity, and the gap is likely to be against a resting position. He acknowledges plainly that order blocks fail, that setups sometimes go the other way or go sideways, and that no asset class is perfect (16:19).
His guidance on expectations is modest and worth quoting in substance: ZB does not have a large daily range, so capturing five to eight ticks on an intraday basis is reasonable, sixteen ticks is 500 dollars per contract and would be a good day, and a full handle of 32 ticks is what he calls a large range day rather than the norm (15:13). He does not present any of that as a performance record.
The practical exercise he gives is near the end: open barchart.com on a 15-minute timeframe for the current contract, keep a running journal of what the bond market is doing, and do it daily even if you never intend to trade bonds — because watching it day by day builds price-action skill and an appreciation for how bonds relate to interest rates (17:01). He adds that reviewing bonds alongside the dollar, gold and the foreign currencies is part of the exercise (18:08).
General educational interpretation
Stripped of the proprietary vocabulary, the lesson describes one repeated observation: record a fixed time window’s extremes, then look at whether the volume behind a later break of those extremes is expanding or contracting. Comparing a price event with the participation behind it is a standard idea, and it is what makes this lesson more useful than a bare line-drawing tutorial. The caution is equally standard — one speaker narrating three historical charts establishes a hypothesis to study, not a result. A trader testing the idea would log the range, the break, the volume and the outcome over many sessions before drawing conclusions, and would check current contract specifications rather than relying on 2017 values. Futures are leveraged; losses can exceed the amount committed. This article is educational commentary, not investment advice.
Watch the original lesson
This article is built from the timestamped English captions of the recording. Captions are a record of the speaker’s words, not independent evidence for anything he reports about markets.
Watch the original lesson on YouTube
The video cannot be played inside another website. When its embedded player was loaded and clicked in a real browser on this page’s behalf on 15 September 2026, the player reported “Playback on other websites has been disabled by the video owner” and offered a “Watch on YouTube” prompt, with no duration and no playback progress. That is why no embed is left blank or half-working here; the recording plays normally on YouTube itself.
Primary source and further reading
- The original Inner Circle Trader lesson: use the timestamp links in this article to compare each explanation with its source.
- CME Group 30-Year U.S. Treasury Bond futures specifications: the exchange’s official page for ZB, useful for checking the contract unit, the 1/32 tick increment and the quarterly listing pattern. It reflects the current specification, not the 2017 values quoted in the lesson.
- U.S. Commodity Futures Trading Commission — learning resources: regulator material on futures markets and on evaluating trading claims.
- 17 CFR 4.41 — advertising by commodity trading advisors: the rule on presenting hypothetical or simulated performance, relevant background when a trading lesson is described in promotional terms. A regulatory reference, not a statement that any particular recording or article is compliant.
This is independent educational commentary. It is not official ICT material, a tested trading system, or a claim that any described approach produces results.


