
Key takeaways
ICT’s 128-second YouTube clip presents a discretionary long scalp on a five-second chart, not a course or verified institutional high-frequency trading system.
Read the full summary
ICT’s 128-second YouTube clip presents a discretionary long scalp on a five-second chart, not a course or verified institutional high-frequency trading system. ICT claims a scalp appears in every 15-minute interval, enters from what the transcript likely misrenders instead of inversion fair value gap, places an unspecified stop, targets relative equal highs and a breach of the prior high, and uses a ten fifty to eleven ten window he calls a macro. Around one minute four seconds he says he will add five more without identifying the unit, then cites minor buy-side liquidity, expected acceleration and, at one minute 38 seconds, covered risk and costs. The clip provides no instrument, time zone, visible prices, order ticket, position size, fills or final outcome, so profitability, execution and repeatability cannot be verified. The title’s high-frequency trading label is unsupported by evidence of automated execution, exchange co-location or order-cancellation activity, while the SEC notes that HFT has no statutory or regulatory definition.
How we researched this article
BestProps used document-based research from primary firm sources, checked September 24, 2026. The complete source list, scope, limitations, and commercial-state record appear near the end of this article.
In the short video Algorithmic High Frequency Trading \ January 25, 2024, ICT narrates a proposed long scalp while referring to a five-second chart. The clip presents his interpretation of short-term price behavior, but the transcript alone does not show the instrument, visible price levels, execution details, or what happened after the recording ended.
ICT Five-Second Chart Scalp Explained
ICT begins at 0:00 by referring to something he said on the previous day’s livestream (that every 15 minutes there is a scalp a trader can take) and at 0:08 says he will show what one of them might look like. The claim about frequency is his own assertion and is not tested anywhere in the clip.
He then describes going long from what the automatic transcript renders as an “inversion fair vega” and says the stop loss “will be here” at 0:14. “Inversion fair value gap” is the term he uses elsewhere in his own framework, so the audio is very likely a mis-transcription of that, but the transcript alone cannot settle it and the rendering is left visible rather than silently corrected. At 0:21 he notes that it “is not a lot” because this is a five-second chart, so every candlestick represents five seconds of duration. No price for the entry or the stop is stated in words.
Equal Highs as the ICT Trade Target
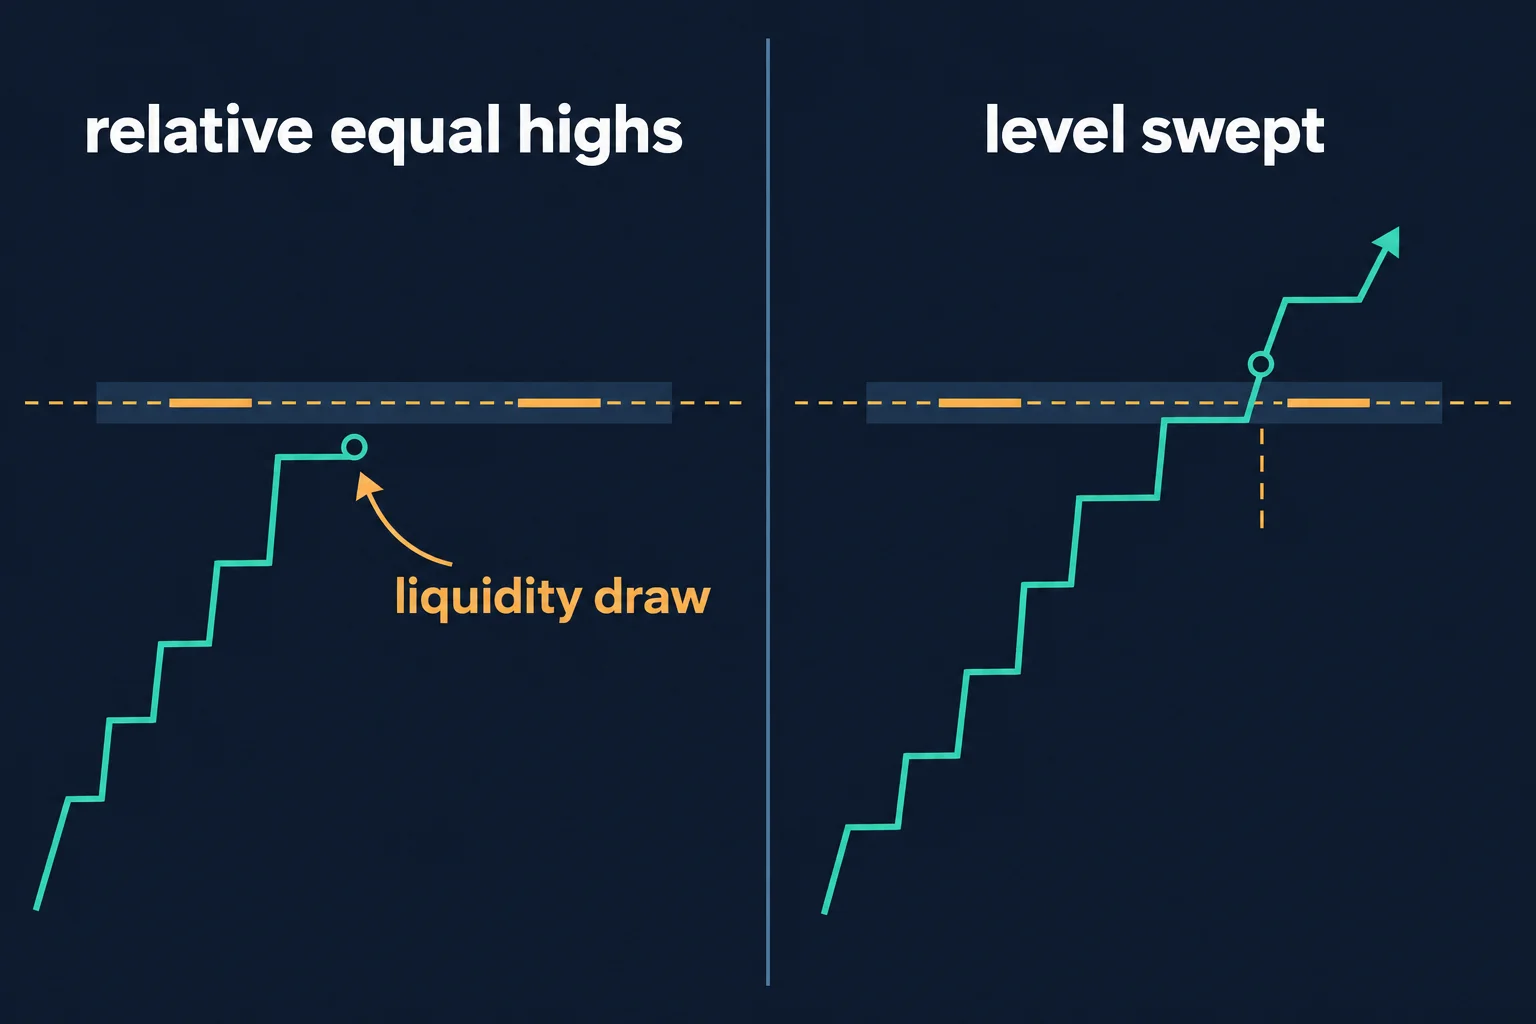
At 0:26, ICT points to what he calls relative equal highs and says at 0:30 that this is where “the algorithm is going to reprice to.” He adds at 0:35 that it will not stop there but spike above the prior high as well. Both statements are a forecast he makes during the clip, not independently established evidence about how any market algorithm must behave, and the clip does not return to say whether either level was reached.
At 0:47 he says he is keying off the “1050 to 1110 macro.” The transcript does not identify the time zone, the instrument, the session date being charted, or the rules that define this window, so the reference should not be treated as a complete trading model. “Macro” is his own term for a time-of-day window and carries no standard definition outside his teaching.
Managing the ICT Scalp for Expected Acceleration
Around 1:00, the automated transcript records something resembling “volume of balance” followed by a note that price is running higher, and at 1:04 he says “I’ll add five more.” The exact technical term is unclear from audio, and the unit being added is not stated. He never says five more of what. No account statement, order ticket, position size or fill price appears in the transcript.
At 1:14 he identifies “minor buy side here,” and at 1:16 says price should accelerate once it clears that area and then reach “real aggressive” levels further above. At 1:38 he states that “risk and costs are covered.” That is his contemporaneous description of the position as he narrates it; the transcript supplies no entry, stop, target or size, so risk, cost and any resulting profit cannot be calculated or confirmed from the source, and the review did not see the chart.
ICT Algorithmic Trade Education
- Timeframe: the example is explicitly framed around five-second candles, making it a granular intraday observation rather than a market outlook.
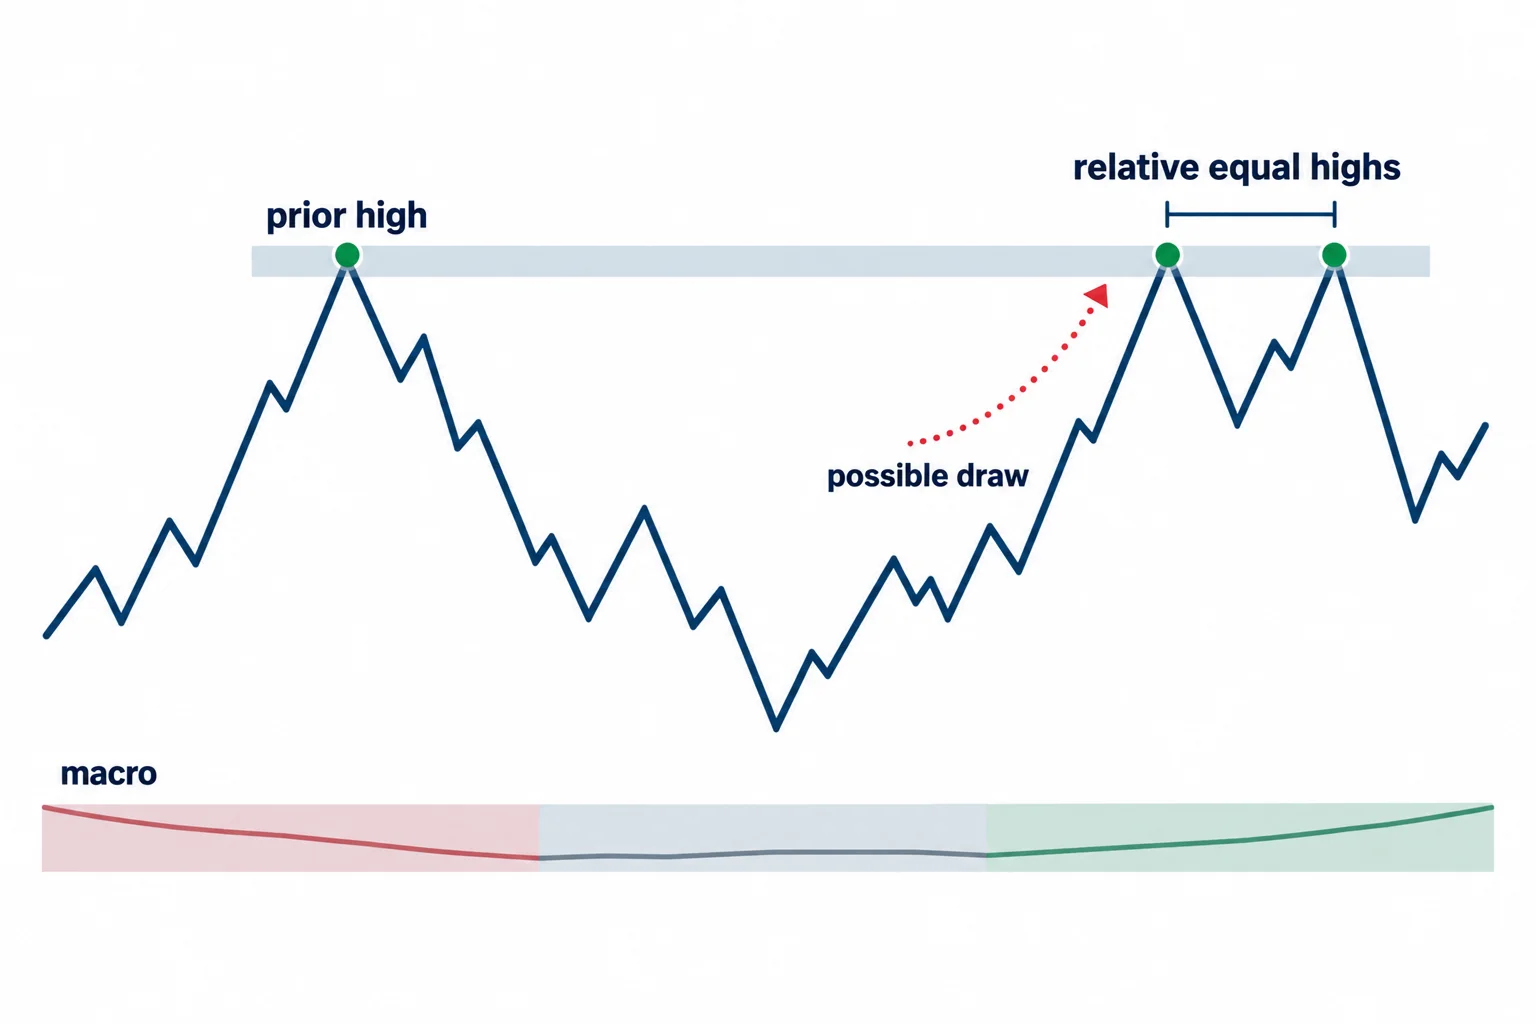
- Proposed draw on price: relative equal highs and a nearby prior high are treated as destinations price is expected to reach and then exceed.
- Timing context: the setup is associated with a 10:50–:10 window he calls a macro, with the time zone and defining rules unstated.
- Management: the narration includes a stop, adding to the position, and later describing risk and costs as covered.
Near the end, at 1:54, ICT says the market offers a pretty good supply of these types of setups throughout the day. The two-minute transcript does not test that assertion or establish how often such patterns resolve as he expects. One detail is worth separating out: the clip’s closing line at 2:04 refers to someone named Robins and has nothing to do with the trade, and the automatic transcription renders it with no other context.
The clip is best read as a compact example of ICT’s own market interpretation rather than proof of a repeatable high-frequency edge or a complete strategy. Nothing in the transcript establishes that the activity shown is institutional high-frequency trading in the technical sense; the title uses that phrase, and the SEC staff report cited below notes the term has no statutory definition.
Watch the ICT Five-Second Scalp Recording
The embedded player above is the same public upload used for every timestamp in this article, so each cited moment can be checked directly against it rather than taken on trust.
ICT Algorithmic Trade Sources
These references support specific points in the discussion above. None of them is an ICT publication, none endorses or tests the approach, and none is offered as evidence for the statements made in the recording.
Why High Frequency Trading Needs Context
The upload is titled as algorithmic high frequency trading, but the SEC’s 2020 staff report to Congress records that the activity “has commonly been called high frequency trading, or ‘HFT,’ though there is no statutory or regulatory definition of this term,” and describes the characteristics usually associated with it as including “the use of extraordinarily high-speed and sophisticated computer programs for generating, routing, and executing orders.”[2] The clip shows a person narrating a discretionary chart read on a five-second timeframe; it demonstrates no exchange co-location, no order-cancellation statistics and no automated execution system, so the title’s label should not be taken as a description of retail high-frequency trading infrastructure.
Why This ICT Trade Result Is Unverified
The clip reports an entry, a stop, an addition and that risk and costs are “covered,” but never states the instrument, prices or size, and 17 CFR 4.41 illustrates why performance-style presentations require care: the regulation’s prescribed statement notes that “these results are based on simulated or hypothetical performance results that have certain inherent limitations.”[4] No such disclosure or performance record appears in the clip, so no fill, no size and no outcome should be inferred from it.
Why Adding to a Five-Second Trade Increases Risk
The narration includes adding to a position while it is running, on a chart where each candle is five seconds wide. The CFTC advises that “two out of three forex customers lose money” and warns that “this high degree of leverage amplifies both gains and losses.”[3] This is general context for leveraged retail trading and says nothing about this speaker, his method or the example in the clip.
Why the ICT Recording Verifies Each Timestamp
The discussion rests entirely on the mapped upload, so the reader’s own control is the embedded player. YouTube’s help documentation states that “you can add a YouTube video or playlist to a website or blog by embedding it.”[5] The upload used here is publicly listed and play-tested rather than assumed to work.
ICT Trade Sources
- [1] Primary source: Algorithmic High Frequency Trading, January 25, 2024 (The Inner Circle Trader)
- [2] SEC Staff Report to Congress on Algorithmic Trading (2020)
- [3] CFTC: Eight Things You Should Know Before Trading Forex
- [4] 17 CFR 4.41: Advertising by commodity pool operators, commodity trading advisors, and the principals thereof
- [5] YouTube Help: Embed videos & playlists
Inversion fair value gap, relative equal highs, buy-side liquidity, the “macro” time window and the claim that a scalp exists every 15 minutes are the speaker’s own framework and terminology. Any ICT, SMC or third-party indicator, script, transcript, note set, spreadsheet or social summary circulating outside the publishing channel’s own upload page is unofficial and untested here, and no independent source was found that validates the method or reports a verified result for it.
Leveraged futures and foreign-exchange trading carries substantial risk, and short-timeframe scalping with additions to an open position changes the distribution of outcomes without removing slippage, spread or the possibility of loss. This article is educational commentary, does not provide individualised financial advice, and reports no outcome from any session or account.
Primary source: Watch the full January 25, 2024 video on YouTube.


