
Key takeaways
In a short clip from the Pattern Recognition series, ICT walks through a bullish Australian-dollar example in which he first calibrates the higher-timeframe reference to the 77.50 level (an old high near 77.49), drops to the 15-minute chart to mark a market structure shift when a short-term high is taken out, measures the bullish impulse…
Read the full summary
In a short clip from the Pattern Recognition series, ICT walks through a bullish Australian-dollar example in which he first calibrates the higher-timeframe reference to the 77.50 level (an old high near 77.49), drops to the 15-minute chart to mark a market structure shift when a short-term high is taken out, measures the bullish impulse from the lowest candle body to the highest candle body, and identifies the 70.5 Optimal Trade Entry retracement at 77.50. He then restores the session kill zones and shows the entry coming in during the New York kill zone, with a stop below the nearby low and upside objectives of 77.95, 78.10 and 78.30. The recording is a retrospective chart explanation by the author; the transcript alone does not establish that any of these levels were reached in a live fill.
How we researched this article
BestProps used document-based research from primary firm sources, checked September 25, 2026. The complete source list, scope, limitations, and commercial-state record appear near the end of this article.
A short clip, a complete pattern
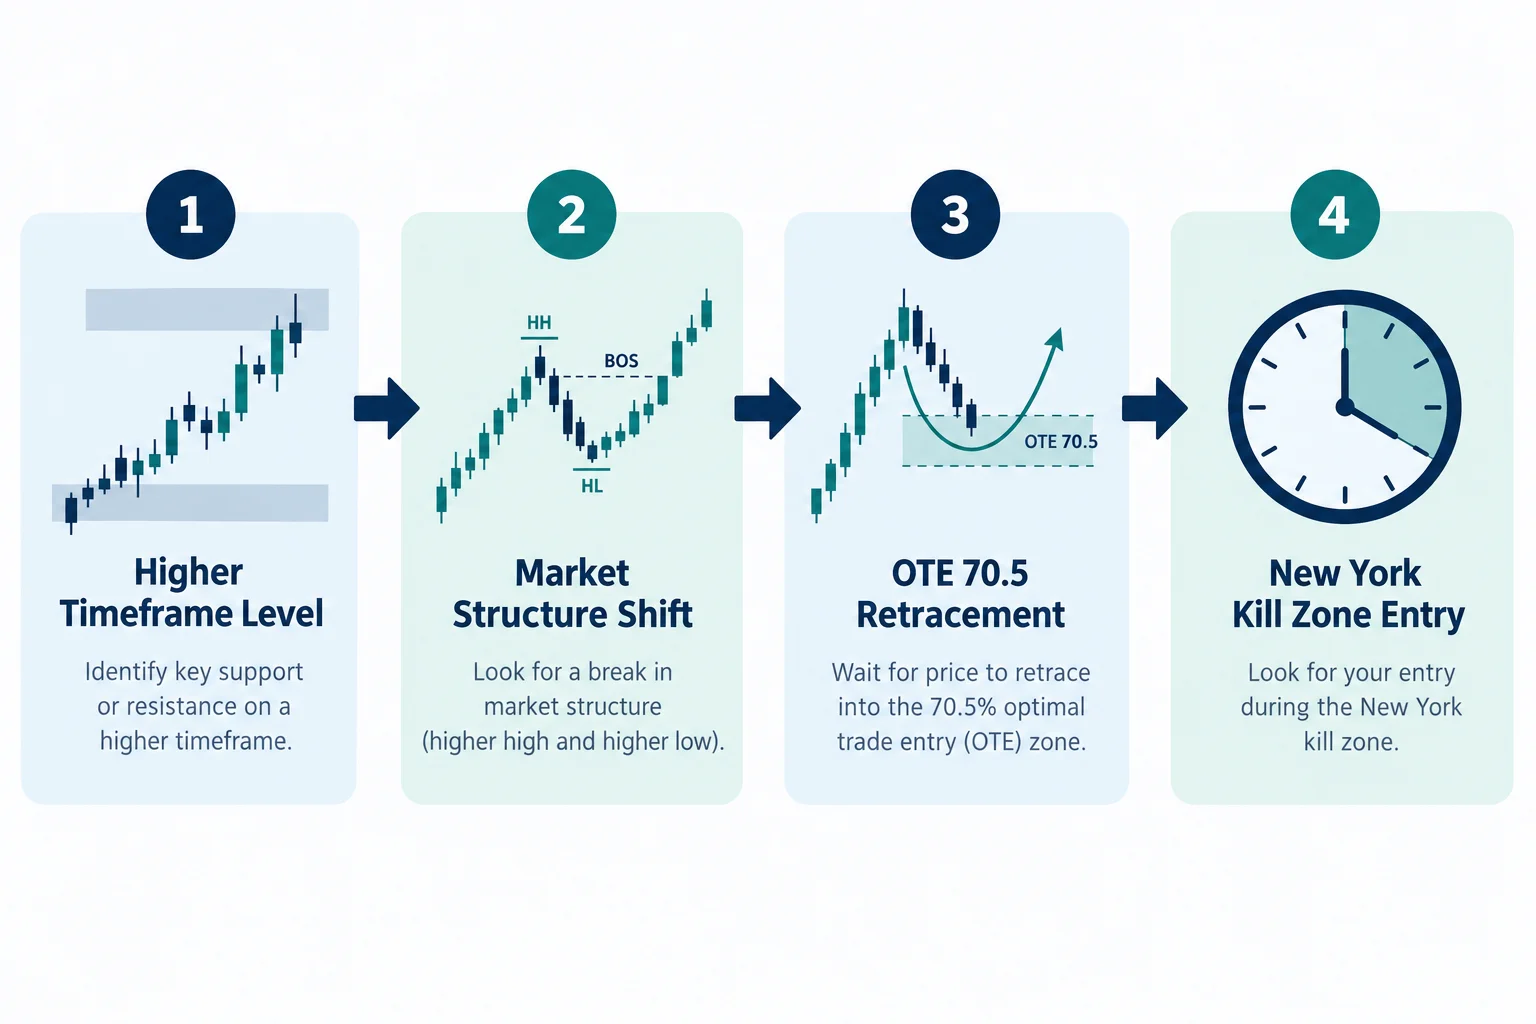
In Pattern Recognition – Aussie OTE NYO, published by The Inner Circle Trader on 9 October 2017 and running about four and a half minutes, ICT demonstrates one bullish pattern-recognition example in the Australian dollar. He combines four elements: a higher-timeframe price level, a lower-timeframe market structure shift, an Optimal Trade Entry retracement, and timing within the New York kill zone.
Start from the higher-timeframe level, not the chart
ICT opens by taking the viewer to an old high, which he cites as 77.49 (0:36). His question is what institutional level price should hit first if it comes down toward that area, and he answers that the 77.50 “50 level” is what he calibrates to (0:41, 0:50). The teaching point is that the analysis begins above the granular chart: he calls the 77.50 calibration a higher-timeframe price level and says not to drop down into the 15-minute timeframe yet (0:57, 1:02).
The market structure shift and the impulse measurement
Moving to the 15-minute view, he highlights the market structure shift: a prior short-term high that has been violated (1:12). Once that high is taken out, he calls it the impulse, and he measures that impulse body to body (1:20). The description supports a body-to-body measurement rather than a wick-to-wick one: he takes a fifth anchor on the lowest body — whichever of the open or close is lower — and drags it to the highest body, again either an open or a close (1:44, 1:50).
The 70.5 OTE and the 77.50 confluence
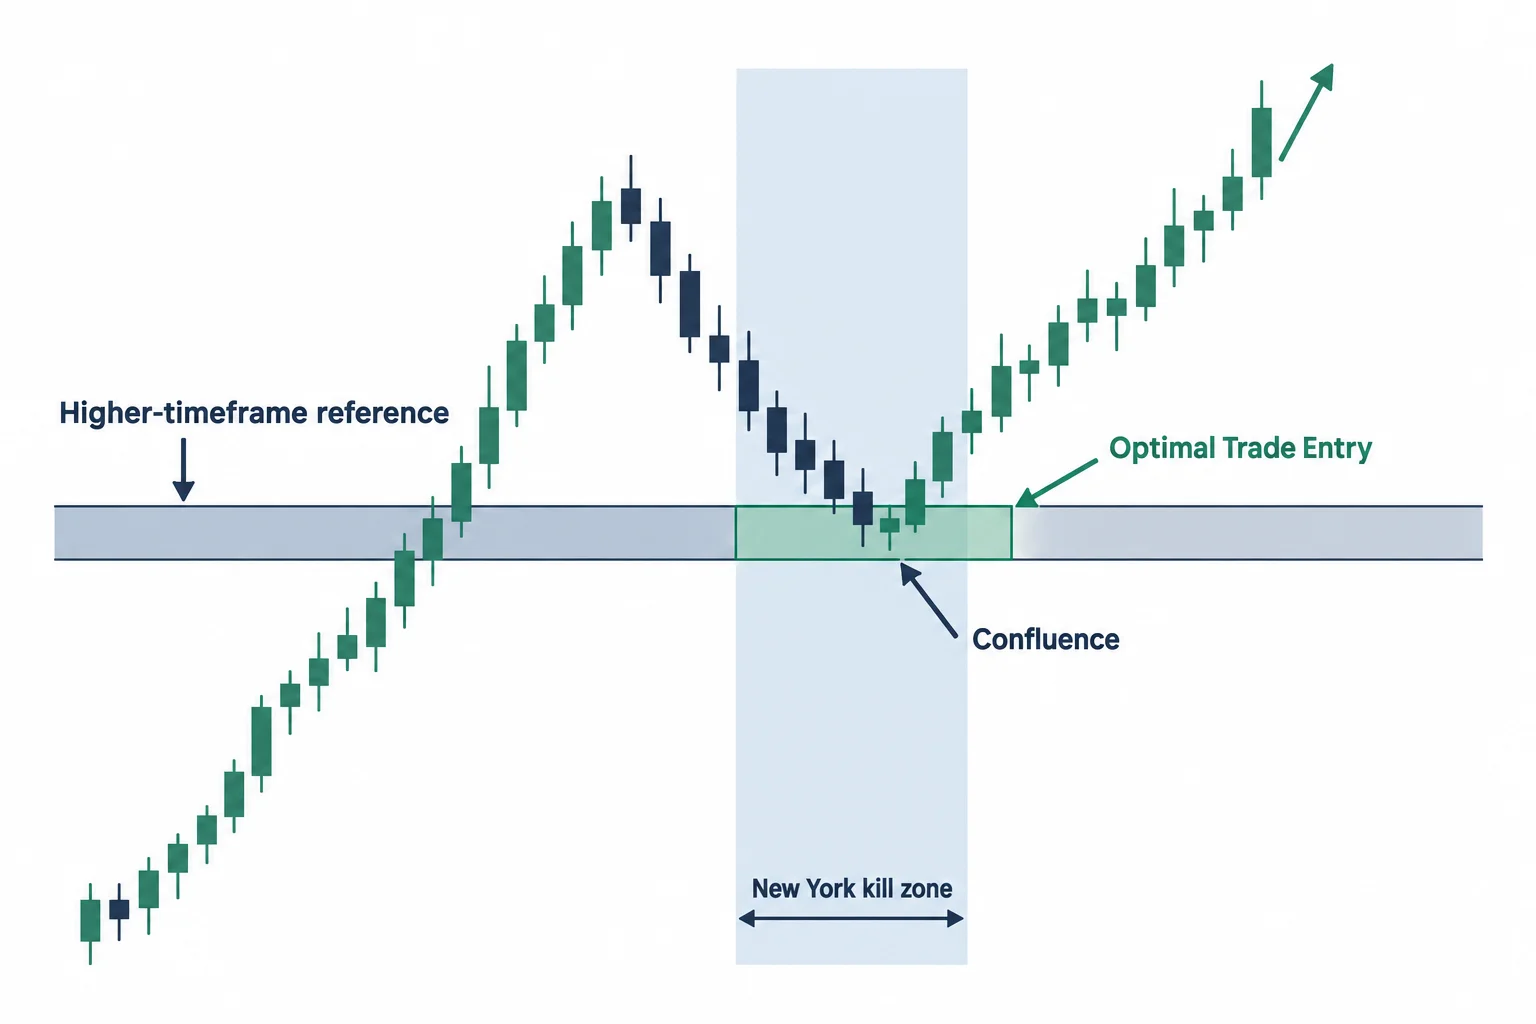
After measuring the impulse, ICT identifies the Optimal Trade Entry at the 70.5 level, and notes that it comes in at 77.50 — the same mid-figure area calibrated from the higher-timeframe chart (2:01, 2:05). This overlap is the crux of the lesson: the lower-timeframe retracement aligns with the higher-timeframe reference, which he calls a very nice mid-figure level (2:07). “OTE” is his label for an Optimal Trade Entry retracement zone; the clip focuses specifically on the 70.5 reading.
He then clears the annotations and adds the session, or kill-zone, overlay so the time of day can be seen (2:40). On that overlay he distinguishes the London and New York kill zones and shows the example entry coming in during the New York window (3:07, 3:14). The title abbreviation “NYO” plausibly stands for New York open, but the spoken track only names the New York kill zone, so that is the point the transcript supports.
Objectives, the stop and the recap
ICT gives upside objectives of 77.95, 78.10 and 78.30, and acknowledges that 78.30 might be ambitious (3:22). He closes by recapping the pattern: a break in market structure off the higher-timeframe 77.50 level, a bounce, a retracement into the optimal trade entry, the kill zone, and entry with a stop below the nearby low, with the expectation of upward expansion (3:47, 4:07).
These are described chart levels and a described stop, narrated over a past chart. No order ticket, position size, fill or account result is reported anywhere in the clip, so none of the outcomes can be treated as a verified real-money result; the transcript also cannot confirm the exact chart coordinates or whether the objectives were later reached.
Practical takeaways
- Fix the higher-timeframe reference before looking at the lower-timeframe pattern. Here it is the 77.50 mid-figure derived from an old high near 77.49.
- Require a market structure shift, not just a level. The setup starts when a short-term high is taken out on the 15-minute chart.
- Measure the impulse body to body, using whichever of the open or close is lower and whichever is higher, rather than wick to wick.
- Look for the OTE retracement to overlap the higher-timeframe reference — 70.5 meeting 77.50 in this case — and time the entry within the relevant kill zone.
- Keep the stop structure explicit. In the example the stop sits below the nearby low and the expectation is upward expansion.
This is an educational summary of the pattern ICT describes in the recording. It is not investment advice, and the clip provides no evidence the method is profitable.
A note on the transcript
The transcript used for this article comes from local automatic speech recognition of the full audio, not from YouTube captions, and it mishears some terms. It renders the OTE level as the “70.5 level” and the reference as “77.50” consistently, and it phrases the measurement as taking a “fifth anchor” on the lowest body and dragging it to the highest body. Terms are normalized where surrounding context supports them; nothing is inferred about real fills, prices reached, or results that the audio does not report.
Watch the original recording
Pattern Recognition – Aussie OTE NYO
The Inner Circle Trader · published 9 October 2017 · about 4 minutes. This recording is the primary source for every timestamp link above.
The recording is not embedded here because the video owner has disabled playback on other websites. That was tested directly on 21 September 2026 from a BestProps page origin at both desktop and mobile widths: the embedded player loads, then reports “Playback on other websites has been disabled by the video owner” with no duration and no playback progress, while the video itself is public and plays normally on YouTube. No empty or half-working player is left on this page.
The watch page was read on 21 September 2026 and is publicly listed as Pattern Recognition – Aussie OTE NYO by The Inner Circle Trader, upload date 9 October 2017, listed duration about 4 minutes 18 seconds, marked public.
Resources
These are the sources checked for this article. The third-party pages are general ICT-reference material; neither one evaluates this speaker, confirms any level, price or fill described above, nor endorses anything said in the recording. Any ICT indicator, script, note set or re-upload circulating outside the publishing channel’s own page is unofficial and has not been tested here.
- [1] Pattern Recognition – Aussie OTE NYO — The Inner Circle Trader (primary source; watch page read 21 September 2026, listed duration about 4 minutes 18 seconds, public).
- [2] The Inner Circle Trader — official YouTube channel (read 21 September 2026) — the publishing channel for the recording used here.
- [3] Quantum Algo — The Optimal Trade Entry (OTE): Fibonacci Meets SMC (read 21 September 2026) — third-party explanation of the OTE concept as a retracement zone; independent of this recording and untested here.
- [4] ICT Kill Zone — ICT Liquidity Explained (read 21 September 2026) — third-party reference covering liquidity and kill-zone concepts; independent of this recording and untested here.
Source: ICT, Pattern Recognition – Aussie OTE NYO, The Inner Circle Trader, 9 October 2017. Local automatic speech recognition of the full audio was the transcript used for this article; several terms the track mishears are noted above. This commentary is educational and is not investment advice.


