
How we researched this article
BestProps used document-based research from primary firm sources, checked September 25, 2026. The complete source list, scope, limitations, and commercial-state record appear near the end of this article.
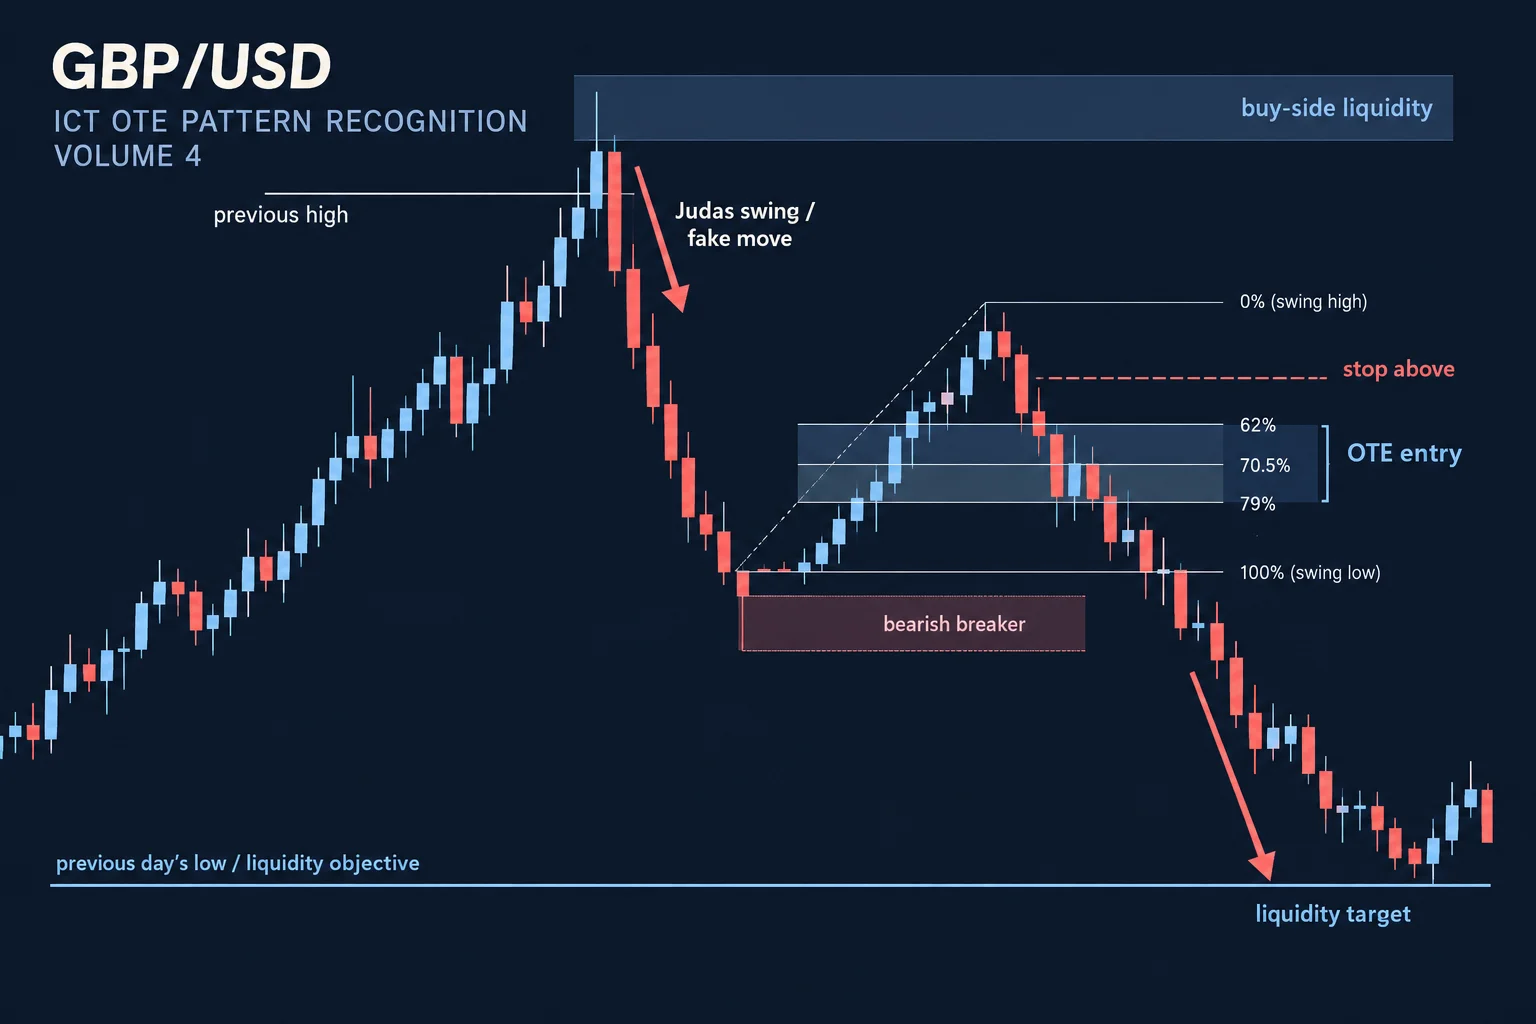
In OTE Pattern Recognition Series – Vol. 04, ICT presents a GBP/USD example intended to show how he identifies an optimal trade entry (OTE) in what he characterizes as a trendless market. Rather than beginning with a firm daily directional bias, he uses an hourly structure to form a bearish narrative and then moves to a five-minute chart to illustrate two retracement-based setups.
The lesson is based on a May 12, 2020 GBP/USD chart shown in the video. The captions do not reveal every price, candle, or chart annotation clearly, so this explanation focuses on the sequence ICT describes rather than attempting to reconstruct an unseen trading record.
The premise: intraday volatility without a daily bias
ICT introduces the example as a market that is not displaying a decisive trend and says the setup is therefore not dependent on a specific daily bias. His objective is to use intraday volatility and lower-time-frame structure to locate an OTE. This framing begins at 0:19.
He contrasts his method with marking every prior high or low as conventional support or resistance. According to ICT, a level becomes more meaningful when it fits a narrative about liquidity, a false move, and the subsequent change in price behavior. This is his interpretation of market action, not proof that ordinary support-and-resistance analysis is ineffective.
From buy-side liquidity to a bearish breaker
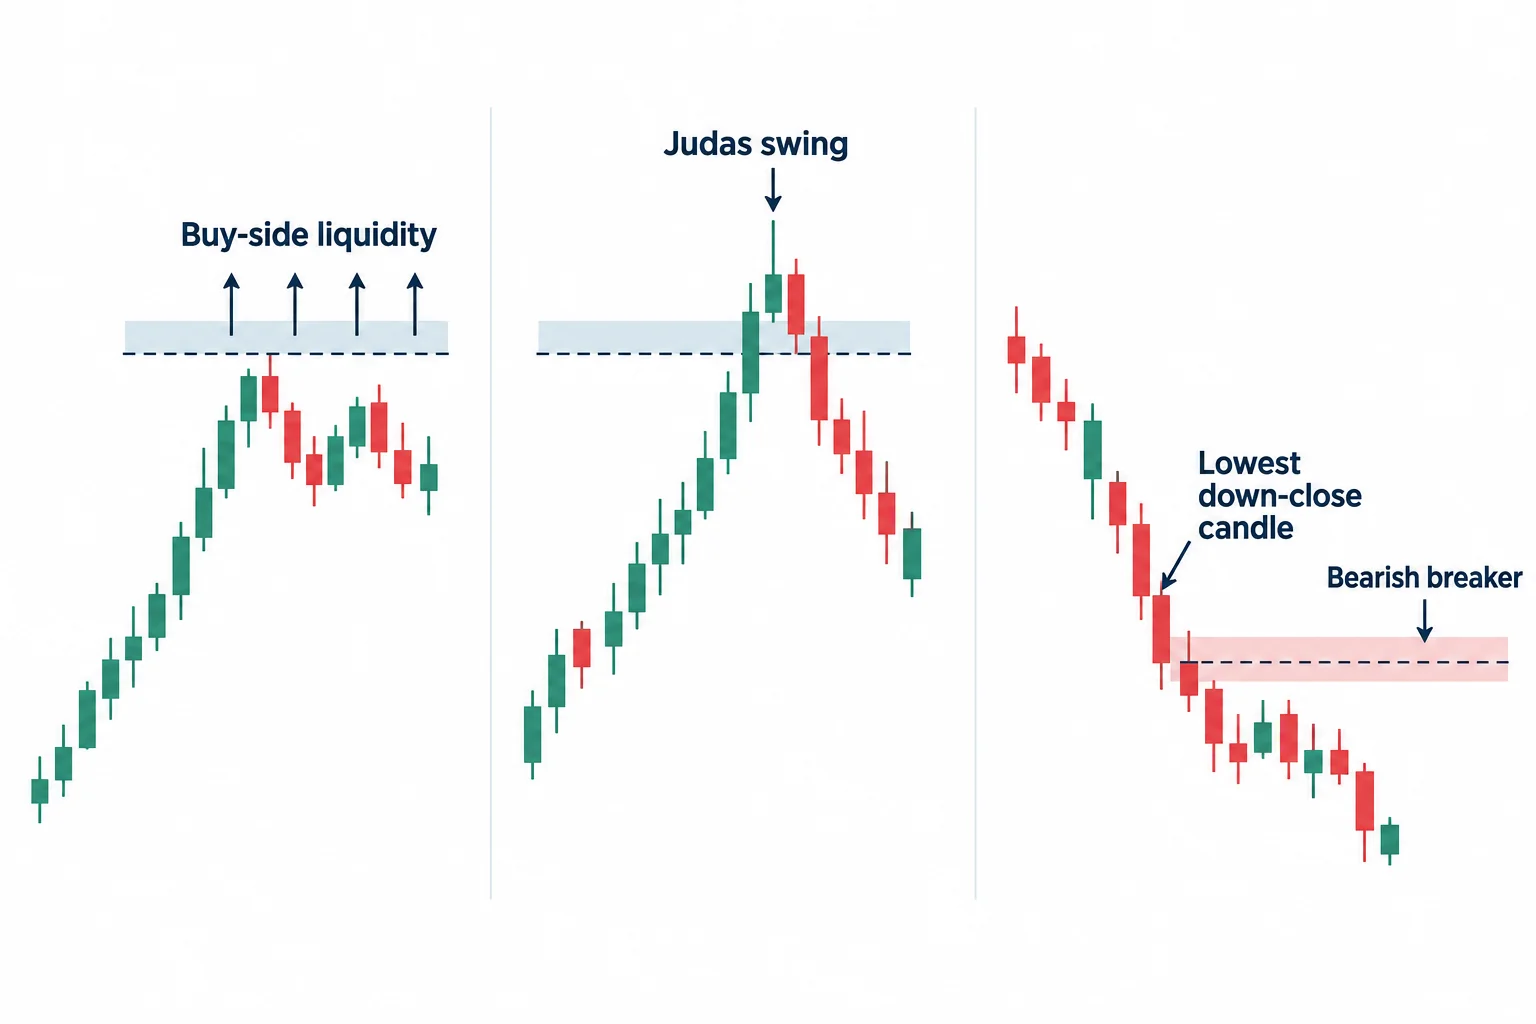
At 2:09, ICT introduces what he calls the “market efficiency paradigm.” In this lesson, that means forming an explanation for three questions:
- Why is price moving toward a particular area?
- Why might price react after reaching it?
- Which liquidity pool could become the next objective?
He identifies an old high and reasons that buy stops may rest above it. Those orders could represent long-entry stops or protective stops belonging to short positions. Price then moves through the high. ICT labels this sharp move a “Judas swing,” meaning a move that appears bullish but may instead be a false expansion through buy-side liquidity.
The bearish confirmation in his framework occurs when price returns below what he calls the lowest down-close candle. He extends that candle’s level forward and treats it as a bearish breaker. The relevant explanation starts around 2:49. This breaker supplies the higher-time-frame context for the later five-minute OTE examples.
Establishing the downside objective
Before changing time frames, ICT marks the previous day’s range on the hourly chart. Because he has interpreted the breaker as bearish, he selects the previous day’s low—and the liquidity presumed to be resting beneath it—as the principal objective. He explains that targeting logic at 4:13.
This order of analysis is central to the lesson. The Fibonacci retracement is not presented as a standalone signal. First comes the liquidity event above an old high, then the bearish structural interpretation, followed by a downside objective. Only after those elements are in place does ICT use a retracement range to refine an entry area.
The first five-minute OTE example
At 4:51, the video changes to a five-minute GBP/USD chart dated May 12, 2020. ICT says price trades back into the hourly breaker area and revisits the level associated with an old high.
He then draws a Fibonacci range from a high to a low and highlights a return to the OTE region. In this particular illustration, he says the 79% retracement aligns with the breaker level. He places the conceptual protective stop above the referenced high and looks beneath an old low for liquidity.
ICT explicitly says that “the magic is not the fib.” His point is that the retracement percentage should be read within the surrounding narrative rather than treated as a mechanically predictive ratio. The presumed liquidity below the old low provides the reason for the objective; the Fibonacci measurement helps describe the retracement into the proposed entry area.
A second retracement during the New York session
The previous day’s low had not yet been taken when another retracement began at approximately 11:00 a.m. on the chart. ICT considers that time to be within his New York-session window and therefore evaluates a second setup. This discussion begins at 6:08.
For this example, he describes a short-entry area near the 62% retracement, with a stop above the referenced swing and the May 11 low as the next liquidity objective. He favors a rounded objective below that prior-day low rather than requiring price to reach the full Fibonacci extension. This illustrates a practical principle in his presentation: choose an objective that accesses the anticipated liquidity without demanding the most extreme projected level.
ICT then shows the chart moving below the May 11 low and expanding lower, which he presents as the result of the example at 7:28. The transcript supports that this movement appears in his displayed chart, but it does not establish actual trade execution, fills, costs, or independently verified performance.
A practical pattern-recognition checklist
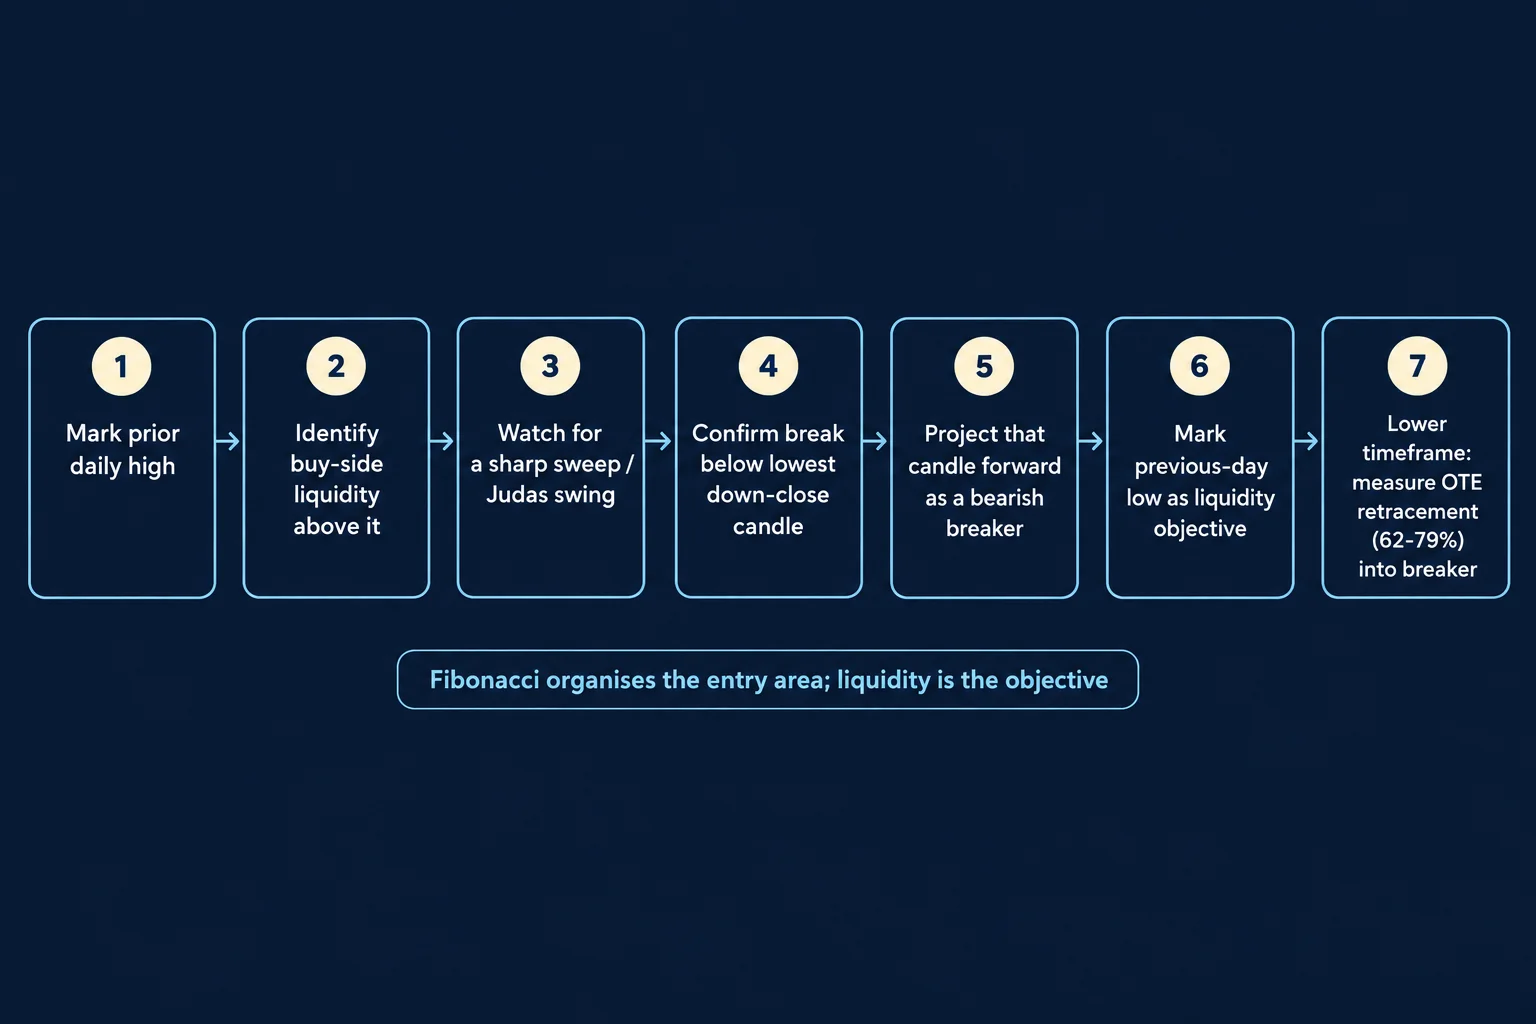
As a general educational summary—not a claim that the pattern predicts future prices—the workflow demonstrated in the video is:
- Identify a prior high with potential buy-side liquidity above it.
- Watch for a sharp move through that high.
- Look for the bearish structural condition ICT describes after the sweep.
- Extend the relevant candle as a prospective bearish breaker.
- Mark a logical downside liquidity objective, such as the previous day’s low.
- Move to a lower time frame and measure the retracement into the OTE area.
- Keep the target tied to the liquidity narrative rather than relying solely on a Fibonacci extension.
The main teaching is therefore not simply “sell at a Fibonacci percentage.” ICT presents OTE as one component of a broader sequence involving a liquidity sweep, a bearish breaker, a lower-time-frame retracement, and a defined liquidity objective. These are ICT’s market interpretations and terminology; the video does not provide statistical testing or a general profitability demonstration.
Additional Resources
- OTE Pattern Recognition Series – Vol. 04 (YouTube) — Primary video source for this article.
- Fibonacci Retracement Levels Explained (BabyPips) — General reference for the 62%, 70.5%, 79% retracement ratios mentioned in the lesson.
- Liquidity Definition (Investopedia) — Background on buy-side/sell-side liquidity concepts used in ICT’s framework.
- GBP/USD Trading Ideas (TradingView) — Community charts and discussion for the GBP/USD pair.


