
Key takeaways
Inner Circle Trader at https://innercircletrader.com/ teaches a top-down crude oil OTE model that uses a daily price gap and prior high as bullish liquidity objectives, then waits on the five-minute chart for a sharp rally and pullback to the 62% retracement between eight thirty a.m.
Read the full summary
Inner Circle Trader at https://innercircletrader.com/ teaches a top-down crude oil OTE model that uses a daily price gap and prior high as bullish liquidity objectives, then waits on the five-minute chart for a sharp rally and pullback to the 62% retracement between eight thirty a.m. and eleven a.m. The May 28, 2020 example requires both price and timing alignment, otherwise no trade is taken. Management places invalidation below the setup, targets an old high and standard-deviation projections, closes roughly 80% at the two-standard-deviation objective, and retains a 20% leader for possible continuation toward the higher daily level. The gap is treated as a potential magnet rather than a guaranteed fill, and projected prices, fills, rewards, commissions, slippage, and margin were not independently verified from the generated captions.
How we researched this article
BestProps used document-based research from primary firm sources, checked September 25, 2026. The complete source list, scope, limitations, and commercial-state record appear near the end of this article.
In OTE Pattern Recognition Series – Vol., ICT presents a crude-oil example intended to connect higher-timeframe directional bias with a lower-timeframe Optimal Trade Entry, or OTE. The lesson moves from a daily chart to a five-minute chart and explains how ICT would frame a bullish scenario, wait for a retracement during a defined morning window, and manage an intraday position around projected objectives.
The example concerns market conditions identified in the video as Thursday, May 28, 2020. That is the chart session discussed, while the video’s listed upload date is May 30, 2020. Because the source consists of generated captions rather than the chart itself, the discussion below summarizes ICT’s stated interpretation without independently validating plotted levels, fills, or later market behavior.
ICT Crude Oil Bias From the Daily Gap
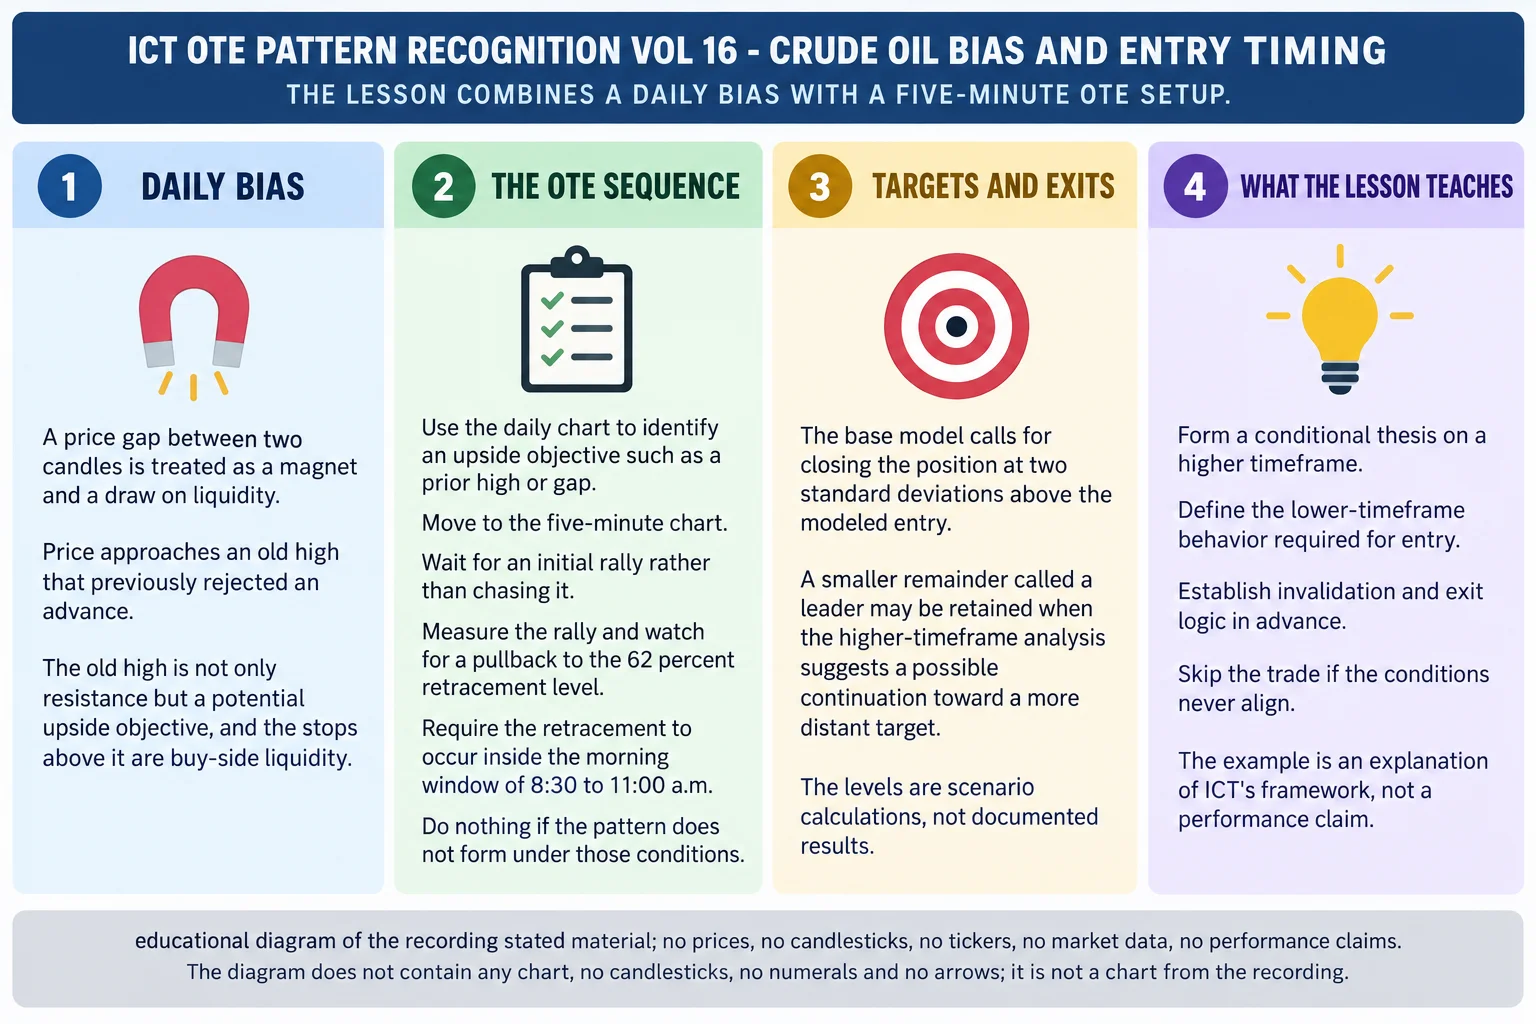
ICT begins with the daily crude-oil chart and asks viewers to inspect the price action before seeing his annotations. At 1:03, he directs attention to a gap above the market. He characterizes that untraded area as a potential “magnet” and a reason price might continue moving upward.
His argument contrasts that upside objective with a conventional resistance reading. An earlier high had previously preceded a decline, so traders might expect the same level to reject price again. ICT instead interprets stops and other orders around old highs as potential liquidity. In his framework, an apparent resistance level may therefore become an objective rather than a reason to assume an immediate reversal.
At 3:49, ICT defines the visible gap as the space between the low of one candle and the high of another, with no intervening trading shown in that area. He uses the possibility of price revisiting it to support a bullish daily bias. This is ICT’s market interpretation, not a demonstrated rule that every gap must be filled.
ICT OTE Entry Setup From Crude Oil Bias
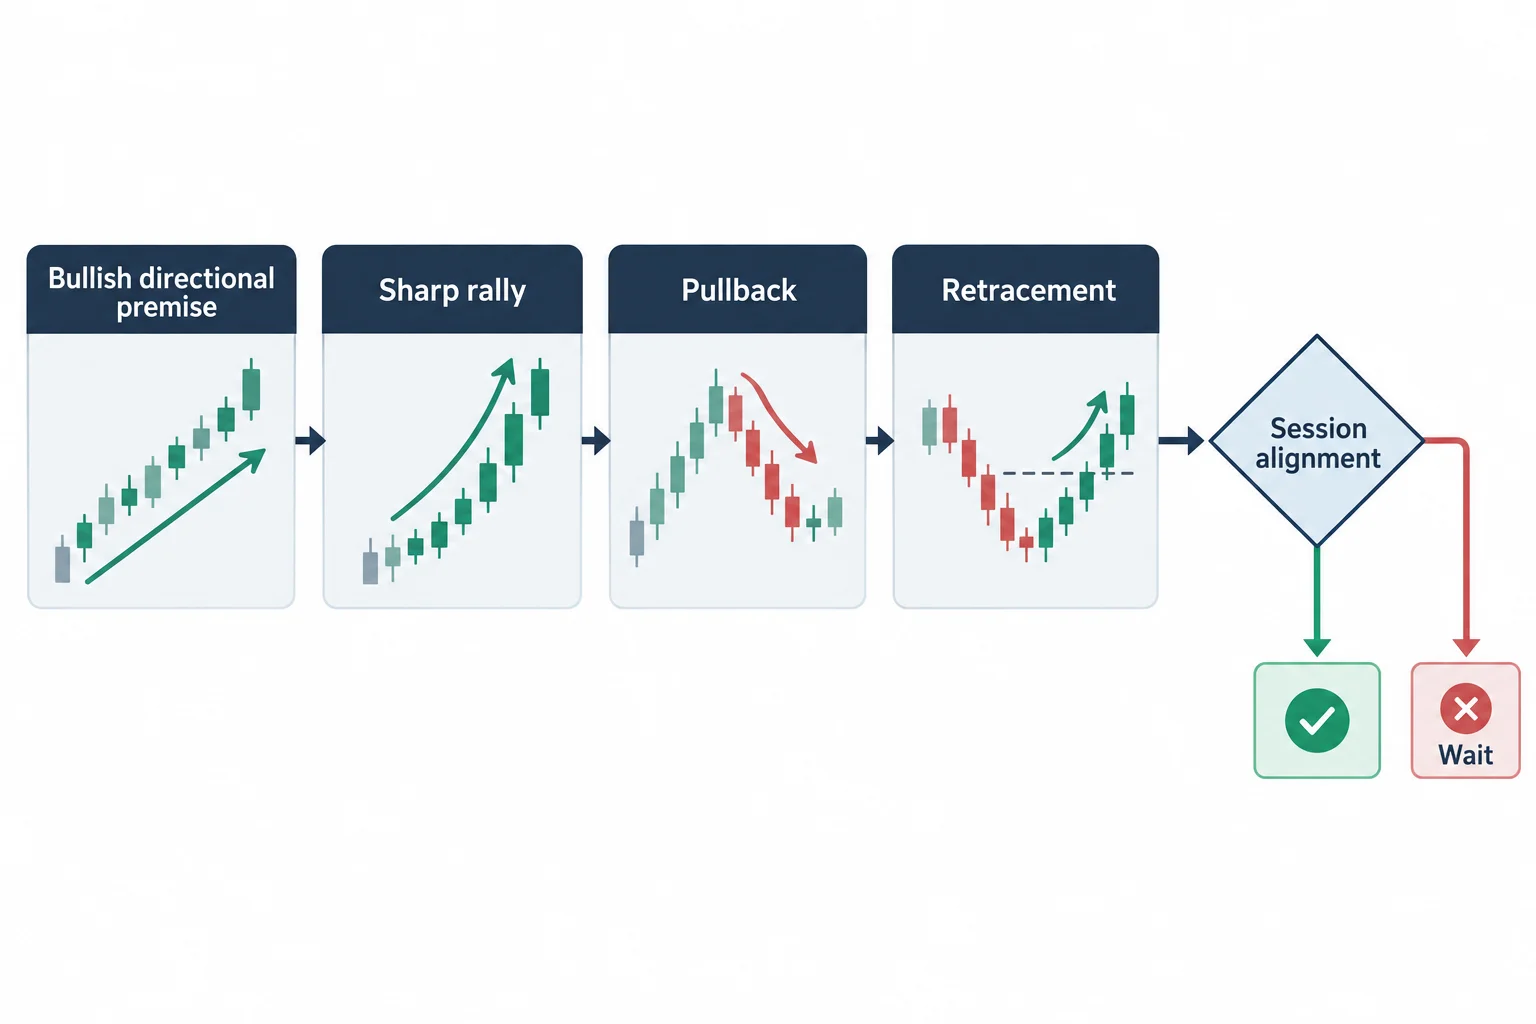
The higher-timeframe idea does not, by itself, provide the entry. ICT next lays out the intraday pattern he wants to see:
- A bullish directional premise based on the daily chart.
- A sharp rally during the relevant session.
- A subsequent pullback rather than an entry made by chasing the rally.
- A retracement to the 62% level of the selected price swing.
- Formation of that setup between 8:30 a.m. and 11:00 a.m., as specified in the lesson.
ICT explains this sequence at 5:38. He says that if the pattern does not appear during the stated window, the response under this model is to do nothing and wait for another session or market. The educational point is selectivity: a directional opinion and a retracement are not sufficient unless the model’s time and price conditions align.
Five-Minute Crude Oil OTE Entry Example
At 6:35, the lesson shifts to a five-minute chart. ICT identifies the prior daily high and a higher daily level, then describes price clearing a short-term high and pulling back during the morning window. He treats that retracement as the hypothetical OTE entry.
The captions include several precise prices, tick counts, dollar amounts, and standard-deviation objectives. However, one purported entry price is garbled by automatic transcription, and the unseen chart is necessary to interpret some of those figures reliably. The defensible takeaway is the structure rather than the exact arithmetic: ICT describes a stop below the setup, an initial objective near an old high, and additional objectives based on standard-deviation projections.
These figures are presented in the video as hypothetical contract-level examples. The transcript does not establish that a live order was submitted or filled, nor does it account for commissions, slippage, margin, or other execution considerations.
ICT OTE Partials and the Leader Position
ICT’s default management rule in this lesson is to reduce the position at the two-standard-deviation objective. At 8:53, he adds a variation for cases where the daily chart suggests a more distant target may remain relevant.
He calls the retained portion a “leader”: a small remainder of the original hypothetical position left open after most of it has been closed. In this example, he discusses taking off roughly 80% and retaining approximately 20% for possible continuation toward the higher daily level. This is the speaker’s model-specific management approach, not a general recommendation or assurance that the extended target will be reached.
ICT OTE Pattern Lessons for Crude Oil Traders
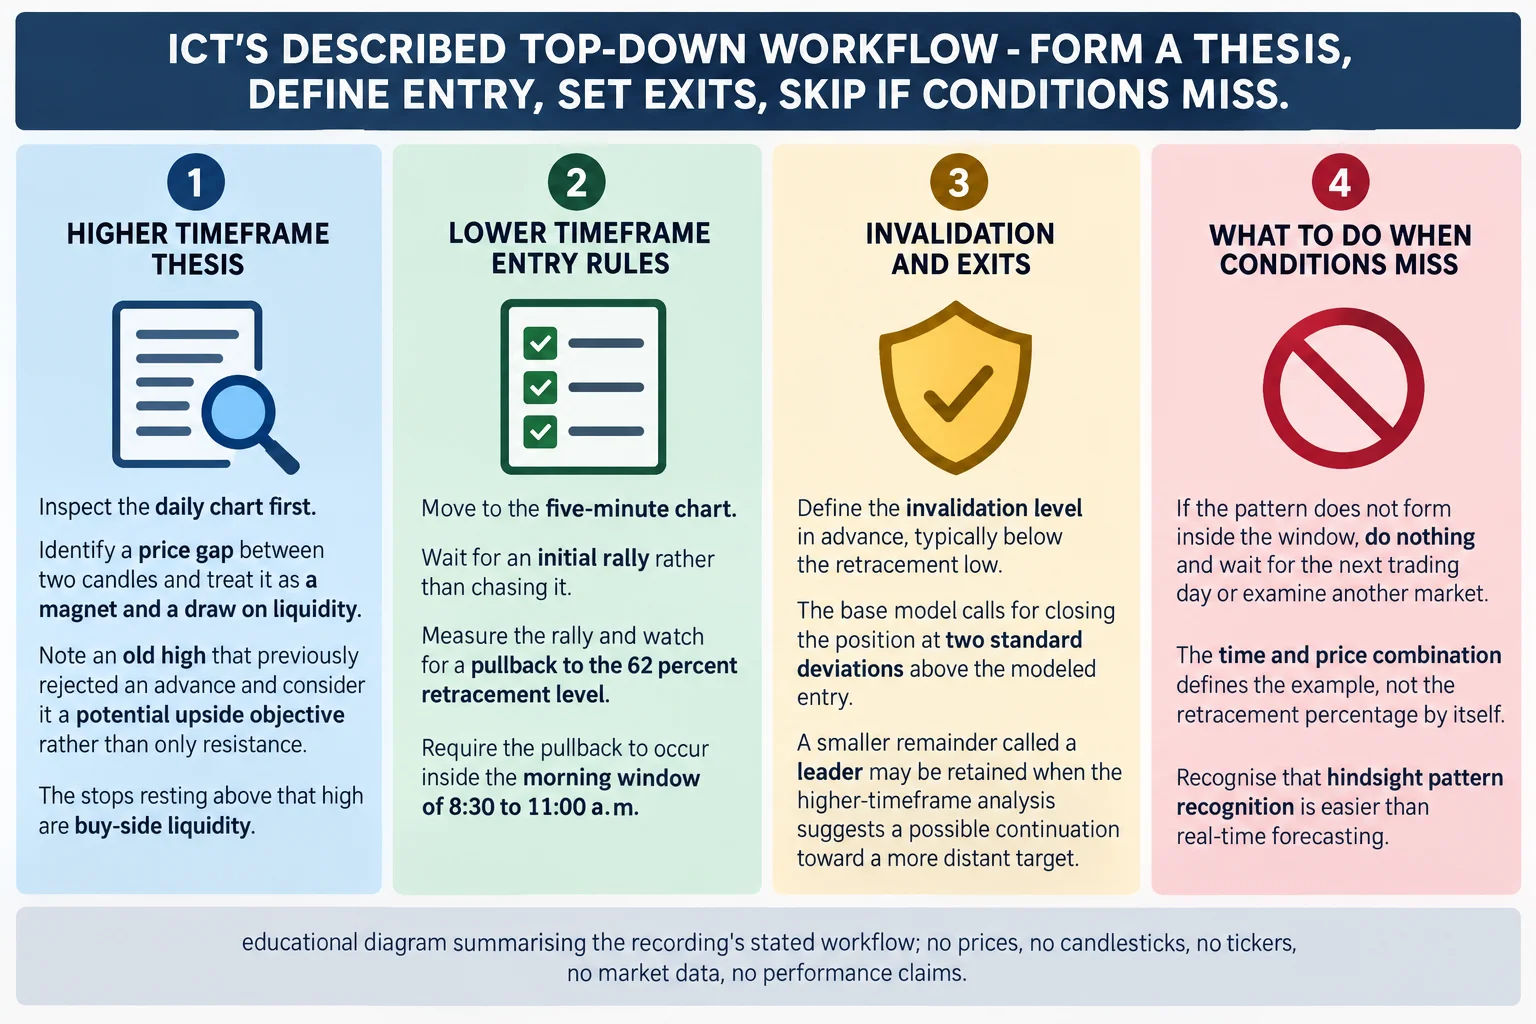
The broader lesson is a top-down decision process:
- Identify a higher-timeframe objective that could provide directional context.
- Determine whether the prior day’s high or low is the more relevant intraday draw under the model.
- Wait for a defined lower-timeframe pattern during a limited session window.
- Avoid chasing the initial move; require the planned retracement.
- Use predetermined partial-exit areas while separating the core objective from any optional continuation portion.
Near 11:29, ICT emphasizes that the gap-based objective need not be reached on the next Monday or Tuesday. He presents it as a broader upside draw that may help frame subsequent daily bias. That qualification matters: the concept supplies a scenario, not a fixed timetable.
Volume 16 is therefore less about recognizing an isolated Fibonacci retracement and more about combining context, timing, price structure, and management. Anyone studying the example should compare the narration with the original chart and treat its projected outcome and reward calculations as hypothetical. This material is educational and is not investment advice or a promise of trading performance.
ICT OTE Volume 16 Video and References
Primary video: ICT OTE Pattern Recognition Series Volume 16 – Crude Oil Bias and Entry Timing (YouTube)
- Inner Circle Trader website – ICT concepts overview – reference for ICT terminology including gap magnets, liquidity draws, and OTE definitions. https://innercircletrader.com/
- Crude Oil (CL) futures contract specifications – CME Group reference for tick size, point value, and margin requirements discussed in the video’s hypothetical examples. https://www.cmegroup.com/markets/energy/crude-oil/light-sweet-crude.html
Disclaimer: This article summarizes a publicly available educational video. It does not constitute investment advice, a trading recommendation, or a representation that any hypothetical outcome shown in the video would recur. All prices, levels, and reward calculations discussed are the speaker’s stated model illustrations, not verified trade results.


