Home » News » ICT Institutional Price Action With Micro Market Structure Part 2
ICT Institutional Price Action With Micro Market Structure Part 2
ICT’s Part 2 lesson combines higher-timeframe order-block context with session timing, five-minute displacement and prior highs or lows as liquidity objectives.
BPBestProps Research Team
Document-based research and editorial review.
Last reviewed September 25, 2026
7 min read
Key takeaways
ICT applies his order-block framework to the December 2020 E-mini S&P futures contract, using a daily bearish premise and five-minute confirmation through session timing, displacement, retracement and liquidity targets.
Read the full summary
ICT applies his order-block framework to the December 2020 E-mini S&P futures contract, using a daily bearish premise and five-minute confirmation through session timing, displacement, retracement and liquidity targets. The daily reference is an up-close candle classified as a bearish order block with a 3256.5 low, while the five-minute London open kill zone runs from 2 a.m. to 5 a.m. Eastern Standard Time. ICT waits for bearish displacement, identifies a lower-timeframe up-close candle as a bearish order block, and cites 3243.00 as both its low and a later retracement high, with an old low and presumed sell-side liquidity as the objective. A Fibonacci projection gives 3207.00 and the displayed candle reportedly reaches 3206.50, after which the bias is reassessed toward nearby highs and relative equal highs as buy-side liquidity rather than remaining bearish all day. The method prioritizes higher-timeframe direction, a defined intraday window, displacement away from the reference level, retracement into a newly formed order block and prior highs or lows as targets, without requiring entry at the higher-timeframe block itself. ICT recommends a stop loss and a time stop that closes an unproductive London setup when its window ends. Other stated Eastern Standard Time windows are New York from 7 a.m. to 9 a.m., broader New York from 8 thirty a.m. to 11 a.m., London close from 10 a.m. to noon, Asia from 7 p.m. to 9 p.m. and late New York equities from 1 p.m. to 4 p.m. The article cautions that these are ICT-specific interpretations, the transcript cannot verify chart markings, fills or results, and the lesson is not independent evidence of profitability.
How we researched this article
BestProps used document-based research from primary firm sources, checked September 25, 2026. The complete source list, scope, limitations, and commercial-state record appear near the end of this article.
What ICT Institutional Price Action Teaches in Part 2
In ICT Institutional Price Action: Micro-Market Structure & Time & Price Concepts Part 02, ICT expands on his order-block framework using the December 2020 E-mini S&P futures contract. He moves from a daily-chart reference level to a five-minute example and explains how he combines higher-timeframe direction, session timing, displacement and liquidity targets.
This is a description of ICT’s interpretation of price action, not independent proof that markets follow the proposed mechanism. The transcript also cannot verify the chart markings, trade execution or results visible in the recording.
Higher Timeframe Context for ICT Price Action
At 00:55, ICT asks viewers to establish the direction of the daily chart before studying very low timeframes. He rejects the idea that lower-timeframe movement is merely “noise,” reasoning that each chart represents the same underlying prices sampled at different intervals. Nevertheless, he warns that a one- or five-minute chart is useful only when the trader knows what condition to seek.
His example begins with a daily up-close candle that he classifies as a bearish order block. The transcript identifies its low as 3256.5. Because ICT reads the broader delivery as bearish, he treats that level as context for looking lower rather than as an automatic entry. His practical point is important within his own framework: a higher-timeframe level supplies a directional premise, while lower-timeframe behavior must confirm whether price is moving away from it.
How Time Guides ICT Price Action
After changing to a five-minute chart, ICT introduces the central lesson at 05:28: he prioritizes “time and price,” rather than price in isolation. He describes a “macro” as a short sequence that, in his model, directs price toward either liquidity or an inefficiently delivered area that may be rebalanced.
ICT divides liquidity into two broad categories:
Buy-side liquidity: orders presumed to rest above prior highs.
Sell-side liquidity: orders presumed to rest below prior lows.
He also discusses imbalances or inefficiencies, areas where price moved quickly and which, under his theory, may later be revisited. These are ICT-specific market interpretations and should not be mistaken for directly observable institutional orders.
ICT Price Action in the London Session
At 07:03, ICT focuses on what he calls the London open kill zone, stated in the video as 2:00 a.m. to 5:00 a.m. Eastern Standard Time. With the daily premise already bearish, he looks for a decisive five-minute move lower during that window.
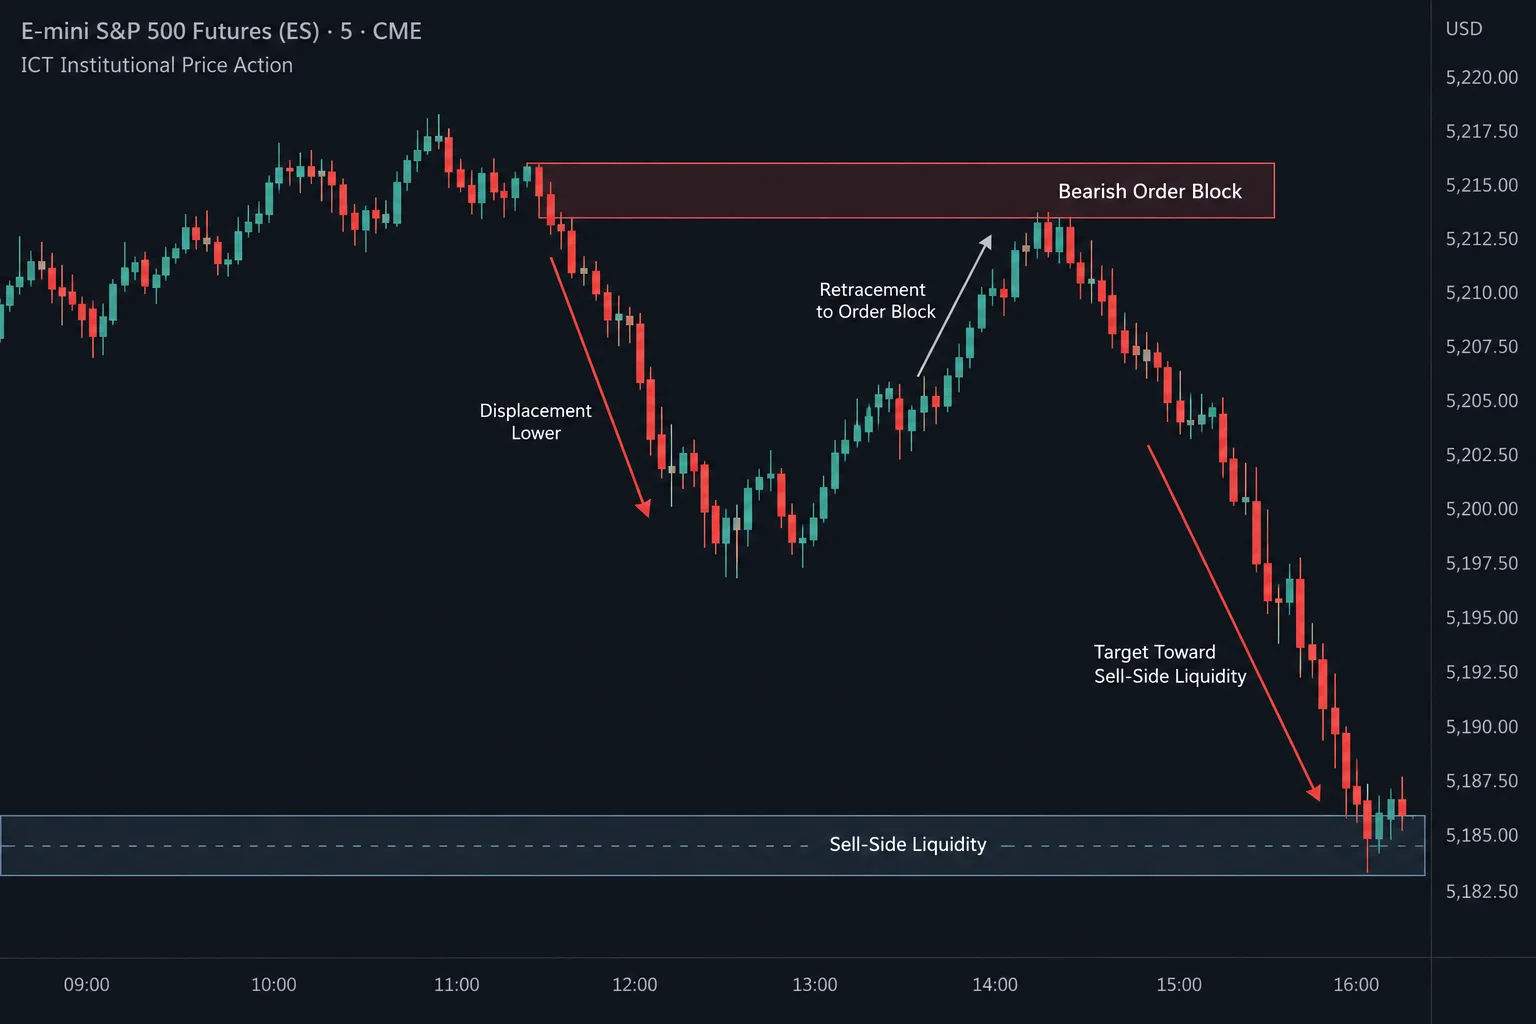
He calls this movement displacement: price should drive away from the higher-timeframe level rather than drift sideways. Once that bearish displacement appears, he identifies an up-close candle in the lower-timeframe sequence as a bearish order block. The narrated example says the low of that candle and the high of a later retracement both printed at 3243.00. That exact match is ICT’s reading of the chart; the transcript alone cannot independently confirm the displayed prices.
The resulting sequence is:
Form a directional premise from the daily or four-hour chart.
Wait for a specified intraday time window.
Look for displacement away from the higher-timeframe or
Stylized diagram of the ICT order block framework described in the lecture. ICT’s framework is his own interpretation; the recording does not independently verify chart markings, fills or results.
der block.
Use a newly formed lower-timeframe order block as a possible retracement area.
Identify an old low as the prospective sell-side liquidity objective.
At 18:08, ICT emphasizes that an entry need not occur at the higher-timeframe order block itself. In his model, evidence that price is moving away from the level can matter more than touching it precisely.
Liquidity Targets in ICT Market Structure
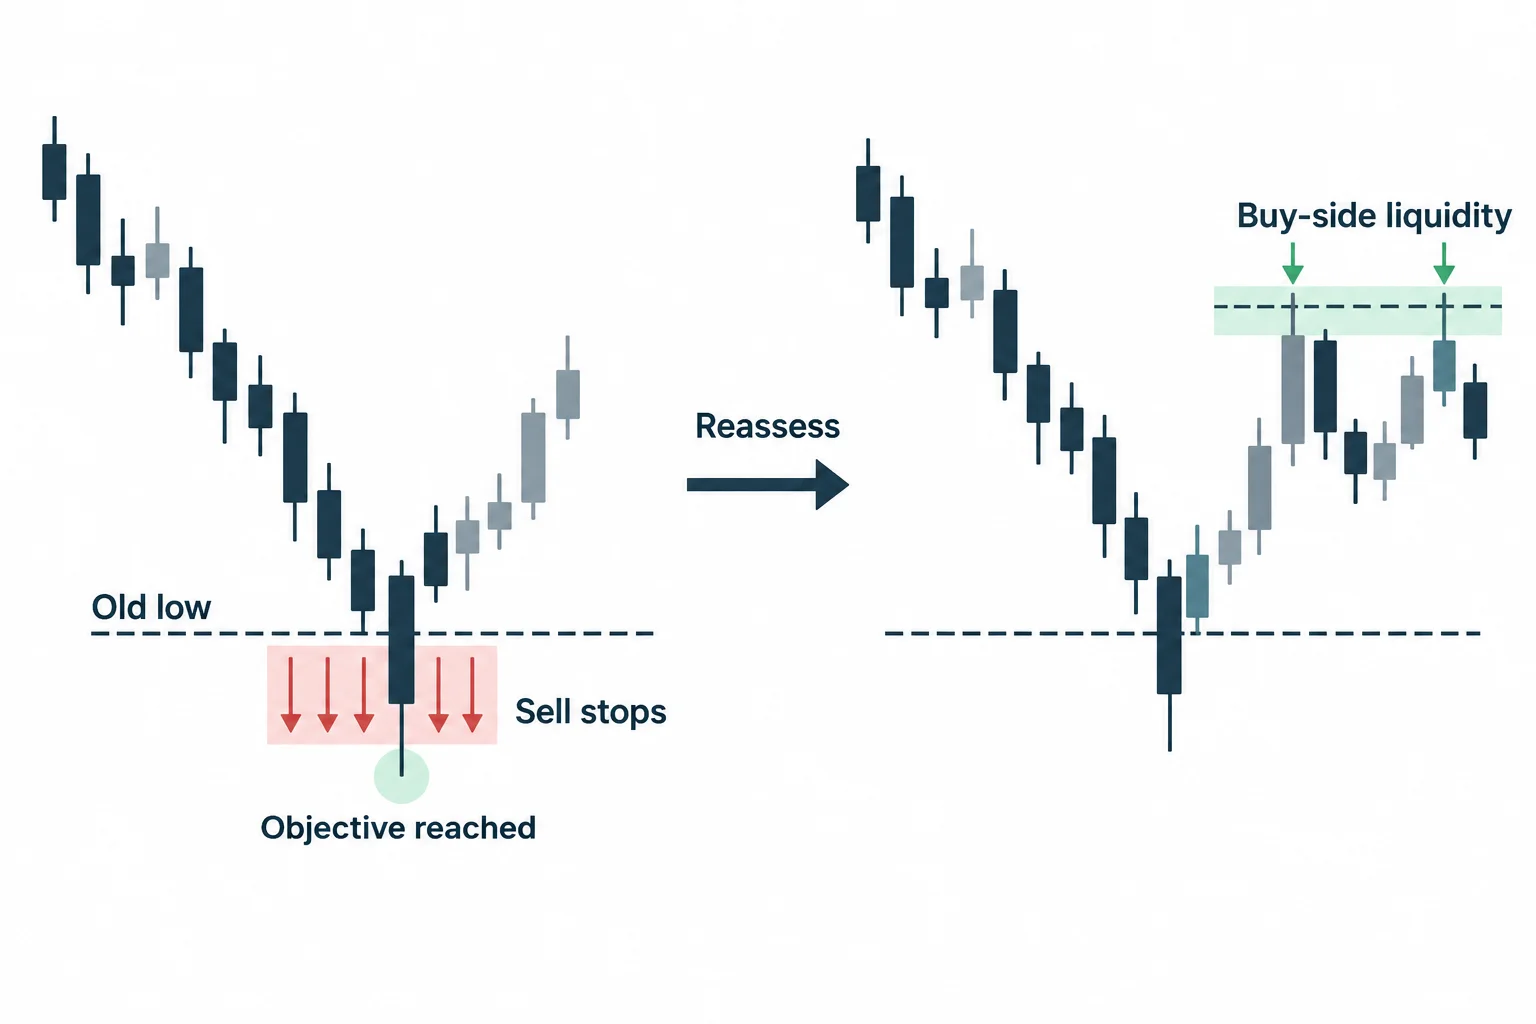
The diagram illustrates sell stops within this section’s framework. Educational illustration, not a price chart.
ICT contrasts his framework with treating an old low purely as support. At 19:39, he instead presents the low (and the sell stops he assumes are below it) as a downside objective. He applies a Fibonacci retracement and extension to the narrated move, discussing 3243.00 as the retracement level and 3207.00 as a projected downside level. He reports that the displayed candle reached 3206.50.
Later, after the old low is taken, ICT says his intraday interpretation changes. He then looks for nearby highs and relative equal highs as possible buy-side liquidity. The lesson is therefore not simply “remain bearish all day.” It is to reassess after the stated objective has been met. ICT narrates a later move through highs, but a transcript cannot establish unseen fills, whether an actionable setup existed or what any trader’s outcome would have been.
Risk and Exits in ICT Price Action
Despite making strong claims about precision, ICT explicitly acknowledges risk. At 11:56, he argues for using a stop loss rather than trading without a defined defense. Near 31:24, he says losing trades remain inevitable and introduces a time stop: if a London setup has not progressed by the end of its window, he suggests closing it and waiting for another session rather than holding indefinitely.
The session windows stated near 33:07 are:
London open: 2:00–5:00 a.m.
New York: 7:00–9:00 a.m.
Broader New York session window: 8:30–11:00 a.m.
London close: 10:00 a.m.–noon.
Asia: 7:00–9:00 p.m.
Late New York equities window: 1:00–4:00 p.m.
ICT labels these as Eastern Standard Time in the recording. Viewers should verify how daylight-saving changes and instrument-specific trading hours affect any historical chart.
Key Lessons From ICT Institutional Price Action
The video’s main contribution is a top-down checklist: establish higher-timeframe direction, wait for a defined session, require lower-timeframe displacement, study a retracement into a newly formed order block, and frame the objective around a prior high or low. A cautious educational use would be to mark these conditions on historical charts and record failures as carefully as apparent matches. The video is a conceptual lesson, not evidence of profitability or a promise that the described levels will hold.
Related Resources
These sources support the concepts discussed above and are provided for independent verification:
BestProps is an independent research publisher. This article is an educational summary of a public lecture. It does not constitute investment advice, and the described framework has not been independently verified for profitability.